Volunacci MT5
- 지표
- 버전: 1.0
- 활성화: 5

Volonacci Indicator
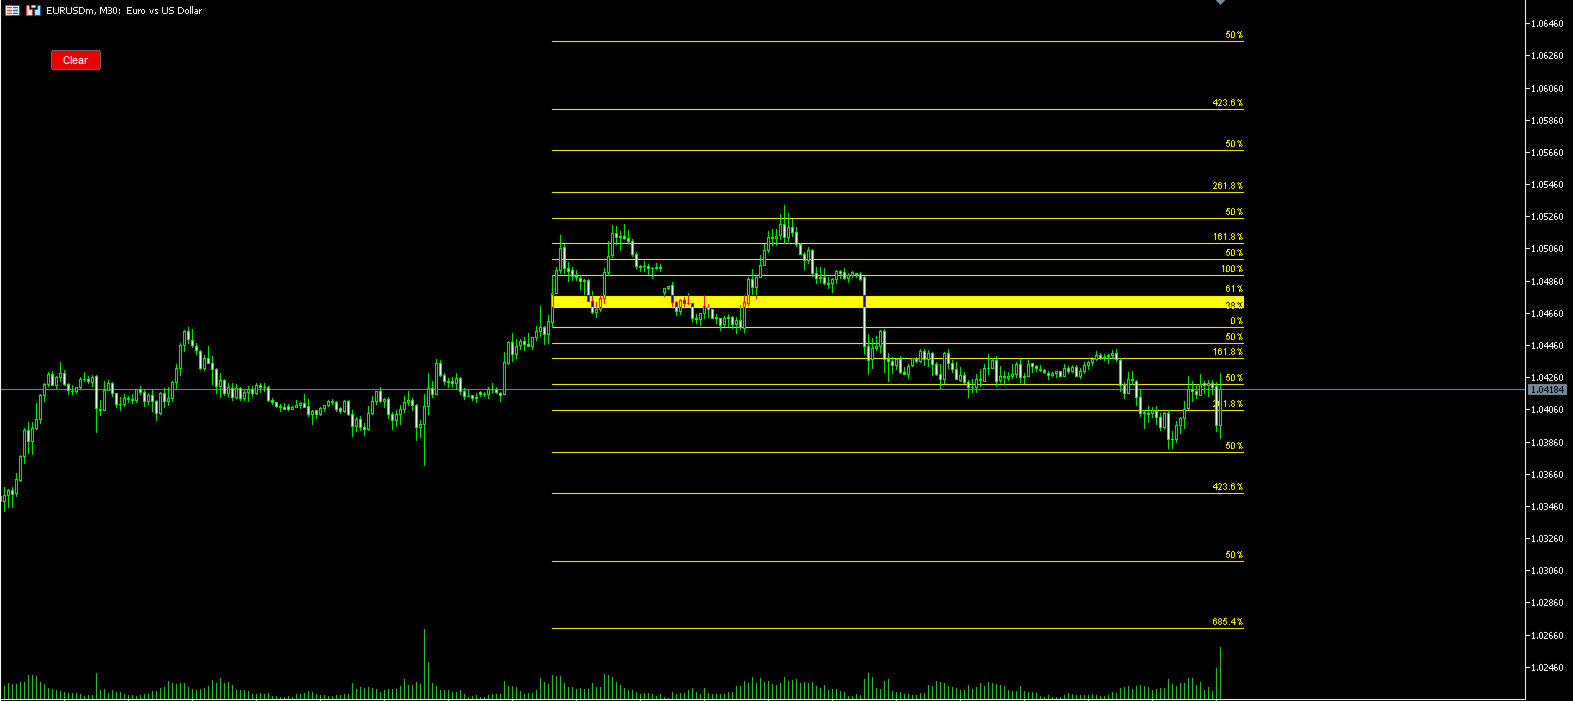
It is an indicator that combines Fibonacci and volume to determine the price direction
This indicator helps you identify Fibonacci angles according to the strategy
The Volonacci indicator is indeed an interesting combination of Fibonacci levels and volume. This indicator uses Fibonacci tools to identify potential support and resistance levels, and enhances this by using volume to confirm the strength behind the price action.
MT4 Version