Candlestick Patterns Scanner MT5

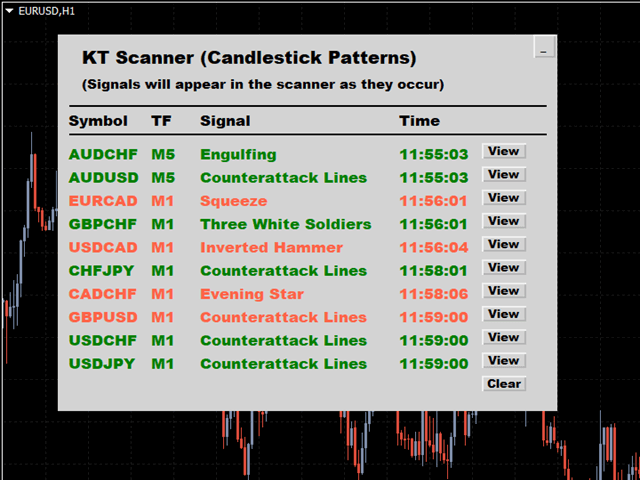
KT Candlestick Patterns Scanner is a Multi-Symbol and Multi-Timeframe scanner that fetches and shows various candlestick patterns on 28 currency pairs and 9 time-frames concurrently.

The scanner finds the candlestick patterns by loading the KT Candlestick Patterns indicator as a resource in the background.

Features

  • The scanner can find the candlestick patterns on 252* combinations of symbols and time-frames from a single chart.
  • Open the signal's chart loaded with a predefined template with a single click.
  • Easy drag n drop anywhere on the chart.
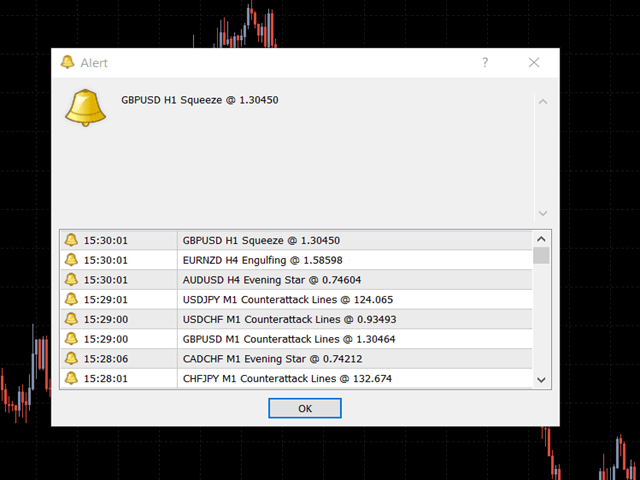
  • Real-time scanner alerts with popup, sound, push-notifications and email alerts.

Included Patterns

----- Reversal Patterns -----

  • Harami
  • Hammer/Shooting Star
  • Engulfing
  • Three White Soldiers/Three Black Crows
  • Three Outside Up/Down
  • Three Inside Up/Down
  • Morning Star/Evening Star
  • Squeeze Pattern
  • Belt Hold
  • Dark Cloud Cover/Piercing
  • Advance Block/Descent Block
  • Counterattack Lines
  • Ladder Bottom/Top
  • Kicker
  • Homing Pigeon/Descending Hawk

----- Trend Continuation Patterns -----

  • Marubozu
  • Rising Window/Falling Window
  • Fakey Breakout
  • Mat Hold
  • Rising Three Method/Falling Three Method

----- Neutral Patterns -----

  • Simple Doji
  • Long Legged Doji
  • Gravestone Doji
  • Dragonfly Doji

Inputs

  • Min. bars between patterns.
  • Select candlestick patterns.
  • Symbols: Insert the symbols to scan.
  • Refresh History: Download and refresh the history data if found distorted or incomplete.
  • Select the Time-frames to scan.
  • Alert Settings
  • Colors and Font size for the panel.
추천 제품
Engulfing Candle Alert MT5
Prafull Manohar Nikam
This is a simple arrow system based on Engulfing Candlestick Pattern. It gives you alerts on your smartphone when there is an engulfing candlestick pattern happens. Which type of alerts available? 1. It paints on chart Up/Down Arrows. 2. Popup message and sound alert in trading terminal window. 3. Push notification or Alert on your Android and IOS mobile phones (requires MT4 or MT5 app installed!) *Note: Use it on higher timeframes like H4 (4 hours), D1 (1 Day) then find trade opportunities on s
Fibonacci Sonar
Lorentzos Roussos
피보나치 소나 피보나치 소나에는 28개의 심볼과 7개의 타임프레임에서 수집한 가격 액션 패턴의 내부 라이브러리가 있습니다. 각 패턴은 2개의 면으로 나뉩니다. 이전 면과 이후 면입니다. 피보나치 소나는 이전 면을 사용하여 유사한 패턴을 인식합니다. 가장 최근의 가격 액션(언제나)부터 가장 최신 막대의 오픈 가격까지 라이브러리를 검색하기 위한 이전 면으로 사용됩니다. 이후 면은 각 패턴에서 본 모든 활동의 집계를 보유합니다. 여기서 피보나치 용어가 등장합니다. 과거에 각 패턴의 모든 인스턴스가 오픈된 것에서 피보나치 시퀀스에서 오픈 가격 위아래의 가격 수준을 배치했습니다. 그런 다음 가격 수준에 도달한 횟수를 측정했습니다. 가격 수준에 도달한 횟수를 개별 가격 패턴에 존재하는 인스턴스 수로 나누면 백분율(%)로 추출할 수 있습니다. 각 패턴에 대해 상위 피보나치 가격과 하위 피보나치 가격에 백분율이 있다고 생각할 수 있습니다. 이를 통해 % 값이 주어진 가격을 찾는 방법이 가능
Introduction to Fractal Pattern Scanner Fractal Indicator refers to the technical indicator that makes use of the fractal geometry found in the financial market. Fractal Pattern Scanner is the advanced Fractal Indicator that brings the latest trading technology after the extensive research and development work in the fractal geometry in the financial market. The most important feature in Fractal Pattern Scanner is the ability to measure the turning point probability as well as the trend probabil
FXLAND Smart Reversal Indicator (MT5) FXLAND Smart Reversal Indicator is a professional technical analysis tool designed to help traders identify potential price reversal zones and key market turning points with clarity and precision. The best reversal indicator and price return by choosing only one ceiling or floor in each time frame A masterpiece of combining mathematics and Gann, fractal matrix, Fibonacci, movement angle and time. Completely intelligent Key Features Detects potenti
Matrix Gold Scalper V10 PRO
Luai Mohammad Amin Azab
Matrix Gold Scalper V10 PRO Matrix Gold Scalper V10 PRO 지표는 특히 골드(XAU/USD) 시장에서 '스캘핑(Scalping)' 전략을 선호하는 트레이더를 위해 설계된 고급 기술 도구입니다. 이 지표는 '장악형 캔들(Engulfing Candle)' 프라이스 액션 전략과 강력한 필터를 결합하여 신호의 품질을 보장합니다. 다음은 지표의 주요 기능 요약과 최상의 결과를 얻기 위한 전문가 팁입니다. 1. 핵심 작동 원리 이 지표는 단일 지표에 의존하지 않으며, 다음 3가지 조건 이 동시에 충족될 때 신호를 생성합니다. 프라이스 액션 (Price Action): 명확한 상승 또는 하락 장악형 캔들 패턴 감지. 추세 확인 (Trend): 매수 신호 시 가격이 13 EMA 위에 있어야 하며, 매도 신호 시에는 아래에 있어야 합니다. 모멘텀 및 강도 (Momentum & Strength): RSI 지표: 매수는 55 이상, 매도는 45 이하여야 합니다
Pivot Hunter EA
Daniel Naranjo Morales
피봇 헌터 EA (Pivot Hunter EA) 피봇 헌터 EA는   CADJPY   통화쌍의   H1 타임프레임 에 맞춰 독점적으로 개발된 전문 자동매매 프로그램(EA)입니다. 이 EA의 전략은 가격 움직임과 모멘텀을 분석하여 시장의 잠재적인 변곡점을 식별하도록 설계되었습니다. EA 로직의 핵심은 여러 지표를 통한 교차 확인 시스템입니다. Parabolic SAR, Awesome Oscillator (AO), Relative Strength Index (RSI), Average True Range (ATR) 등 클래식 지표들의 신호를 종합적으로 활용합니다. 이처럼 다양한 분석 도구들의 신호가 일치할 때만 진입을 고려함으로써, 약한 신호를 걸러내고 더 높은 확률의 거래 기회에 집중하는 것을 목표로 합니다. 이 EA는 CADJPY 통화쌍의 고유한 특성에 맞춰 모든 내부 파라미터가 세심하게 조정되었기 때문에, 특정 상품에 대해 '설정 후 자동 운용(set-and-forget)' 방식을
SchermanActionPro
AutomaticTrading
SchermanActionPro 소개: Automatedtrading의 새로운 자동 거래 봇 Autotrading은 SchermanActionPro를 주요 기능:  • 구성 가능한 지표: Ivan의 권장 사항에 따라 평균 및 양초 수를 조정합니다.  • 운영 유연성: 구매와 판매 중에서 선택합니다.  • 이익 실현: ATR 또는 반대 신호를 기반으로 하는 고정 옵션입니다.  • 손실 중지: ATR에 따라 또는 반대 신호에 따라 고정으로 구성 가능합니다.  • 로트 유형: 고정 로트 선택, 계정 비율의 고정 위험 또는 고정 금액.  • 최대 일괄 보호: 구성 가능.  • 핍 및 슬리피지 크기: 완전히 조정 가능합니다.  • 필터 및 출력: ATR 및 확산 수준에 따라 입력 및 출력 필터를 활성화합니다.  • 이익 실현 및 부분 손실 청산: 수준별로 구성 가능합니다.  • 후행 정지 및 손익분기점: 구성 가능한 거리, 백분율 및 미끄러짐.  • 양초 수에 따른 출력: 구성 가능.  •
Market Markers EA
Tshepo Michael Motaung
This EA is sessions trading robot that allows you to trade the trading session of yours choice as it waits for market markers to make decision for the direction of the day before taking any trades. It has 3 entry signals that uses candle stick patterns, Moving Averages and Range Break to maximize profits and to take advantage of the trending market. The EA practices risk management and has the ability to grow account by risking certain percentage of your account(risk percentage) each time there
Gold Impulse Lab
Dmitriq Evgenoeviz Ko
Gold Impulse Lab is a professional trading advisor for XAUUSD, built on institutional market logic. It uses impulse structures, price action patterns, and a scoring engine instead of binary signals. Gold Impulse Lab is not a scalper or an indicator robot. The advisor analyzes the gold market through a combination of: impulse movement from the anchor price confirmed price action patterns signal strength assessment systems (scoring) filtering by market mode (trend / range) Each trade is opened onl
MT5용 Crypto_Forex 지표 "TREND 히스토그램", 리페인트 불필요 ................................................................................ - TREND 히스토그램 지표는 표준 이동 평균 교차 분석보다 훨씬 민감하고 효율적입니다. - 지표는 두 가지 색상으로 제공됩니다. 약세 추세는 노란색(금색), 강세 추세는 녹색(색상은 설정에서 변경 가능). - TREND 히스토그램에는 모바일 및 PC 알림 기능이 내장되어 있습니다. - 이 지표를 다른 거래 방식(가격 변동, VSA, 기타 지표)과 함께 사용하면 더욱 효과적입니다. - 이 히스토그램은 가격과 거래량 데이터를 하나의 값으로 결합하는 최고의 지표 중 하나입니다. 여기를 클릭하여 고품질 트레이딩 로봇과 지표를 확인하세요! MQL5 웹사이트에서만 제공되는 오리지널 제품입니다.
BlackBox XAU
Enrique Van Rooyen
BlackBox XAU — 골드 전용 고급형 자동매매 프로그램 (EA) 개요 BlackBox XAU는 골드 시장에서 수익을 추구하면서도 드로다운을 철저히 관리하도록 정밀하게 설계된 트레이딩 시스템입니다. 모든 가격 움직임을 따라가는 대신, 규칙 기반의 엄격한 접근 방식을 적용하여 변동성에 적응하고 확률이 높은 거래 기회 만을 선별합니다. EA는 실시간으로 시장 상황을 지속적으로 평가하며, 품질이 낮거나 불확실한 신호를 걸러내고 리스크 대비 보상이 뚜렷하게 유리해지는 순간을 인내심 있게 기다립니다. 조건이 충족되면 정밀한 진입과 함께 시장 상황에 따라 동적으로 조정되는 보호 기능을 갖춘 거래를 실행합니다. 이러한 설계 덕분에 BlackBox는 차트를 불필요한 다수의 거래로 채우지 않고, 양보다 질 을 중시합니다. 통계적으로 우위를 가진 기회에 집중함으로써 트레이더는 안정적인 수익성, 통제 가능한 드로다운, 일관된 위험 대비 성과 를 기대할 수 있습니다. 작동 원리 BlackBox의 핵
Yawabeh SD Pro –  Professional Supply and Demand Indicator Trade Smarter with Volume-Confirmed Supply/Demand Zones Our institutional-grade algorithm identifies high-probability reversal zones before price reacts, giving you the edge in Forex, Crypto, and Stocks. Key Features Multi-Timeframe Confirmation – View trend strength across multiple timeframes simultaneously – Align your trades with higher timeframe momentum Smart Alert System – Real-time notifications for: – Strong demand/supply zone
Aurum Quant Engine Pro
Javed Ali Khan Patan
Aurum Quant Engine Pro A disciplined execution model designed for decision clarity, trend alignment, and precise signal filtration. Trades are triggered only when price structure, directional context, and pattern strength align cohesively. Aurum Quant Engine Pro is the enhanced Version 2 of the original release Aurum Quant Engine now equipped with advanced filtering layers for improved trade quality, precision entries, and stronger overall performance. Support & Feedback If you have any qu
RubdFx Perfect Reversal , The reversal indicator is used to determine areas of support and resistance by Drawing an arrow with a level of supply and demand ( ReversalZones ). - You will catch more swings by reducing the period, and less swings if you increase period - Mobile, computer and email alerts available . it is not pushed by price which means the arrow will stay in one place,suitable for scalping and long term trading  Also Compatible with all forex paris , BUY RULES;  open a buy positio
CRT Pro Dashboard – Multi Timeframe Candle Range Theory Tool CRT Pro Dashboard is a professional multi-timeframe Candle Range Theory (CRT) analysis tool designed for traders who focus on range-based market behavior, liquidity interaction, and structured price expansion . The indicator continuously scans multiple timeframes to detect valid CRT formations , tracks their progression in real time, and displays their status through a clean, intuitive dashboard directly on the chart. What the indic
CChart
Rong Bin Su
Overview In the fast-paced world of forex and financial markets, quick reactions and precise decision-making are crucial. However, the standard MetaTrader 5 terminal only supports a minimum of 1-minute charts, limiting traders' sensitivity to market fluctuations. To address this issue, we introduce the Second-Level Chart Candlestick Indicator , allowing you to effortlessly view and analyze market dynamics from 1 second to 30 seconds on a sub-chart. Key Features Support for Multiple Second-Level
One Man Army
Ihor Otkydach
3.8 (10)
과장도 없고, 불필요한 위험도 없습니다. 최소한의 손실로 거래하기: One Man Army는 개인 트레이더와 프롭 펌(prop firm) 트레이딩 모두를 위해 설계된 다중 통화 거래 시스템입니다. 이 시스템은 단기 및 중기 시장 조정과 반전을 포착하는 스캘핑 전략을 따르며, **지정가 대기 주문(limit order)**을 통해 거래를 수행합니다. 이 트레이딩 봇은 방향을 추측하지 않습니다. 가장 유리한 가격대에서 높은 정밀도로 진입합니다. 당신이 원하는 방식 그대로입니다. 이제 자세히 살펴봅시다. 테스트를 위해 EURCAD 통화쌍과 M15 시간대를 사용하십시오.  One Man Army는 다양한 자산과 시장 단계에서 광범위한 테스트를 거쳐 개발되었습니다. 시스템의 동작은 안정적이며 예측 가능하고, 분석이 용이합니다. 이 시스템은 통제력, 안전성, 체계적인 접근 방식 을 중시하는 트레이더를 위해 만들어졌습니다. LIVE SIGNAL "Double shot" -   Click here
Xtrade Trend Detector
Dago Elkana Samuel Dadie
Xtrade Trend Detector is an indicator capable of finding the best opportunities to take a position in any stock market. Indeed, it is a great tool for scalpers but also for Daytraders. You could therefore use it to identify areas to trade, it fits easily on a chart. I use it to detect trends on Big timeframes and take positions on Small timeframes. Don't hesitate to give me a feedback if you test it.
İşte Korece çevirisi: 반전이 일어나기 전에 포착하세요 이 지표가 하지 않는 것 이것은 매수/매도 신호 생성기가 아닙니다. 거래에 언제 진입하거나 청산할지 자동으로 알려주지 않습니다. 이 지표가 하는 것 Early Reversal Detector는 가격 행동의 변화를 식별하여 최적의 진입점을 정확하게 찾아냅니다. 작동 원리 이 지표는 메인 차트의 가격 캔들과 유사한 캔들을 별도의 패널에 생성하지만 중요한 차이점이 있습니다: 일반 차트 캔들 은 모든 틱 움직임마다 형성됩니다. Early Reversal Detector 캔들 은 가격이 지정한 임계값만큼 점프할 때만 형성됩니다. 예를 들어: EURUSD에서 임계값을 "5"로 설정하면, 지표는 틱 사이에 가격이 0.00005 이상 움직일 때만 틱을 기록합니다. 더 작은 움직임은 완전히 필터링됩니다. 왜 이것이 중요한가? 노이즈를 필터링하고 중요한 가격 움직임에만 집중함으로써 가격 행동 뒤의 진짜 압력을 볼 수 있습니다. 이
Market Steps MT5
Mahdi Ebrahimzadeh
시장 단계 표시기는 Gann 시간/가격 상관 관계를 기반으로 설계 및 구축되었으며 Forex 시장에 대한 가격 조치 특정 규칙에 따라 최적화됩니다. 시장 주문 흐름 개념을 사용하여 대량 주문에 대한 잠재적 가격 영역을 예측합니다. 지표 수준은 거래 자체에 사용하거나 다른 전략/지표의 잘못된 신호를 필터링하기 위한 조합으로 사용할 수 있습니다. 모든 거래자는 차트에 다중 시간 프레임(TF) 영역과 가격 변동 가능성을 함께 표시할 수 있는 강력한 도구가 필요합니다. 테스터 모드에서 파워를 테스트하여 레벨이 차트보다 어떻게 가격을 책정하는지 확인할 수 있습니다. 표시기 장점: 두 개의 서로 다른 영역이 있는 마킹 차트는 서로 다른 TF에 대한 추세 및 범위 시장을 지정합니다. Price Action 거래자는 이를 사용하여 다른 TF/가격 구역의 주문 흐름을 식별하거나 FTR(Fail To Return)/FTC(Fail To Continue)를 확인할 수 있습니다. 시장의 휘발성 및
The indicator scans for TD Combo signals in multiple timeframes for the all markets filtered and shows the results on Dashboard. Key Features Dashboard can be used for all markets It can scan for signals on MN1, W1, D1, H4, H1, M30, M15 ,M5, M1 timeframes Parameters UseMarketWatch: Set true to copy all symbols available in market watch MarketWatchCount : Set the number of symbols that you want to copy from the market watch list. CustomSymbols: Enter the custom symbols that you want to be availa
Visual Trend Reversals — Professional Trend Reversal Indicator for MetaTrader 5 Visual Trend Reversals is a modern and efficient indicator for MetaTrader 5, specifically designed for the timely identification of trend reversal points and analysis of market conditions on any instrument: forex, cryptocurrencies, stocks, indices, and commodities. The indicator is optimized to improve entry quality, minimize false signals, and maximize clarity for traders of any experience level. Key Advantages of V
Liquidity Map
Alex Amuyunzu Raymond
Liquidity Map  Overview The Liquidity Map indicator is an advanced visualization tool based on ICT Smart Money Concepts . It automatically identifies daily Buy Zones , Sell Zones , and Liquidity Levels , showing where price is likely to reverse or continue based on institutional order flow. It calculates key levels from the daily session — such as the previous day’s high, low, and midpoint — then derives a premium (sell bias) and discount (buy bias) structure. When price trades into these mapped
Niubility Trend  Niubility Trend  displays the trend direction for all time frames in real time. You'll see at a glance at which direction the trends are running, how long they last and how powerful they are. All this makes it an easy-to-use trend trading system for beginners, advanced and professional traders. Features Easy to trade Customizable colors and sizes It is non-repainting and non-backpainting It is fantastic as a trailing stop method It implements alerts of all kinds
Send me a message so I can send you the setfile 다양한 구성이 가능한 견고한 로봇 아래 스크린샷의 설정에 따라 10분 기간으로 BTC를 사용하세요. 전문가 로봇을 구매할 경우, 로봇을 지속적으로 개선하기 위해 수정을 요청할 권리가 있습니다. 주요 특징 이동 평균 교차 전략: EA는 두 개의 이동 평균선(MA1과 MA2)을 사용하여 거래 신호를 생성합니다. 빠른 MA(MA1)가 느린 MA(MA2) 위 또는 아래로 교차하면 거래가 시작됩니다. 마팅게일 전략: 거래에서 손실이 발생하면 다음 거래의 로트 크기가 승수(마팅게일 승수)만큼 증가합니다. 마팅게일 시퀀스는 승리한 거래 후 또는 최대 마팅게일 단계 수(maxMartingale)에 도달하면 재설정됩니다. 위험 관리: 손절매(SL) 및 이익실현(TP) 수준은 구성 가능합니다. 수익을 확보하고 손실을 최소화하기 위해 추적 정지 및 손익분기점 기능이 포함되었습니다. 일일 이익/손
ARCS Signal
Kriangkrai Pongtiwat
ARCS Signal v3.0: Adaptive Regime Confluence Signal ARCS Signal v3.0 is a professional-grade, non-repaint indicator for MetaTrader 5 that uses an Adaptive Regime Detection engine . By calculating the Hurst Exponent , the indicator identifies whether the market is currently Trending or Mean-Reverting , adjusting its entry logic automatically to match the environment Key Technical Features Multi-Layer Confluence: Signals are generated only when 4 core modules align: Hurst Regime, Fisher RSI, KAMA
Ultimate Bot Alerts
Rahulkumar Kanani
"Ultimate Bot Alerts 지표는 트레이더가 시장의 잠재적 진입점과 청산점을 식별하는 데 도움이 되는 MetaTrader 5의 강력한 도구입니다. 이 지표는 ATR(Average True Range) 및 가격 조치를 기반으로 한 정교한 알고리즘을 사용하여 매수 및 매도 신호를 생성합니다. Ultimate Bot Alerts 지표를 차트에 적용하면 매수 신호에는 녹색 화살표가, 매도 신호에는 빨간색 화살표가 표시됩니다. 이러한 신호는 가격 차트에 직접 나타나므로 쉽게 알아볼 수 있습니다. 이 지표를 독특하게 만드는 것은 신호를 사고 파는 비대칭적인 접근 방식입니다. 강세 및 약세 시장 상황에 대해 다양한 민감도 설정을 사용하여 다양한 시장 시나리오에 적응할 수 있습니다. 매수 신호의 경우 지표는 보다 보수적인 접근 방식을 취합니다. 더 긴 ATR 기간을 사용합니다. 즉, 더 넓은 범위의 가격 변동을 살펴봅니다. 이로 인해 더 적은 수의 구매 신호가 발생할 수 있지만
KT Forex Sessions MT5
KEENBASE SOFTWARE SOLUTIONS
KT Forex Session shows the different Forex market sessions using meaningful illustration and real-time alerts. Forex is one of the world's largest financial market, which is open 24 hours a day, 5 days a week. However, that doesn't mean it operates uniformly throughout the day. Features Lightly coded indicator to show the forex market sessions without using massive resources. It provides all kinds of Metatrader alerts when a new session starts. Fully customizable. Forex Session Timings Intrad
Hot Trend Zone
Tiofelo Da Olga Gilbert Teles
1. CONSTITUTION Hot Trend Zone is momentum indicator composed of one oscillator and its respective signal. The crossover between the oscillator and the signal generates the Bullish Trend Zone, Bearish Trend Zone, and Neutral Zone. 2. OPERATION As trend filter: bullish filter: if is bullish trending, search for bullish moves. bearish filter: if is bearish trending, search for bearish moves. As entry signal: When combined with a trend filter [preferably the Currency Strength Meter], it provides ve
Link to our best products: LINK Link to our Trading Dashboard: LINK !!!!!!! Attention, you can find premium discounts by clicking on arrows!!!!!! Setting of this indicator candles mode: Show zones from the beginning Swing number for highs and lows Show background color Color of Premium Color of Discount show level 0% line show level 25% line show level 50% line show level 75% line show level 100% line The Premium and Discount concept is a core principle of Smart Money Concepts (SMC) used to i
이 제품의 구매자들이 또한 구매함
Entry In The Zone and SMC Multi Timeframe is a real-time 2-in-1 market analysis tool that combines market structure analysis and a No Repaint BUY / SELL signal system into a single indicator, built on Smart Money Concepts (SMC) — a widely adopted framework used by professional traders to understand market structure. This indicator helps you see the market more clearly, make decisions based on structure rather than guesswork, and focus on high-probability zones where price is more likely to react
Azimuth Pro
Ottaviano De Cicco
5 (6)
Azimuth Pro V2: Synthetic Fractal Structure and Confirmed Entries for MT5 Overview Azimuth Pro is a multi-level swing structure indicator by Merkava Labs . Four nested swing layers, swing-anchored VWAP, ABC pattern detection, three-timeframe structural filtering, and closed-bar confirmed entries — one chart, one workflow from micro-swings to macro-cycles. This is not a blind signal product. It is a structure-first workflow for traders who care about location, context, and timing. V2 Launch Offe
Divergence Bomber
Ihor Otkydach
4.9 (86)
이 지표를 구매하신 분께는 다음과 같은 혜택이 무료로 제공됩니다: 각 거래를 자동으로 관리하고, 손절/익절 수준을 설정하며, 전략 규칙에 따라 거래를 종료하는 전용 도우미 툴 "Bomber Utility" 다양한 자산에 맞게 지표를 설정할 수 있는 셋업 파일(Set Files) "최소 위험", "균형 잡힌 위험", "관망 전략" 모드로 설정 가능한 Bomber Utility의 셋업 파일 이 전략을 빠르게 설치, 설정, 시작할 수 있도록 돕는 단계별 영상 매뉴얼 주의: 위의 모든 보너스를 받기 위해서는 MQL5 개인 메시지 시스템을 통해 판매자에게 연락해 주세요. 독창적인 커스텀 지표인 “Divergence Bomber(다이버전스 봄버)”를 소개합니다. 이 지표는 MACD 다이버전스(괴리) 전략을 기반으로 한 올인원(All-in-One) 거래 시스템입니다. 이 기술 지표의 주요 목적은 가격과 MACD 지표 간의 다이버전스를 감지하고, **향후 가격이 어느 방향으로 움직일지를 알려주는
OmniSync Projection
Antonio-alin Teculescu
5 (1)
Chronos Fractal Engine is an innovative price projection indicator for MetaTrader 5, designed to transform your technical analysis by intelligently identifying and projecting historical price patterns. Built upon an advanced correlation algorithm and the fractal principles of the market, this powerful tool visualizes potential future price movements, giving you a unique edge in your trading decisions. What is Chronos Fractal Engine? At its core, the Chronos Fractal Engine employs a sophisticat
이 지표를 구매하면 제 프로페셔널 트레이드 매니저를 무료로 드립니다. 우선 이 거래 시스템이 리페인팅, 리드로잉 및 레이그 인디케이터가 아니라는 점을 강조하는 것이 중요합니다. 이는 수동 및 로봇 거래 모두에 이상적인 것으로 만듭니다. 온라인 강좌, 설명서 및 프리셋 다운로드. "스마트 트렌드 트레이딩 시스템 MT5"은 새로운 및 경험이 풍부한 트레이더를 위해 맞춤형으로 제작된 종합적인 거래 솔루션입니다. 10개 이상의 프리미엄 인디케이터를 결합하고 7개 이상의 견고한 거래 전략을 특징으로 하여 다양한 시장 조건에 대한 다목적 선택이 가능합니다. 트렌드 추종 전략: 효과적인 트렌드 추이를 타기 위한 정확한 진입 및 손절 관리를 제공합니다. 반전 전략: 잠재적인 트렌드 반전을 식별하여 트레이더가 범위 시장을 활용할 수 있게 합니다. 스캘핑 전략: 빠르고 정확한 데이 트레이딩 및 단기 거래를 위해 설계되었습니다. 안정성: 모든 인디케이터가 리페인팅, 리드로잉 및 레이그가 아니므로 신뢰
FX Trend MT5 NG
Daniel Stein
5 (4)
FX Trend NG: 차세대 멀티 마켓 트렌드 인텔리전스 개요 FX Trend NG 는 다중 시간 프레임 기반의 전문 트렌드 분석 및 시장 모니터링 도구입니다. 몇 초 만에 전체 시장 구조를 파악할 수 있도록 설계되었습니다. 여러 차트를 일일이 전환할 필요 없이, 어떤 종목이 추세에 있는지, 어디에서 모멘텀이 약화되고 있는지, 그리고 어떤 시간 프레임이 서로 정렬되어 있는지 즉시 확인할 수 있습니다. 출시 기념 특별 혜택 – FX Trend NG 를 $30 (6개월) 또는 $80 평생 라이선스 로 이용할 수 있습니다. 이미 Stein Investments 고객이신가요? -> 메시지를 보내 전용 고객 그룹에 참여하세요. 설정이나 사용 방법이 필요하신가요? -> Stein Investments 공식 페이지 를 방문하세요. 1. FX Trend NG가 특별한 이유 3단계 추세 로직 – 단순한 Buy / Sell이 아닙니다 • 대부분의 지표는 Buy 또는 Sell 두 가지 상태만 제
Quantum TrendPulse
Bogdan Ion Puscasu
5 (23)
SuperTrend   ,   RSI   ,   Stochastic   의 힘을 하나의 포괄적인 지표로 결합하여 트레이딩 잠재력을 극대화하는 궁극의 트레이딩 도구   인 Quantum TrendPulse를   소개합니다. 정밀성과 효율성을 추구하는 트레이더를 위해 설계된 이 지표는 시장 추세, 모멘텀 변화, 최적의 진입 및 종료 지점을 자신 있게 식별하는 데 도움이 됩니다. 주요 특징: SuperTrend 통합:   주요 시장 추세를 쉽게 따라가고 수익성의 물결을 타세요. RSI 정밀도:   매수 과다 및 매도 과다 수준을 감지하여 시장 반전 시점을 파악하는 데 적합하며 SuperTrend 필터로 사용 가능 확률적 정확도:   변동성이 큰 시장에서 숨겨진 기회를 찾기 위해 확률적 진동   을 활용하고 SuperTrend의 필터로 사용 다중 시간대 분석:   M5부터 H1 또는 H4까지 다양한 시간대에 걸쳐 시장을 최신 상태로 유지하세요. 맞춤형 알림:   맞춤형 거래 조건이 충족되면
CGE Trading Suite
Carl Gustav Johan Ekstrom
5 (1)
Institutional-Grade Analytics for MT5 C GE Trading Suite delivers the analytical edge typically reserved for professional trading desks. The platform integrates a full suite of analytical tools into one seamless workflow: dynamic grid mapping, liquidity behavior analysis, ECM, trend lines, MIDAS, trade cycles, and directional channel projections. Together, these provide a unified view of market structure and momentum. Directional clarity is further enhanced by the capital flow index, which meas
소개       Quantum Breakout PRO   , 브레이크아웃 존 거래 방식을 변화시키는 획기적인 MQL5 지표! 13년 이상의 거래 경험을 가진 숙련된 트레이더 팀이 개발한       퀀텀 브레이크아웃 PRO       혁신적이고 역동적인 브레이크아웃 존 전략으로 거래 여정을 새로운 차원으로 끌어올리도록 설계되었습니다. Quantum Breakout Indicator는 5개의 이익 목표 영역이 있는 브레이크아웃 영역의 신호 화살표와 브레이크아웃 상자를 기반으로 한 손절 제안을 제공합니다. 초보자 거래자와 전문 거래자 모두에게 적합합니다. Quantum EA 채널:       여기를 클릭하세요 중요한! 구매 후 설치 매뉴얼을 받으려면 개인 메시지를 보내주십시오. 추천: 기간: M15 통화쌍: GBPJPY, EURJPY, USDJPY,NZDUSD, XAUUSD 계정 유형: 스프레드가 매우 낮은 ECN, Raw 또는 Razor 브로커 시간: GMT +3 중개인 :
Meridian Pro
Ottaviano De Cicco
5 (1)
Meridian Pro: Professional Multi-Timeframe Trend Matrix for MT5 Overview Meridian Pro is a multi-timeframe trend matrix by Merkava Labs that compresses directional state, strength, momentum condition and matrix agreement into one compact panel. One adaptive engine, applied consistently from M1 to W1. No per-symbol tuning. No indicator stacking. One structured readout across every asset and every timeframe. Launch Offer — Get Meridian Pro for USD 99 (introductory). Regular price: USD 149. 1. Why
Grabber System MT5
Ihor Otkydach
4.83 (23)
탁월한 기술적 지표인 Grabber를 소개합니다. 이 도구는 즉시 사용 가능한 “올인원(All-Inclusive)” 트레이딩 전략으로 작동합니다. 하나의 코드 안에 강력한 시장 기술 분석 도구, 매매 신호(화살표), 알림 기능, 푸시 알림이 통합되어 있습니다. 이 인디케이터를 구매하신 모든 분들께는 다음의 항목이 무료로 제공됩니다: Grabber 유틸리티: 오픈 포지션을 자동으로 관리하는 도구 단계별 영상 매뉴얼: 설치, 설정, 그리고 실제 거래 방법을 안내 맞춤형 세트 파일: 인디케이터를 빠르게 자동 설정하여 최고의 성과를 낼 수 있도록 도와줍니다 다른 전략은 이제 잊어버리세요! Grabber만이 여러분을 새로운 트레이딩의 정점으로 이끌어 줄 수 있습니다. Grabber 전략의 주요 특징: 거래 시간 프레임: M5부터 H4까지 거래 가능한 자산: 어떤 자산이든 사용 가능하지만, 제가 직접 테스트한 종목들을 추천드립니다 (GBPUSD, GBPCAD, GBPCHF, AUDCAD, AU
FX Power MT5 NG
Daniel Stein
5 (31)
FX Power: 통화 강세 분석으로 더 스마트한 거래 결정을 개요 FX Power 는 어떤 시장 상황에서도 주요 통화와 금의 실제 강세를 이해하기 위한 필수 도구입니다. 강한 통화를 매수하고 약한 통화를 매도함으로써 FX Power 는 거래 결정을 단순화하고 높은 확률의 기회를 발견합니다. 트렌드를 따르거나 극단적인 델타 값을 사용해 반전을 예측하고자 한다면, 이 도구는 귀하의 거래 스타일에 완벽히 적응합니다. 단순히 거래하지 말고, FX Power 로 더 스마트하게 거래하세요. 1. FX Power가 거래자에게 매우 유용한 이유 통화와 금의 실시간 강세 분석 • FX Power 는 주요 통화와 금의 상대적 강세를 계산하고 표시하여 시장 역학에 대한 명확한 통찰력을 제공합니다. • 어떤 자산이 앞서고 있고 어떤 자산이 뒤처지는지 모니터링하여 보다 현명한 거래 결정을 내릴 수 있습니다. 포괄적인 멀티 타임프레임 뷰 • 단기, 중기 및 장기 타임프레임에서 통화와 금의 강세를
Btmm state engine pro
Garry James Goodchild
5 (4)
BTMM State Engine Pro is a MetaTrader 5 indicator for traders who use the Beat The Market Maker approach: Asian session context, kill zone timing, level progression, peak formation detection, and a multi-pair scanner from a single chart. It combines cycle state logic with a built-in scanner dashboard so you do not need the same tool on many charts at once. What it does Draws the Asian session range; session times can follow broker server offset or be set in inputs. Tracks level progression (L
Atomic Analyst MT5
Issam Kassas
3.94 (31)
우선적으로 언급할 점은이 거래 지표가 다시 그리지 않고 지연되지 않으며 이를 통해 수동 및 로봇 거래 모두에 이상적이라는 점입니다. 사용자 매뉴얼: 설정, 입력 및 전략. Atomic Analyst는 가격의 강도와 모멘텀을 활용하여 시장에서 더 나은 이점을 찾는 PA Price Action Indicator입니다. 고급 필터를 장착하여 잡음과 거짓 신호를 제거하고 거래 잠재력을 높이는 데 도움이 됩니다. 복잡한 지표의 다중 레이어를 사용하여 Atomic Analyst는 차트를 스캔하고 복잡한 수학적 계산을 간단한 신호와 색상으로 변환하여 초보 트레이더가 이해하고 일관된 거래 결정을 내릴 수 있도록합니다. "Atomic Analyst"는 새로운 및 경험이 풍부한 트레이더를위한 종합적인 거래 솔루션입니다. 프리미엄 지표와 최고 수준의 기능을 하나의 거래 전략에 결합하여 모든 종류의 트레이더에 대한 다재다능한 선택지가되었습니다. 인트라데이 거래 및 스캘핑 전략 : 빠르고 정확한 일일
RelicusRoad Pro MT5
Relicus LLC
5 (24)
RelicusRoad Pro: 퀀트 시장 운영 체제 70% 할인 평생 이용권 (한정 시간) - 2,000명 이상의 트레이더와 함께하세요 왜 대부분의 트레이더는 "완벽한" 지표를 가지고도 실패할까요? 진공 상태에서 단일 개념 만으로 거래하기 때문입니다. 문맥 없는 신호는 도박입니다. 지속적인 승리를 위해서는 컨플루언스(중첩) 가 필요합니다. RelicusRoad Pro는 단순한 화살표 지표가 아닙니다. 완전한 퀀트 시장 생태계 입니다. 독점적인 변동성 모델링을 사용하여 가격이 이동하는 "공정 가치 로드"를 매핑하고, 단순 노이즈와 실제 구조적 돌파를 구분합니다. 추측은 그만두세요. 기관급 로드 로직으로 거래를 시작하세요. 핵심 엔진: "Road" 알고리즘 시스템의 중심에는 시장 상황에 실시간으로 적응하는 동적 변동성 채널인 Road Algo 가 있습니다. 세이프 라인(평형) 과 가격이 수학적으로 반전될 가능성이 높은 확장 레벨 을 투영합니다. Simple Road: 일반적인 시장을 위
ARICoins
Temirlan Kdyrkhan
ARICoin is a powerful trading companion designed to generate high-probability entry signals with dynamic TP/SL/DP levels based on volatility. Built-in performance tracking shows win/loss stats, PP1/PP2 hits, and success rates all updated live. Key Features: Buy/Sell signals with adaptive volatility bands Real-time TP/SL/DP levels based on ATR Built-in MA Filter with optional ATR/StdDev volatility Performance stats panel (Success, Profit/Loss, PP1/PP2) Alerts via popup, sound, push, or email Cust
ARIPoint
Temirlan Kdyrkhan
ARIPoint is a powerful trading companion designed to generate high-probability entry signals with dynamic TP/SL/DP levels based on volatility. Built-in performance tracking shows win/loss stats, PP1/PP2 hits, and success rates all updated live. Key Features: Buy/Sell signals with adaptive volatility bands Real-time TP/SL/DP levels based on ATR Built-in MA Filter with optional ATR/StdDev volatility Performance stats panel (Success, Profit/Loss, PP1/PP2) Alerts via popup, sound, push, or email Cu
ICT PO3 (Power of 3) AMD Protocol Framework Indicator True Time & Structure Integration   |  Non-Repainting | Real-Time  | Multi-Asset  | MT4 Version Available Full Setup Guide & Strategy Playbook: https://www.mql5.com/en/blogs/post/768683 MT4 Version: https://www.mql5.com/en/market/product/171742 Indicator Overview The ICT PO3 AMD Protocol Framework is a complete structural overlay for MetaTrader 5 that maps the True Daily Cycle directly onto your lower-timeframe execution chart. It projects
Gartley Hunter Multi
Siarhei Vashchylka
5 (11)
Gartley Hunter Multi - An indicator for searching for harmonic patterns simultaneously on dozens of trading instruments and on all possible timeframes. Manual (Be sure to read before purchasing) | Version for MT4 Advantages 1. Patterns: Gartley, Butterfly, Shark, Crab. Bat, Alternate Bat, Deep Crab, Cypher 2. Simultaneous search for patterns on dozens of trading instruments and on all possible timeframes 3. Search for patterns of all possible sizes. From the smallest to the largest 4. All fou
Bill Williams Advanced
Siarhei Vashchylka
5 (11)
Bill Williams Advanced is designed for automatic chart analysis using Bill Williams' "Profitunity" system. The indicator analyzes four timeframes at once. Manual (Be sure to read before purchasing) Advantages 1. Analyzes the chart using Bill Williams' "Profitunity" system. Signals are displayed in a table in the corner of the screen and on the price chart. 2. Finds all known AO and AC signals, as well as zone signals. Equipped with a trend filter based on the Alligator. 3. Finds "Divergence Bar
TPA True Price Action indicator reveals the true price action of the market makers through 100% non-repainting signals strictly at the close of a candle! TPA shows entries and re-entries, every time the bulls are definitely stronger than the bears and vice versa. Not to confuse with red/green candles. The shift of power gets confirmed at the earliest stage and is ONE exit strategy of several. There are available now two free parts of the TPA User Guide for our customers. The first "The Basics"
Currency Strength Dashboard Pro
Anastasia Danilova
5 (1)
Currency Strength Dashboard Pro MetaTrader 5 를 위한 실시간 통화 강도 분석 전문 대시보드 입니다. 이 지표는 8개의 주요 통화 (EUR, USD, GBP, JPY, CHF, AUD, CAD, NZD)의 강도를 계산하고, 28개의 통화쌍 을 동시에 여러 시간 프레임에서 분석하여 표시합니다. 이 대시보드는 트레이더가 추가 계산이나 여러 차트 간 전환 없이 한눈에 시장 전체 상황을 파악 할 수 있도록 해줍니다. 계산 방법 이 지표는 고급 수학적 통화 강도 분석 방법 을 기반으로 합니다. 이는 유사한 지표에서 널리 사용되는 RSI 기반 방법 보다 더 정확하고 객관적인 결과를 제공합니다. 이 방법은 28개의 모든 통화쌍 간의 관계를 동시에 분석 하여 시장에서 실제로 형성되는 힘의 균형을 보다 명확하고 편향 없이 보여줍니다. 실시간 대시보드 메인 테이블에는 8개의 통화 에 대한 전체 데이터가 표시됩니다. Rank (순위) — 전체 강도 기준 통화 순위, 1
PZ Support Resistance MT5
PZ TRADING SLU
3.71 (7)
Unlock key market insights with automated support and resistance lines Tired of plotting support and resistance lines? This is a multi-timeframe indicator that detects and plots supports and resistance lines in the chart with the same precision as a human eye would. As price levels are tested over time and its importance increases, the lines become thicker and darker, making price leves easy to glance and evaluate. [ Installation Guide | Update Guide | Troubleshooting | FAQ | All Products  | 
Aurum Apex MT5
Hugo Feruglio
대부분의 골드 지표는 가격이 어디에 있었는지 를 보여줍니다. Aurum Apex는 대다수가 진입하기 전에 가격이 어디로 가는지를 보여줍니다. 이것은 주장이 아닙니다. 이것이 바로 이 시스템의 설계입니다. Aurum Apex란 무엇인가요? Aurum Apex는 MetaTrader 5를 위한 리페인트 없는 XAUUSD 스캘핑 지표 로, 오직 하나의 종목인 골드만을 중심으로 구축되었습니다. 가격 확장이 완전한 속도에 도달하기 전, 브레이크아웃 모멘텀의 시작점을 포착하도록 설계되었습니다. 리페인트하지 않습니다. 지연되지 않습니다. 추측하지 않습니다. 모든 신호는 차트에 완전히 표시된 진입선, 스탑로스, 테이크프로핏과 함께 도착합니다. 버튼 하나를 클릭하기 전에 이미 트레이드 전체가 정의되어 있습니다. 암산 불필요. 모호함 없음. 망설임 없음. 골드 스캘핑에서 수익과 손실의 차이는 종종 초 단위로, 그리고 누가 먼저 진입했는지로 결정된다는 것을 이해하는 트레이더를 위한 정밀 도구입니다. 핵심
Weltrade Spike Sentinel
Batsirayi L Marango
5 (1)
Introducing Indicator for PainX and GainX Indices Traders on Weltrade Get ready to experience the power of trading with our indicator, specifically designed for Weltrade   broker's PainX and GainX Indices.  Advanced Strategies for Unbeatable Insights Our indicator employs sophisticated strategies to analyze market trends, pinpointing optimal entry and exit points.  Optimized for Maximum Performance To ensure optimal results, our indicator is carefully calibrated for 5-minute timeframe charts on
Easy SMC Trading
Israr Hussain Shah
3 (2)
자동 위험 관리 및 구조 돌파 스캐너를 포함한 구조 추세 분석 버전: 1.0 개요 자동 위험 관리 기능을 갖춘 구조 추세 분석은 가격 움직임과 시장 구조에 의존하는 트레이더를 위해 설계된 종합적인 트레이딩 시스템입니다. 부드러운 추세 필터와 스윙 포인트 감지, 구조 돌파(BOS) 신호를 결합하여 높은 확률의 거래 설정을 생성합니다. 이 도구의 가장 두드러진 특징은 자동 위험 관리 기능입니다. 유효한 구조 돌파가 감지되면 지표는 즉시 위험/보상 영역(1:1, 1:2, 1:3)을 계산하고 표시하며, 가격이 목표에 도달할 때 거래 시각화를 자동으로 관리합니다. 수동으로 차트를 그릴 필요가 없어 트레이더는 실행에만 집중할 수 있습니다. 주요 기능 동적 구조 돌파(BOS) 감지 스윙 고점(HH/LH)과 스윙 저점(HL/LL)을 자동으로 식별합니다. 가격이 주요 구조적 레벨을 돌파할 때 차트에 BOS 라인을 직접 표시하여 추세 방향을 확인합니다. 구조적 핵심 지점을 명확한 텍스트
Automated Trendlines MT5
Georgios Kalomoiropoulos
추세선은 외환 거래에서 기술적 분석의 가장 필수적인 도구입니다. 불행히도, 대부분의 거래자는 올바르게 그리지 않습니다. 자동 추세선 표시기는 시장의 추세 움직임을 시각화하는 데 도움이 되는 진지한 거래자를 위한 전문 도구입니다. 추세선 강세 추세선과 약세 추세선에는 두 가지 유형이 있습니다. 상승 추세에서 Forex 추세선은 가격 움직임의 가장 낮은 스윙 포인트를 통해 그려집니다. 최소 두 개의 "최저 저점"을 연결하면 추세선이 생성됩니다. 하락 추세에서 추세선은 가격 움직임의 가장 높은 스윙 포인트를 통해 그려집니다. 최소 두 개의 "최고 최고점"을 연결하면 추세선이 생성됩니다. 추세선이 깨질 때? 강세 추세선은 약세 양초가 강세 추세선 아래에서 닫히고 양초의 고점이 추세선 위에 있을 때 깨집니다. 약세 추세선은 강세 양초가 약세 추세선 위로 마감되고 양초 저점이 추세선 아래에 있을 때 깨집니다. 추세선이 삭제되면? 강세 추세선은 전체 양초가 강세 추세선 아래에
Smart Structure Concepts MT5
Cristhian Alexander Gaibor Cuasquer
Smart Structure Concepts MT5 는 단순한 SMC 지표가 아닙니다. MetaTrader 5를 위해 만들어진 가장 완전한 기관 트레이딩 시스템입니다 — 실시간 구조 감지, 스마트 존 매핑, 교육적 툴팁, 실시간 푸시 알림을 하나의 검증된 도구에 통합했습니다. 시장의 대부분 SMC 지표는 선과 박스만 그리고 당신을 추측하게 만듭니다. 이 지표는 모든 신호를 차트에서 직접 설명합니다. BOS, CHoCH, 오더 블록, 공정가치 갭 등 어떤 객체 위에도 커서를 올리면 즉시 그 의미, 중요성, 다음에 해야 할 일을 정확히 확인할 수 있습니다. 추측 불필요. 외부 가이드 불필요. 필요한 모든 것이 이미 차트에 있습니다. 이것은 당신의 전체 SMC 툴킷을 대체하는 지표입니다. 실시간 구조 감지 내부 및 스윙 BOS와 CHoCH를 봉마다 추적합니다. 엔진은 기관 자금 흐름을 지속적으로 따릅니다 — 리페인트 없음, 지연 없음, 거짓 없음. 선택적 컨플루언스 필터가 약한 신호를 화
MACD Intraday Trend PRO는 1960년대 Gerald Appel이 만든 원본 MACD를 개조하여 개발한 지표입니다. 수년간의 거래를 통해 MACD의 매개변수를 피보나치 비율로 변경함으로써 추세 움직임의 연속성을 더 잘 표현함으로써 가격 추세의 시작과 끝을 보다 효율적으로 감지할 수 있다는 것이 관찰되었습니다. 가격 추세를 감지하는 효율성으로 인해 상단과 하단의 차이를 매우 명확하게 식별하여 거래 기회를 더 잘 활용할 수도 있습니다. 특징 표시기 MACD Intraday Trend PRO는 모든 통화 쌍, 모든 시간대 및 Renko 차트에서 작동합니다. 5가지 모드를 선택하여 추세 감지 속도를 설정할 수 있습니다. 가장 빠른 빠른 정상 느린 가장 느림 자원 6개의 구성 가능한 경고가 있습니다. MACD는 신호 라인에서 후퇴 MACD가 신호선을 넘다 MACD는 레벨 0을 교차 신호선이 레벨 0을 넘습니다. MACD 변경 트렌드 색상 신호선 변경 TREND 색상
RFI levels PRO MT5
Roman Podpora
3.67 (3)
이 지표는 추세 반전 지점과 가격 반등 영역을 정확하게 보여줍니다.       주요 투자자들   . 새로운 트렌드가 형성되는 곳을 파악하고 최대한 정확하게 의사결정을 내리며 모든 거래를 완벽하게 통제합니다. TREND LINES PRO   지표와 함께 사용할 때 최대의 잠재력을 발휘합니다.  VERSION MT4 지표가 보여주는 내용: 새로운 추세의 시작 시 활성화되는 반전 구조 및 반전 수준. 최소한의 위험 대비 수익률을 갖는 이익 실현   (TAKE PROFIT)   및   손절매(STOP LOSS)   레벨 표시       RR 1:2   . 지능형 손실 감소 로직이 적용된 손절매 기능. 지정된 지표에서 두 가지 추세 유형에 대한 반전 패턴을 표시합니다. 지표: 트렌드를 따라   트렌드 라인 프로   (글로벌 트렌드 변화) 트렌드 프로   (빠른 트렌드 변화) 간단하고 효과적입니다       스캐너       실시간 추세 (신규). 다중 시간 프레임 도구 필터링. 표시하다  
제작자의 제품 더 보기
ACB Breakout Arrows MT5
KEENBASE SOFTWARE SOLUTIONS
3.5 (2)
ACB Breakout Arrows 지표는 특별한 돌파 패턴을 감지하여 시장에서 중요한 진입 신호를 제공합니다. 이 지표는 차트를 지속적으로 스캔하면서 한 방향으로 움직임이 자리 잡을 때를 포착하여 큰 움직임 직전에 정확한 진입 신호를 제공합니다. 다중 종목 및 다중 시간대 스캐너는 여기에서 확인하세요 - ACB Breakout Arrows MT5용 스캐너 핵심 기능 지표가 자동으로 손절(Stop Loss) 및 익절(Take Profit) 수준을 제공합니다. 모든 시간대의 돌파 신호를 추적하는 MTF 스캐너 대시보드 포함. 데이 트레이더, 스윙 트레이더 및 스캘퍼에게 적합합니다. 신호 정확도를 높이기 위해 최적화된 알고리즘 사용. 손익분기점 또는 빠른 수익 목표를 위한 특별한 라인 (Quick Profit Line) 제공. 승률, 성공 비율, 평균 수익 등의 성과 분석 지표 제공. 재도색 없음. 신호는 고정되어 신뢰할 수 있습니다. 거래 확인 - ACB Trade Filter 지
KT Heiken Ashi Smoothed MT5
KEENBASE SOFTWARE SOLUTIONS
KT Heiken Ashi Smoothed 는 표준 Heiken Ashi 를 한층 더 부드럽게 처리한 버전으로, 추세 전환 시 매수/매도 화살표도 함께 표시합니다. 복잡한 설정 없이 시장의 핵심 변화를 직관적으로 보여주기 때문에 바쁜 트레이더에게 유용합니다. 상태가 약세에서 강세로 전환되면 매수 화살표가 나타납니다. 상태가 강세에서 약세로 전환되면 매도 화살표가 나타납니다. 모바일 알림, 이메일, 소리, 팝업 경고를 모두 지원합니다. Heiken Ashi Smoothed 란? 표준 Heiken Ashi 에 존재하는 잡음과 허위 신호를 제거하기 위해 두 개의 이동 평균으로 가격 데이터를 부드럽게 처리합니다. 약간의 지연은 있지만, 스윙 포인트와 새롭게 형성되는 추세를 명확히 드러내며, 평소 시야에 잘 들어오지 않는 가격 변화를 확인할 수 있습니다. 이를 통해 트레이더는 진입·청산 전략과 리스크 관리를 세밀하게 조정할 수 있습니다. 활용 이 지표는 외환, 원자재, 주식 등 다양한
Use of support and resistance in systematic trading is very subjective. Every trader has their own idea and way to plotting the support and resistance levels on the chart. KT Support and Resistance indicator take out this ambiguity out of the situation and automatically draws support and resistance levels following an algorithmic approach using a unique multi-timeframe analysis. When launched on the chart, It immediately scan the most significant extreme points across all the available timefra
ACB Trade Filter MT5
KEENBASE SOFTWARE SOLUTIONS
ACB Trade Filter indicator provides a way to filtering out the low probability trading entries in a trading strategy. The indicator uses a sophisticated filtration algorithm based on the market sentiment and trend. The MT4 version of the same indicator is available here ACB Trade Filter MT4 Applications Works great with our indicator ACB Breakout Arrows MT5 Filter out low probability signals from any indicator. Avoid over-trading and minimize the losses. Trade in the direction of market sentime
KT Heiken Ashi Smoothed MT4
KEENBASE SOFTWARE SOLUTIONS
KT Heiken Ashi Smoothed 는 표준 Heiken Ashi 를 한층 더 부드럽게 처리한 버전으로, 추세 전환 시 매수/매도 화살표도 함께 표시합니다. 복잡한 설정 없이 시장의 핵심 변화를 직관적으로 보여주기 때문에 바쁜 트레이더에게 유용합니다. 상태가 약세에서 강세로 전환되면 매수 화살표가 나타납니다. 상태가 강세에서 약세로 전환되면 매도 화살표가 나타납니다. 모바일 알림, 이메일, 소리, 팝업 경고를 모두 지원합니다. Heiken Ashi Smoothed 란? 표준 Heiken Ashi 에 존재하는 잡음과 허위 신호를 제거하기 위해 두 개의 이동 평균으로 가격 데이터를 부드럽게 처리합니다. 약간의 지연은 있지만, 스윙 포인트와 새롭게 형성되는 추세를 명확히 드러내며, 평소 시야에 잘 들어오지 않는 가격 변화를 확인할 수 있습니다. 이를 통해 트레이더는 진입·청산 전략과 리스크 관리를 세밀하게 조정할 수 있습니다. 활용 이 지표는 외환, 원자재, 주식 등 다양한
KT Psar Arrows
KEENBASE SOFTWARE SOLUTIONS
KT Psar Arrows는 표준 파라볼릭 SAR 지표를 사용하여 차트에 화살표를 표시합니다. 캔들의 고가가 SAR에 닿을 때 상승 화살표가 표시되고, 캔들의 저가가 SAR에 닿을 때 하락 화살표가 표시됩니다. 신호는 봉이 마감되기를 기다리지 않고 실시간으로 생성됩니다.  특징 Parabolic SAR 지표를 활용한 거래 전략을 실험하고 싶은 트레이더에게 유용한 도구입니다.  시장 반전 포인트를 찾는 데 사용할 수 있습니다. 사용자 정의 PSAR 입력 지원. MT4의 모든 알림 기능을 지원합니다. 주의사항: Parabolic SAR은 후행성 및 엄격한 기계적 지표입니다. 모든 잠재적 거래는 명확히 정의된 규칙에 따라 필터링해야 합니다.     입력 파라미터 PSAR 스텝: 스텝 값을 입력하세요. PSAR 최대값: 최대값을 입력하세요. PSAR 점 표시: PSAR 점을 표시하거나 숨길 수 있습니다. PSAR 점을 표시하지 않아도 화살표는 정상 작동합니다. 나머지 입력 항목은 직관적
KT Round Numbers MT5
KEENBASE SOFTWARE SOLUTIONS
KT Round Numbers plots the round number levels which are also commonly known as psychological levels in the Forex world. In the context of Forex trading, round number levels are those levels in which there are two or more zeroes at the end. They are named as 00 levels on the chart. Some traders also consider the halfway points as a valid round number level. They are named as 50 levels on the chart. Use of round number levels in trading Round number levels work as strong support and resistance
KT Momentum Arrows MT5
KEENBASE SOFTWARE SOLUTIONS
5 (2)
KT Momentum Arrows 인디케이터는 순간적인 돌파 신호에 기반한 도구로, 밴드의 이탈 범위와 특정 방향으로 나타나는 변동성을 계산하여 신호를 생성합니다. 이 도구는 가격의 강한 움직임이 시작되는 시점을 빠르게 감지할 수 있도록 설계되었습니다. 가격이 상단 밴드를 상향 돌파하여 마감되면 매수 신호가 생성되며, 하단 밴드를 하향 돌파하여 마감되면 매도 신호가 생성됩니다. 밴드의 이탈과 변동성에 동시에 영향을 주는 '계수' 입력값이 있으며, 이는 거래 종목 및 시간 프레임에 따라 신중하게 분석 및 선택해야 합니다. 주요 특징 재도색 없음! 모멘텀 트레이더를 위한 훌륭한 진입 도구입니다. 승률, 손익비, 평균 수익 등 성과 분석 기능 포함. 단타, 스윙, 스캘핑 모든 스타일에 적합합니다. 입력 파라미터 히스토리 바:  지표 계산에 사용할 바의 수. 모멘텀 계수:  밴드 이탈 및 변동성 측정에 사용하는 계수. 성과 분석:  수익 추세선을 포함한 성과 분석 표시 여부.  알림
KT Asian Breakout
KEENBASE SOFTWARE SOLUTIONS
4 (1)
KT Asian Breakout carefully analyzes the range-bound market during the Asian session and then fires a long or short trade after doing some preassessment based on its inbuilt technical analysis module. The executed orders are closed within a day before the completion of the next day session. The inbuilt technical analysis module checks for the session range and compares it with the last 20 days price movement. If it finds any erratic price movement within the session, the orders are not executed
KT RSI Divergence Robot MT4
KEENBASE SOFTWARE SOLUTIONS
KT RSI Divergence robot은 가격과 RSI(Relative Strength Index) 오실레이터 사이에 형성되는 일반 및 숨겨진 다이버전스를 거래하는 100% 자동화된 전문가용 어드바이저입니다. 다이버전스 신호는 무료로 제공되는 RSI Divergence 지표에서 가져옵니다. 모든 다이버전스가 성공적인 가격 반전을 보장하는 것은 아닙니다. 따라서 이 EA는 원시 다이버전스 신호에 내장된 기술적 분석 모듈을 결합하여, 선택된 일부 다이버전스 이후 나타나는 가격 비효율성을 공략합니다. 권장 사항 Pairs:   EURUSD, EURCAD, EURCHF, EURJPY, GBPJPY,USDCHF, USDJPY, XAUUSD Time-Frame:   1시간 Account Type:   제한 없음 Leverage:    1:100 R isk:   거래당 1% 특징 RSI 다이버전스 신호를 자동으로 거래하며, 수동 거래로는 구현이 거의 불가능한 다양한 고급 기능을 제공합
KT CCI Divergence MT5
KEENBASE SOFTWARE SOLUTIONS
KT CCI Divergence shows the regular and hidden divergence created between the price and CCI oscillator. Divergence is one of the vital signals that depicts the upcoming price reversal in the market. Manually spotting the divergence between price and CCI can be a hectic and ambiguous task. Limitations of KT CCI Divergence   Using the CCI divergence as a standalone entry signal can be risky. Every divergence can't be interpreted as a strong reversal signal. For better results, try to combine it w
ACB Breakout Arrows
KEENBASE SOFTWARE SOLUTIONS
4.15 (34)
ACB Breakout Arrows 지표는 특별한 돌파 패턴을 감지하여 시장에서 매우 중요한 진입 신호를 제공합니다. 이 지표는 차트를 지속적으로 스캔하며 한 방향으로 안정적인 모멘텀이 형성되는지를 확인하고, 주요 움직임 직전에 정확한 진입 신호를 제공합니다.  다중 심볼 및 다중 타임프레임 스캐너 받기 – ACB Breakout Arrows MT4용 스캐너 주요 기능 지표가 자동으로 손절(Stop Loss) 및 이익실현(Take Profit) 레벨을 제공합니다. 모든 시간대의 돌파 신호를 추적하는 MTF 스캐너 대시보드가 포함되어 있습니다. 단타 트레이더, 스윙 트레이더, 스캘퍼에게 적합합니다. 정확도를 높이기 위한 최적화된 알고리즘 사용. 손익분기(Breakeven) 또는 단기 목표를 위한 특수 라인(퀵 프로핏 라인) 제공. 승률, 성공률, 평균 수익 등과 같은 성과 분석 지표 제공. 리페인트 없음 – 한번 생성된 신호는 사라지지 않습니다. 거래 확인 -  신뢰도 낮은 신호를
ACB Trade Filter MT4
KEENBASE SOFTWARE SOLUTIONS
5 (1)
The ACB Trade Filter indicator provides a solution for filtering out the low probability trading setups in a trading strategy. The indicator uses a sophisticated filtration algorithm based on the market sentiment and trend. Applications Works great with our indicator " ACB Breakout Arrows ". Filter out low probability signals from any indicator. Avoid overtrading and minimize the losses. Trade in the direction of market sentiment and trend. Avoid the choppiness in the market. How to use Only L
KT Momentum Arrows
KEENBASE SOFTWARE SOLUTIONS
KT Momentum Arrows 인디케이터는 순간적인 돌파 신호에 기반한 도구로, 밴드의 이탈 범위와 특정 방향으로 나타나는 변동성을 계산하여 신호를 생성합니다. 이 도구는 가격의 강한 움직임이 시작되는 시점을 빠르게 감지할 수 있도록 설계되었습니다. 가격이 상단 밴드를 상향 돌파하여 마감되면 매수 신호가 생성되며, 하단 밴드를 하향 돌파하여 마감되면 매도 신호가 생성됩니다. 밴드의 이탈과 변동성에 동시에 영향을 주는 '계수' 입력값이 있으며, 이는 거래 종목 및 시간 프레임에 따라 신중하게 분석 및 선택해야 합니다. 주요 특징 재도색 없음! 모멘텀 트레이더를 위한 훌륭한 진입 도구입니다. 승률, 손익비, 평균 수익 등 성과 분석 기능 포함. 단타, 스윙, 스캘핑 모든 스타일에 적합합니다. 입력 파라미터 히스토리 바:  지표 계산에 사용할 바의 수. 모멘텀 계수:  밴드 이탈 및 변동성 측정에 사용하는 계수. 성과 분석:  수익 추세선을 포함한 성과 분석 표시 여부.  알림
KT COG Advanced MT4
KEENBASE SOFTWARE SOLUTIONS
1 (1)
KT COG is an advanced implementation of the center of gravity indicator presented by John F. Ehlers in the May 2002 edition of Technical Analysis of Stocks & Commodities magazine. It's a leading indicator which can be used to identify the potential reversal points with the minimum lag. The COG oscillator catches the price swings quite effectively. MT5 version of the same indicator is available here KT COG Advanced MT5 Calculation of COG The COG indicator is consist of the two lines. The main l
KT Pin Bar
KEENBASE SOFTWARE SOLUTIONS
KT Pin Bar identifies the pin bar formation which is a type of price action pattern which depicts a sign of reversal or rejection of the trend. When combined with support and resistance, BRN and other significant levels, Pin Bar pattern proved to be a very strong sign of reversal. Basically, a pin bar is characterized by a small body relative to the bar length which is closed either in upper or lower 50% part of its length. They have very large wicks and small candle body. A pin bar candlestic
KT Trend Magic
KEENBASE SOFTWARE SOLUTIONS
KT Trend Magic shows the trend depiction on chart using the combination of market momentum and volatility. A smoothing coefficient is used to smooth out the noise from the signal.It can be used to find out the new entries or confirm the trades produced by other EA/Indicators. Usage Drag n drop MTF scanner which scans for the new signals across multiple time-frames. Find new entries in the trend direction. Improve the accuracy of other indicators when used in conjunction. Can be used as a dynami
KT Auto Fibo
KEENBASE SOFTWARE SOLUTIONS
KT Auto Fibo는 현재 추세 방향에 따라 피보나치 되돌림 레벨을 자동으로 그립니다. 고점과 저점은 차트에 표시된 최대값과 최소값을 사용하여 자동으로 선택됩니다. 사용자는 차트를 확대/축소하거나 스크롤하여 피보나치 레벨을 적절히 조정할 수 있습니다. 모드 자동:  차트 영역을 기반으로 피보나치 레벨을 자동으로 그립니다. 수동: 피보나치 레벨을 한 번만 그리고, 이후에는 앵커 포인트를 수동으로 조정할 수 있습니다. 사용 방법: 미래 수익 목표를 논리적으로 예측하는 데 도움이 됩니다. 지지/저항선이나 추세선과 결합하면 강력한 반전 가능성을 제공합니다. 추세 시장에서 저위험 진입 기회를 제공합니다. 입력 매개변수 자동:  사람의 개입 없이 피보나치 되돌림 레벨을 자동으로 그립니다. 수동:  피보나치 되돌림 레벨을 한 번만 그리고, 이후에는 앵커 포인트를 직접 늘릴 수 있습니다. 미되돌림 영역 표시: 가격 되돌림이 아직 닿지 않은 차트 영역을 표시하거나 숨깁니다. 나머지 입력 항
KT Ichimoku Trader
KEENBASE SOFTWARE SOLUTIONS
1 (1)
KT Ichimoku Trader is a fully automated expert advisor that offers five popular trading strategies based on the Ichimoku indicator. Each strategy has it's own entry and exit method without any interference to other strategies. The Ichimoku system can be applied to all major currency pairs and metals. However, we found that it performs reasonably well mainly on two pairs.   MT5 Version is available here  https://www.mql5.com/en/market/product/35043 Features Trade up to 5 famous trading strategi
KT Volatility Oscillator
KEENBASE SOFTWARE SOLUTIONS
KT 변동성 오실레이터는 과거와 현재의 시장 데이터를 수학적 공식으로 분석하여 오실레이터 형태로 결과를 표시합니다. 증가하는 파동과 감소하는 파동은 각각 자산의 높은 변동성과 낮은 변동성을 나타냅니다.  간단히 말해, 변동성은 일정 기간 동안 자산 가격이 얼마나 변동했는지를 측정하는 지표입니다. 변동성이 없다면 시장의 움직임이 거의 없을 것이고, 트레이더들은 가격 변동을 통해 수익을 얻을 수 없을 것입니다. 외환 시장에서 변동성 활용 외환 시장에서 변동성을 적절히 활용하면 보다 효과적으로 거래할 수 있으며, 기대치를 현실에 맞춰 조정하는 데 도움이 됩니다.  높은 변동성 추세 기반 시스템은 변동성이 높은 시장에서 큰 스윙과 더 긴 포지션 보유 기간 덕분에 매우 잘 작동합니다. 고변동성 구간에서 발생하는 돌파는 더 많은 핍스를 획득할 수 있는 기회를 제공합니다. 낮은 변동성 평균 회귀 시스템은 시장이 평균값으로 되돌아가려는 성질이 있기 때문에 낮은 변동성 환경에서 특히 효과적입니다
KT COG Robot
KEENBASE SOFTWARE SOLUTIONS
KT COG Robot is a fully automated Expert Advisor based on the KT COG Indicator . The COG indicator was originally presented by John F. Ehlers in the May 2002 edition of Technical Analysis of Stocks & Commodities magazine. The EA fires a long trade when COG line cross above the signal line and a short trade is fired when the COG line cross below the signal line.  Adaptive Filtration Our adaptive filtration algorithm combines the original COG formula with the major trend direction and market acce
ACB Breakout Arrows EA
KEENBASE SOFTWARE SOLUTIONS
이 EA는 저희의 커스텀 인디케이터인 "ACB Breakout Arrows" 를 기반으로 한 100% 자동화된 전문가용 어드바이저입니다. 양방향으로 자주 발생하는 돌파 패턴을 이용하며, 외부 입력 값인 "Signal Sensitivity"를 통해 진입 신호의 강도를 조절할 수 있습니다. 거래 확인 ACB Breakout Arrows EA는 또 다른 커스텀 인디케이터인 ACB Trade Filter 를 사용하여 거래 진입 조건을 필터링할 수 있는 기능을 제공합니다. 강력한 매수: 위쪽 화살표 + 초록색 히스토그램 + 상승 추세 강력한 매도: 아래쪽 화살표 + 빨간색 히스토그램 + 하락 추세 히스토그램이 회색이고 추세가 횡보일 경우, EA는 거래를 피합니다. EA는 모든 인디케이터와 의존 파일을 백그라운드에서 로드하며, 차트에는 표시되지 않습니다. 주요 기능 오랜 기대 끝에 이제 ACB Breakout Arrows 인디케이터 로 완전 자동 매매가 가능합니다. ACB Trade F
KT London Breakout
KEENBASE SOFTWARE SOLUTIONS
First thirty minutes are essential for a trading session. The early reaction of traders and market players sets a path for the rest of the day. KT London Breakout EA takes advantage of this phenomenon, and after analyzing the first thirty minutes of London session, it places two bidirectional pending orders. One of pending order is eventually canceled after realizing the market direction with certainty. It has been strictly tested and developed for EUR/JPY using 30-Min Time Frame. You can expe
KT Support and Resistance Levels
KEENBASE SOFTWARE SOLUTIONS
Use of support and resistance in systematic trading is very subjective. Every trader has their own idea and way to plotting the support and resistance levels on the chart. KT Support and Resistance indicator take out this ambiguity out of the situation and automatically draws support and resistance levels following an algorithmic approach using a unique multi-timeframe analysis. When launched on the chart, It immediately scan the most significant extreme points across all the available timefra
외환 거래를 한다면, 통화 강도와 통화쌍 상관관계에 대한 상세한 정보를 아는 것은 거래 실력을 한 단계 끌어올리는 데 큰 도움이 됩니다. 상관관계를 분석하면 리스크를 절반으로 줄일 수 있고, 강도 분석을 통해 수익을 극대화할 수 있습니다. 이 지표는 통화 강도 분석과 통화쌍 상관관계를 결합하여 가장 적합한 통화쌍을 선택할 수 있도록 도와주는 하이브리드 접근 방식을 제공합니다. 통화 강도 분석 활용 방법 예를 들어, 당신의 거래 전략이 AUD/JPY 매수 기회를 제공한다고 가정해 봅시다. 하지만 KT 통화 강도 분석을 통해 JPY가 AUD보다 강해지고 있다는 것을 발견했다면, 이 거래는 손실로 끝날 가능성이 높습니다. 이 지표를 사용하면 이러한 손실을 쉽게 피할 수 있습니다. 통화쌍 상관관계 활용 방법 또 다른 예로, 거래 전략이 NZD/USD와 GBP/JPY 두 통화쌍 모두에 대해 매도 기회를 제공한다고 가정해 봅시다. KT 통화쌍 상관관계 분석을 사용하면 이 두 통화쌍 간 상관
MACD Divergence Seeker
KEENBASE SOFTWARE SOLUTIONS
KT MACD Divergence Seeker trades the regular and hidden divergence signals generated by our free indicator named KT MACD Divergence indicator. Trading the standalone divergences can be a risky affair that's why the KT MACD Divergence Seeker combines the standard divergence signals with an advanced analysis module to exploit the price inefficiencies on some FX pairs. What is the Divergence exactly? As a general conception if the price is making higher highs, then macd should also be making hig
KT Asian Breakout Indicator
KEENBASE SOFTWARE SOLUTIONS
KT Asian Breakout 지표는 아시아 세션의 중요한 부분을 분석하여 가격 돌파 방향에 따라 매수 및 매도 신호를 생성합니다. 가격이 세션 최고점을 돌파하면 매수 신호가 발생하며, 가격이 세션 최저점을 돌파하면 매도 신호가 발생합니다. 유의 사항 세션 박스의 높이가 너무 넓다면, 대부분의 가격 움직임이 이미 세션 내에서 발생했기 때문에 새로운 거래를 피하는 것이 좋습니다. 돌파 캔들이 너무 크면, 가격이 신호 방향으로 계속 진행하기 전에 일시적인 되돌림이 발생할 가능성이 높습니다. 기능 매수/매도 신호에 스톱로스 및 목표 이익 수준이 포함됩니다. KT Asian Breakout 지표는 첫 번째, 두 번째 또는 세 번째 목표 이익을 기준으로 성과를 지속적으로 확인합니다. 승/패 신호 수, 성공률, 신호당 평균 핍스와 같은 세 가지 주요 성과 지표를 표시합니다. 돌파 캔들이 너무 크면 차트에 경고 메시지가 표시됩니다. 추천 설정 시간 프레임: 15분. 통화쌍: 모든 JPY
MACD Divergence MT4
KEENBASE SOFTWARE SOLUTIONS
KT MACD 다이버전스는 가격과 오실레이터 사이에 형성되는 일반 다이버전스와 숨겨진 다이버전스를 보여줍니다. 만약 당신의 거래 전략이 추세 반전을 예측한다면, MACD의 일반 다이버전스를 활용하여 잠재적인 전환 지점을 예측할 수 있습니다. 추세 지속을 기반으로 하는 전략이라면 MACD의 숨겨진 다이버전스가 적합합니다. KT MACD 다이버전스의 한계 MACD 다이버전스를 단독 진입 신호로 사용하는 것은 위험할 수 있습니다. 모든 다이버전스가 반전 신호로 해석될 수는 없습니다. 더 나은 결과를 얻으려면 가격 행동 및 기타 분석 기법과 함께 사용하는 것이 좋습니다. 기능 소개 가격과 오실레이터 간의 일반 및 숨겨진 다이버전스를 표시합니다. 비대칭 다이버전스는 정확도를 높이고 혼란을 줄이기 위해 제거됩니다. 추세 반전 및 추세 지속 전략 모두에 사용할 수 있습니다. EA(Expert Advisor)에 완벽하게 통합 가능합니다. 진입뿐만 아니라 청산 시점에도 활용할 수 있습니다. 모든
KT Bollinger Bands Trader MT4
KEENBASE SOFTWARE SOLUTIONS
KT Bollinger Bands Trader는 100% 자동화된 전문가용 어드바이저(EA)로, 낮은 변동성 구간에서 볼린저 밴드를 활용한 평균 회귀 전략을 기반으로 작동합니다. 가격은 종종 볼린저 밴드의 상단 또는 하단 라인에서 반응하지만, 항상 반전이 일어나는 것은 아닙니다. 하지만 낮은 변동성일수록 반전 가능성은 더 높아집니다. 진입 조건 가격이 볼린저 밴드의 하단선 아래에 정확히 위치할 경우 매수 포지션이 실행됩니다. 가격이 볼린저 밴드의 상단선 위에 정확히 위치할 경우 매도 포지션이 실행됩니다. 청산 조건 낮은 변동성 구간이 종료되면 기존 포지션이 자동으로 종료됩니다. 또는 지정된 손절선(Stop Loss)이나 이익 실현선(Take Profit)에 도달하면 종료됩니다. 이 EA는 널리 알려진 볼린저 밴드 전략에 기반하면서도, 트렌드 필터, 변동성 필터, Vortex, MMI, 요일 필터 등 다양한 고급 필터 기능을 내장하여 전략을 세밀하게 조정할 수 있는 유연함을 제공합니
KT CCI Divergence MT4
KEENBASE SOFTWARE SOLUTIONS
KT CCI Divergence shows the regular and hidden divergence created between the price and CCI oscillator. Divergence is one of the vital signals that depicts the upcoming price reversal in the market. Manually spotting the divergence between price and CCI can be a hectic and ambiguous task. Limitations of KT CCI Divergence   Using the CCI divergence as a standalone entry signal can be risky. Every divergence can't be interpreted as a strong reversal signal. For better results, try to combine it w
필터:
리뷰 없음
리뷰 답변