Market Steps MT5
- 지표
-
Mahdi Ebrahimzadeh
 I'm a full-time coder at mql5.com
So interested in New Ideas, and Love to solve Problems with high difficulties through non predictable and totally creative ways.
Services:
- Developing and optimizing Expert Advisor, Indicators, Utilities, etc. in mql4 and mql5. - 버전: 5.50
- 업데이트됨: 19 6월 2024
- 활성화: 5
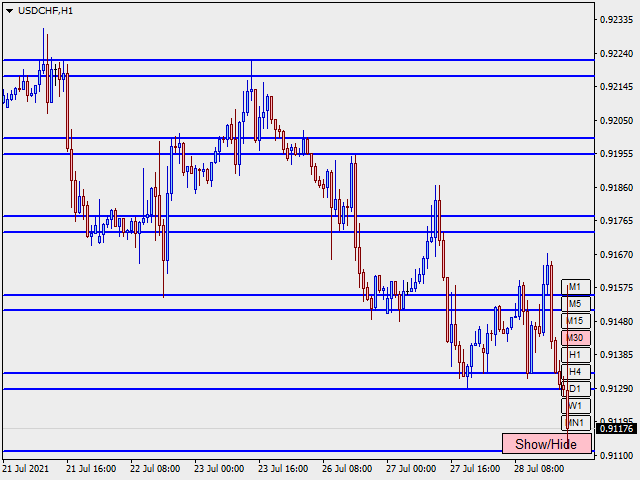
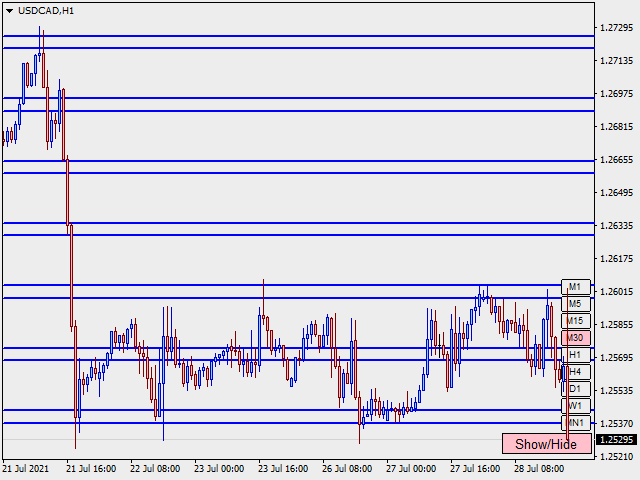
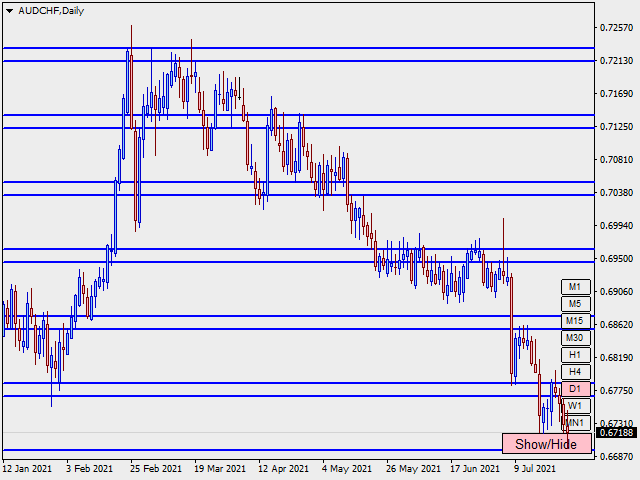
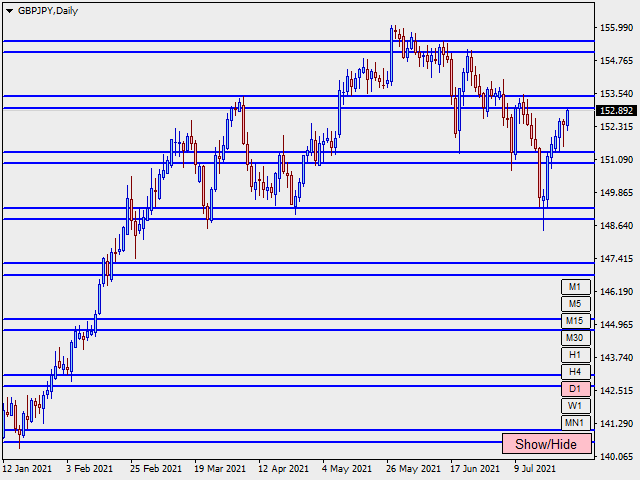
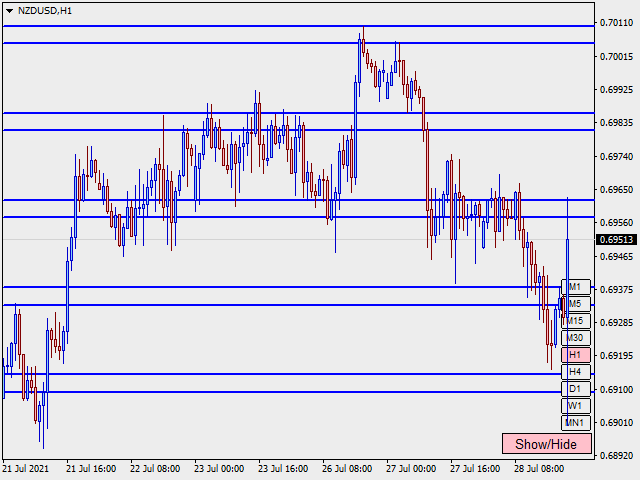
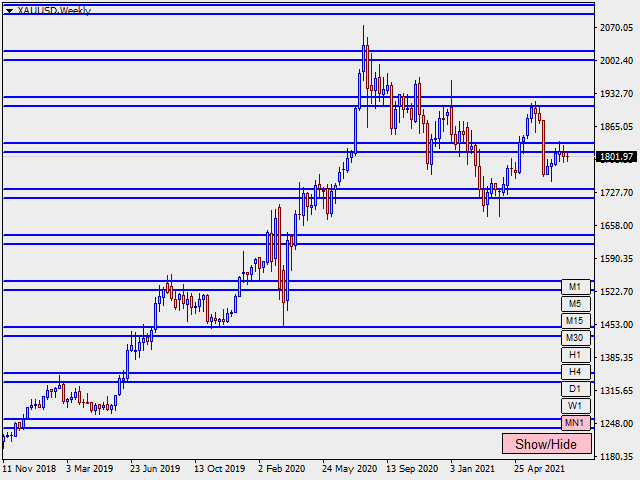
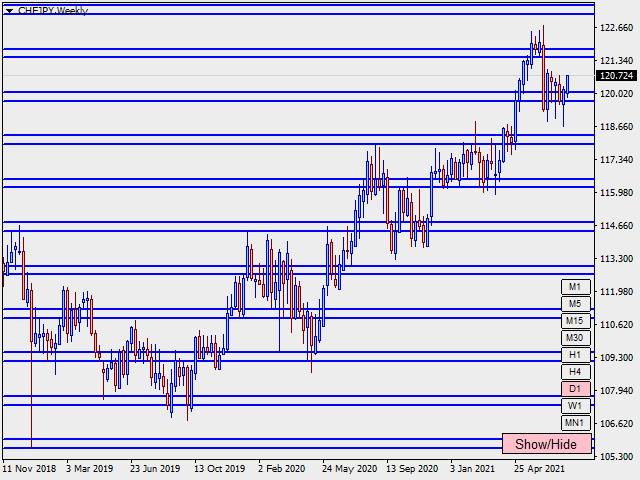
시장 단계 표시기는 Gann 시간/가격 상관 관계를 기반으로 설계 및 구축되었으며 Forex 시장에 대한 가격 조치 특정 규칙에 따라 최적화됩니다. 시장 주문 흐름 개념을 사용하여 대량 주문에 대한 잠재적 가격 영역을 예측합니다.
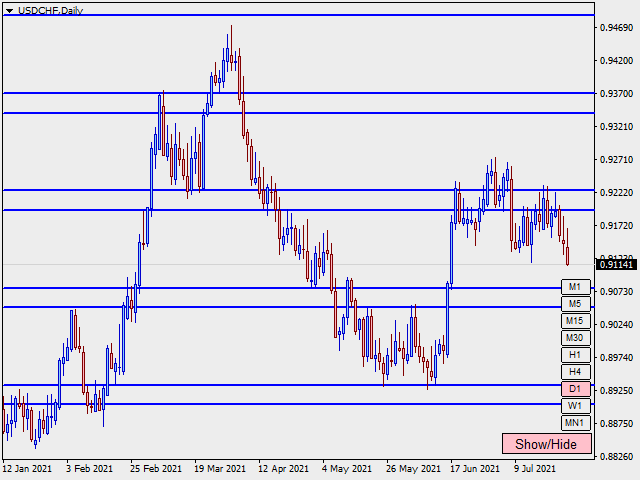
지표 수준은 거래 자체에 사용하거나 다른 전략/지표의 잘못된 신호를 필터링하기 위한 조합으로 사용할 수 있습니다. 모든 거래자는 차트에 다중 시간 프레임(TF) 영역과 가격 변동 가능성을 함께 표시할 수 있는 강력한 도구가 필요합니다. 테스터 모드에서 파워를 테스트하여 레벨이 차트보다 어떻게 가격을 책정하는지 확인할 수 있습니다.
표시기 장점:
두 개의 서로 다른 영역이 있는 마킹 차트는 서로 다른 TF에 대한 추세 및 범위 시장을 지정합니다.
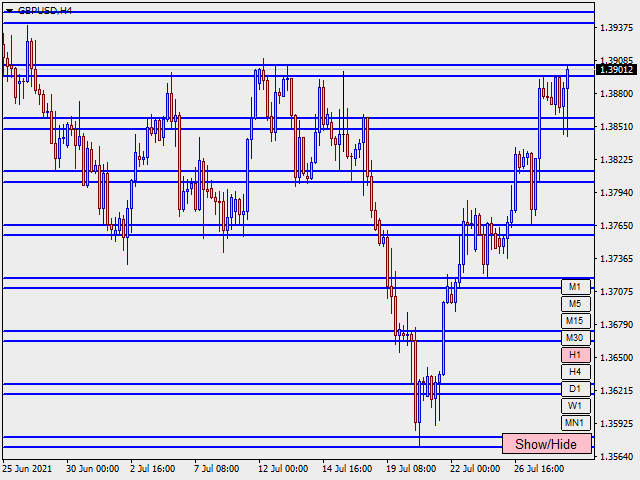
Price Action 거래자는 이를 사용하여 다른 TF/가격 구역의 주문 흐름을 식별하거나 FTR(Fail To Return)/FTC(Fail To Continue)를 확인할 수 있습니다.
시장의 휘발성 및 유동적 영역은 향후 가격 움직임에 대한 차트에 표시됩니다.
SL/TP, Trailing, Breakeven 및 Profit save는 이 표시기로 쉽게 결정할 수 있습니다.
가격 반전 또는 계속을 쉽게 확인할 수 있습니다.
지표의 수준은 더 높은 확률로 마틴게일 또는 그리드 수준으로 사용할 수 있습니다.