KT Bullish Bearish MT5
- 지표
-
KEENBASE SOFTWARE SOLUTIONS
 Keenbase Trading은 트레이더가 더욱 정확하고 신뢰할 수 있는 거래 결정을 내릴 수 있도록 MetaTrader 4 및 MetaTrader 5용 전문 지표와 Expert Advisor(EA)를 개발합니다.
당사의 제품은 실전에서 활용할 수 있는 거래 로직과 직관적인 사용자 경험을 결합하여 안정성, 사용 편의성, 그리고 체계적인 리스크 관리에 중점을 두고 설계되었습니다. 모든 도구는 철저한 테스트를 거쳐 실제 시장 환경에서도 일관되고 안정적인 성능을 제공할 수 있도록 개발됩니다. - 버전: 1.0
- 활성화: 10
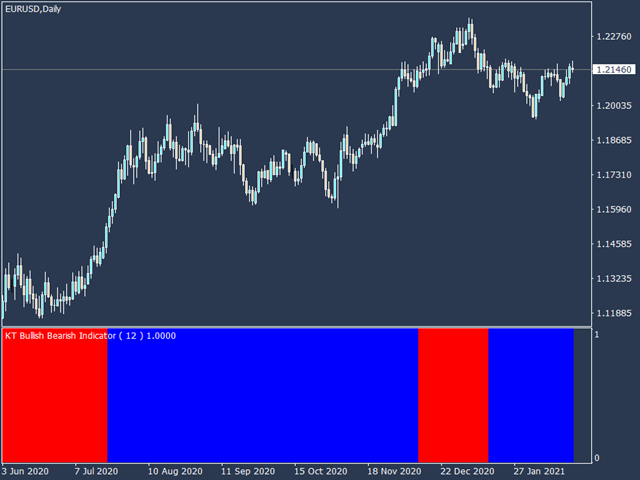
KT Bullish Bearish shows the bullish/bearish regime of the market in the form of a colored histogram representing both of the market states alternately.
Bull Market (Blue Histogram): A bull market indicates an uptrend when an instrument price rises over a continued period like days, months, or years.
Bear Market (Red Histogram): A bear market indicates a downtrend when an instrument price rises over a continued period like days, months, or years.
Applications
- It prevents trading against the big players in the market.
- Only long trades are preferred during the bullish histogram.
- Only short trades are preferred during the bearish histogram.
- It helps to improve the success percentage of trend following strategies.
- Prevents over-trading.
Building a Trading System
You can combine this indicator with various entry indicators to design a complete trading system. For example, you may use a breakout or divergence indicator to find the trading opportunities and filter them using the KT Bullish Bearish to improve its success rate.