Market Intelligence Multi Market Trend Level
- 지표
- 버전: 1.0
- 활성화: 5

Multi-Market Trend & Level Analysis
See the Bigger Picture. Understand the Market Context.
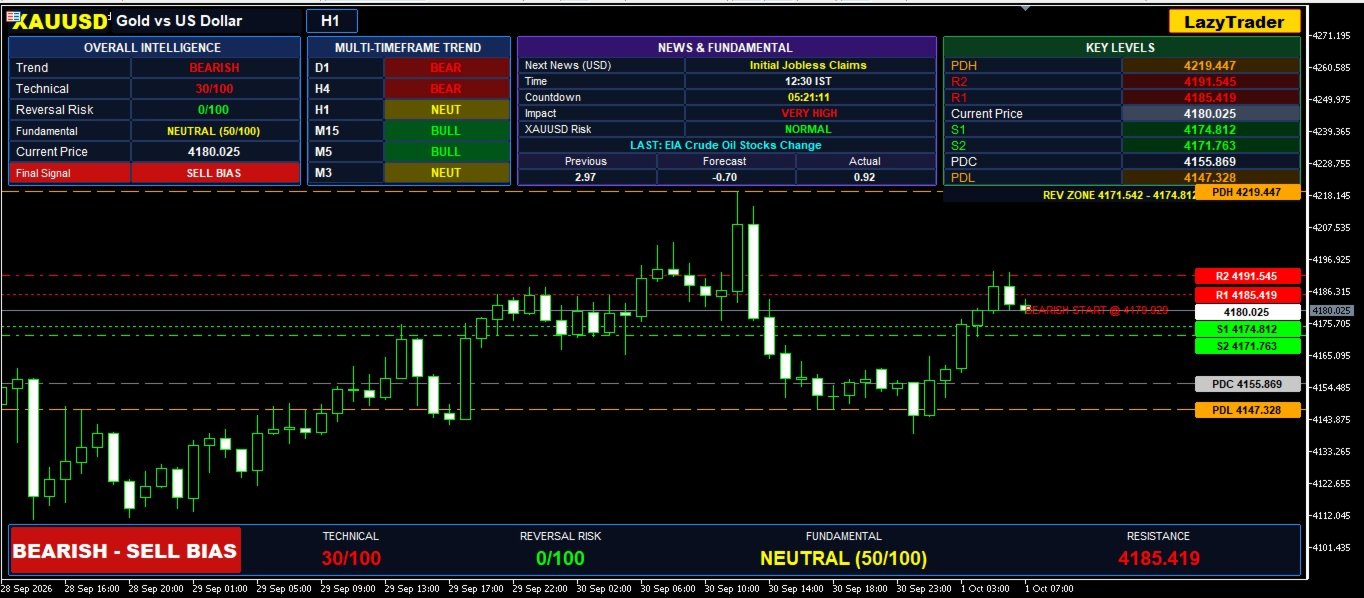
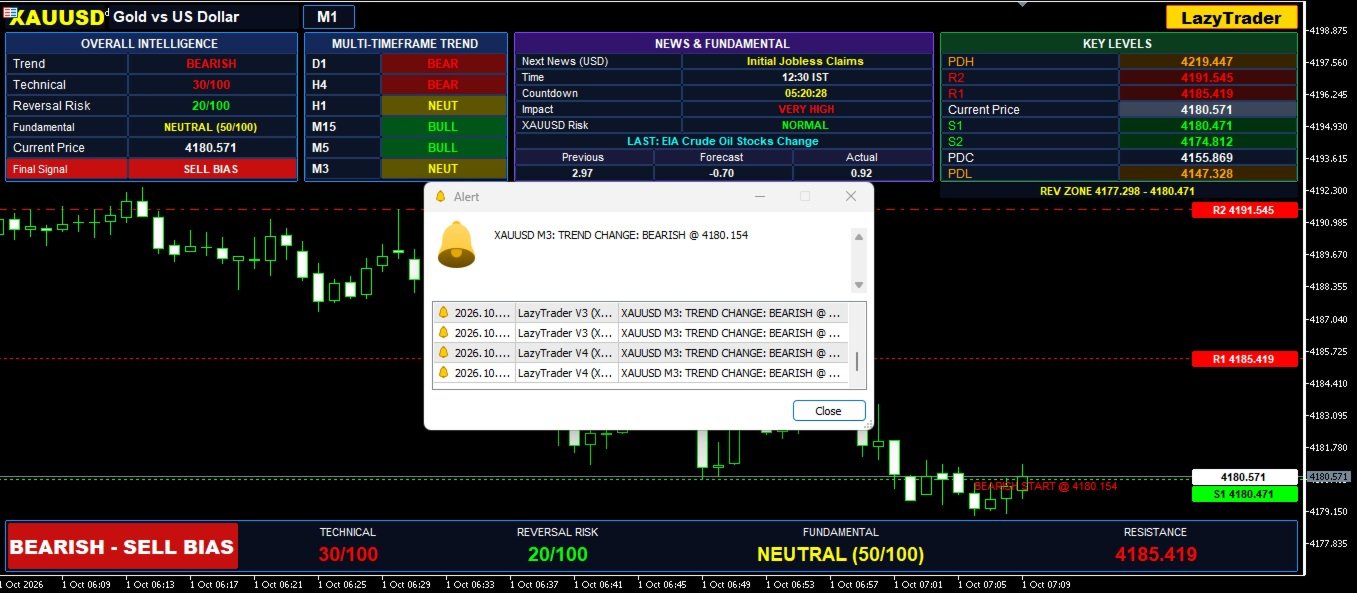
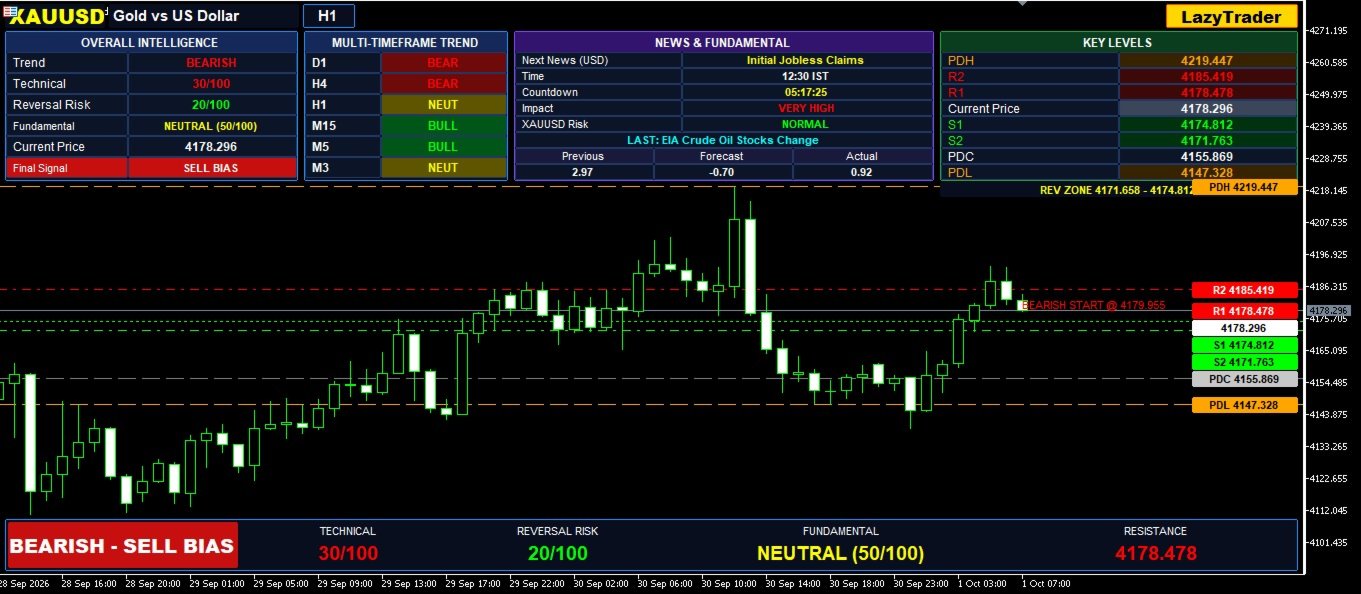
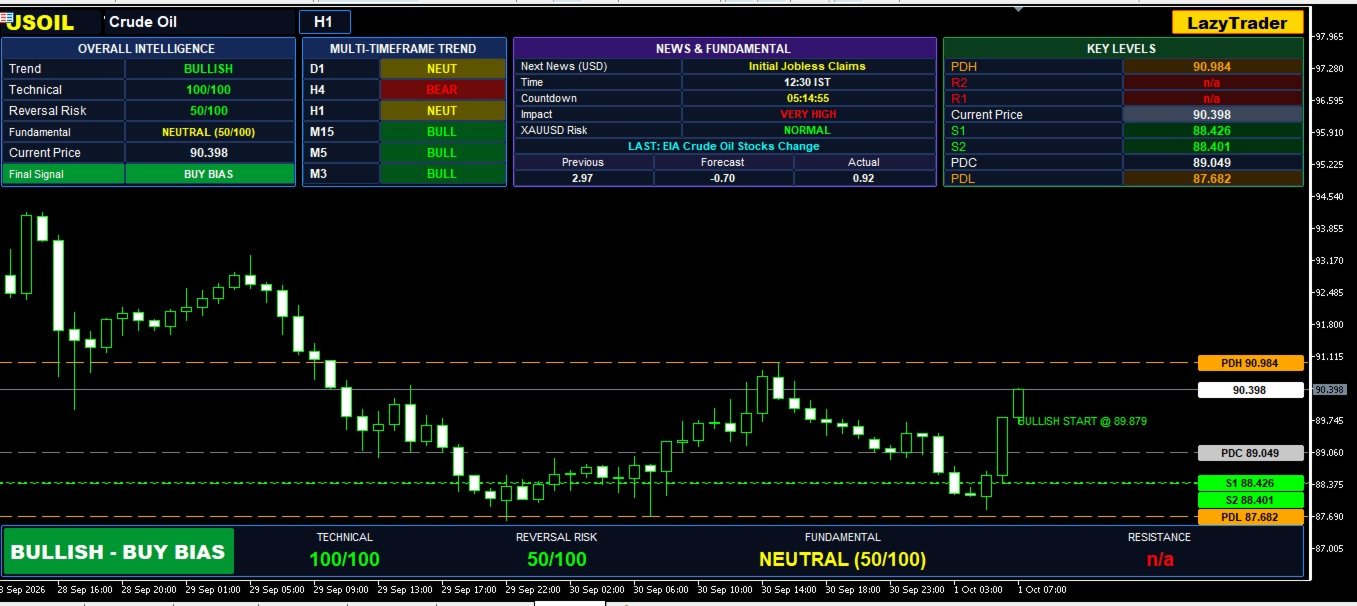
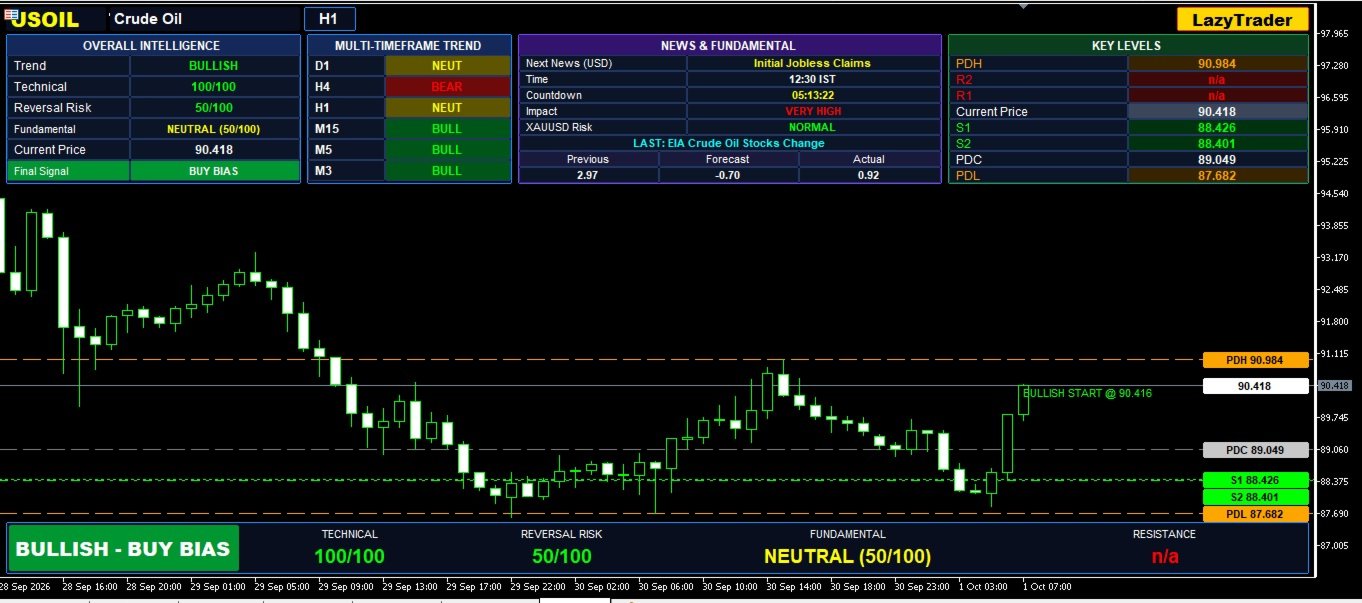
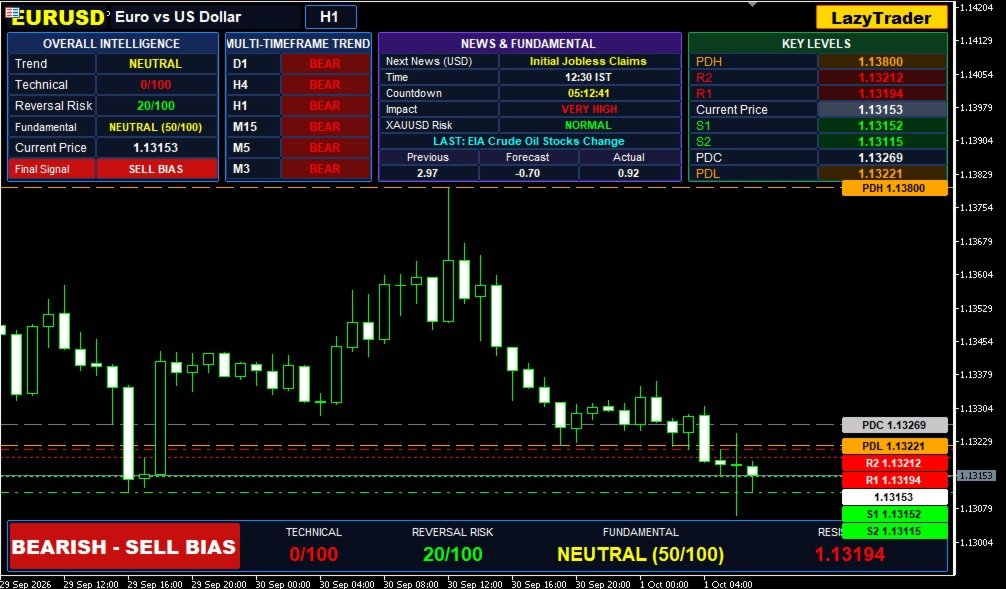
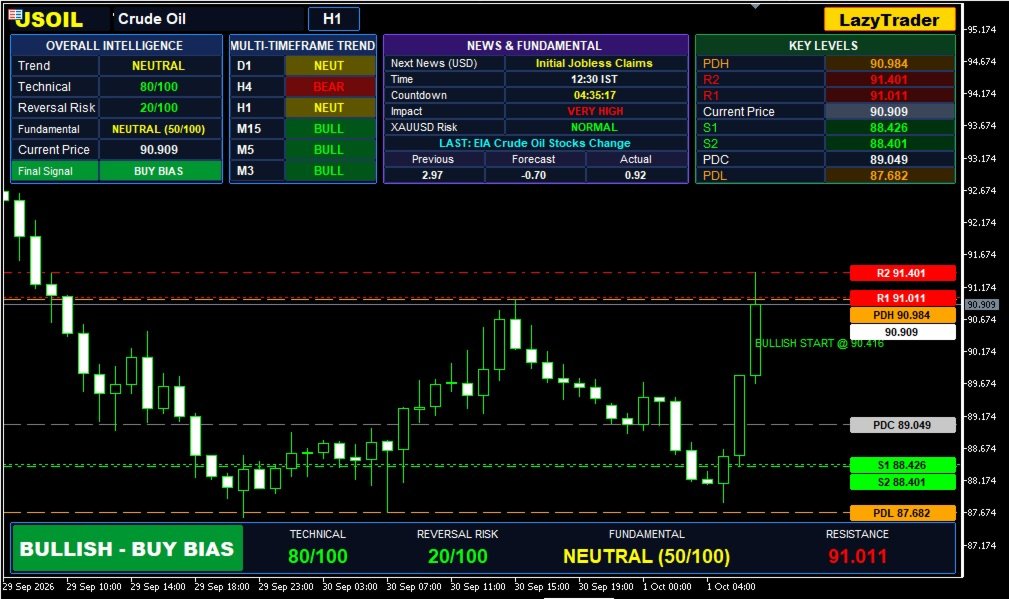
Discover a more structured approach to chart analysis with LazyTrader Market Intelligence — a visual trading indicator designed to bring trend direction, technical conditions, key price levels, market structure and economic-calendar information together in one organized dashboard.
Built for traders who want a broader view of market conditions, LazyTrader Market Intelligence helps you review multiple layers of information without constantly switching between separate analytical tools.
KEY FEATURES
1. Multi-Timeframe Trend Intelligence
Gain a broader perspective on market direction with a dashboard displaying trend conditions across six timeframes:
-
D1 — Daily Trend
-
H4 — 4-Hour Trend
-
H1 — 1-Hour Trend
-
M15 — 15-Minute Trend
-
M5 — 5-Minute Trend
-
M3 — 3-Minute Trend
Compare higher-timeframe direction with shorter-term conditions and observe bullish, bearish and neutral market environments.
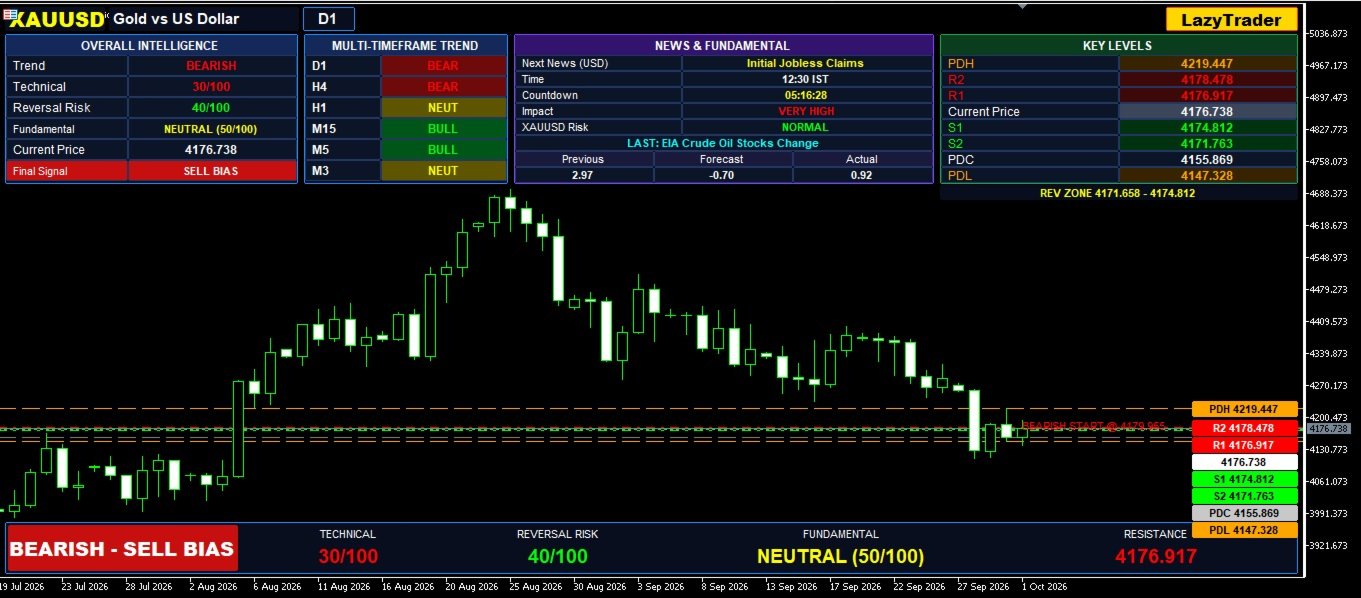
2. Complete Timeframe Flexibility: M1 to MN1
Use the indicator on your preferred supported MetaTrader 5 chart timeframe, ranging from 1 minute to 1 month.
Minute Timeframes
-
M1 — 1 Minute
-
M2 — 2 Minutes
-
M3 — 3 Minutes
-
M4 — 4 Minutes
-
M5 — 5 Minutes
-
M6 — 6 Minutes
-
M10 — 10 Minutes
-
M12 — 12 Minutes
-
M15 — 15 Minutes
-
M20 — 20 Minutes
-
M30 — 30 Minutes
Hourly Timeframes
-
H1 — 1 Hour
-
H2 — 2 Hours
-
H3 — 3 Hours
-
H4 — 4 Hours
-
H6 — 6 Hours
-
H8 — 8 Hours
-
H12 — 12 Hours
Higher Timeframes
-
D1 — 1 Day
-
W1 — 1 Week
-
MN1 — 1 Month
Choose your preferred chart timeframe according to your trading style, from short-term intraday analysis to broader market observation.
Timeframe availability depends on your MetaTrader 5 platform and broker. The main technical calculations use M3 data, while the multi-timeframe trend dashboard reads D1, H4, H1, M15, M5 and M3. The list above describes chart-timeframe flexibility, not independent full technical analysis on every timeframe.
3. Intelligent Market Dashboard
Keep essential market information organized in one place.
Depending on the enabled settings, the dashboard displays:
-
Overall market trend and directional bias
-
Technical strength score
-
Reversal-risk assessment
-
Fundamental market context
-
Current instrument price
-
Final market assessment
-
Multi-timeframe trend conditions
Color-coded information helps you interpret the displayed market context at a glance.
4. Key Support & Resistance Levels
Understand where the current price stands relative to important chart areas.
Features include:
-
R1 and R2 resistance levels
-
S1 and S2 support levels
-
Previous Day High (PDH)
-
Previous Day Low (PDL)
-
Previous Day Close (PDC)
-
Horizontal price levels directly on the chart
Use these reference levels to study potential price reactions, breakouts, rejections and changes in market behaviour.
5. Market Structure & Trend Changes
Observe confirmed swing points and changes in market structure.
The indicator evaluates recent price structure to help identify bullish, bearish and neutral conditions. Historical trend-change markers allow you to review previous market situations directly on the chart.
These readings provide analytical context rather than guaranteed future predictions.
6. Economic Calendar Intelligence
Combine technical chart analysis with available fundamental-event information.
When MetaTrader 5 economic-calendar data is available, the indicator can display:
-
Upcoming relevant USD economic events
-
Event importance
-
Countdown to the next event
-
Available previous, forecast and actual figures
-
Recent released-event information
-
News-related timing and caution information
Economic releases can increase volatility and produce rapid price movements. Stay aware of scheduled events while evaluating market conditions.
7. Anytime Analysis — No Fixed Session Restriction
Use LazyTrader Market Intelligence throughout the trading day according to your preferred schedule.
The indicator is not restricted to a particular trading session. You can use it during:
-
Asian Session
-
London Session
-
New York Session
-
London–New York Overlap
-
Other trading hours
Monitor changing market conditions whenever the platform has the required price history and data.
Market behaviour can differ across sessions due to liquidity, volatility and economic events. Continuous availability does not imply equal signal quality under every market condition.
8. Multi-Market Compatibility
Designed for chart-based analysis on supported MetaTrader 5 instruments, including:
-
Forex: Major, minor and other available currency pairs
-
Metals: Gold, Silver and other available metals
-
Energy: Oil and other available energy instruments
-
Indices: Supported stock-index instruments
-
Crypto: Cryptocurrency CFDs offered by your broker
Compatibility and data availability depend on the broker, symbol specifications and available market history. Test the indicator on your intended instruments before live use.
9. Customizable Chart Experience
Adapt the visual presentation to your preferences with available options for:
-
Dashboard visibility
-
Support and resistance levels
-
Historical signal markers
-
Bullish, bearish and neutral colours
-
Font size and chart presentation
-
Popup alerts
-
Push notifications
Configure the available display settings to suit your preferred chart-analysis workflow.
WHY LAZYTRADER MARKET INTELLIGENCE?
One Dashboard. Multiple Layers of Market Context.
Instead of relying on a single chart observation, review trend direction, market structure, technical conditions, key price levels and available economic information together.
LazyTrader Market Intelligence is designed for traders who value organized information, multi-timeframe context and a more structured approach to market analysis.
Whether you monitor Forex, Gold, Oil or other supported instruments, the indicator brings its available analytical information directly to your MetaTrader 5 chart.
WHO IS IT FOR?
-
Intraday traders
-
Multi-timeframe technical analysts
-
Forex and metals traders
-
Gold and oil market observers
-
Traders who monitor support and resistance
-
Traders who want technical and economic-calendar context in one dashboard
-
Traders who prefer a visual overview of market conditions
INSTALLATION & USAGE
-
Install the indicator in MetaTrader 5.
-
Open a chart for your preferred supported instrument.
-
Attach LazyTrader Market Intelligence to the chart.
-
Configure the available display, level and alert settings.
-
Review the dashboard and price levels as part of your own analysis.
Ensure the required historical data is available, particularly for the indicator's M3-based calculations.
IMPORTANT RISK DISCLAIMER
LazyTrader Market Intelligence is an analytical and decision-support indicator. It does not automatically execute trades, guarantee signal accuracy or promise profits.
Trend classifications, technical scores and reversal-risk readings are analytical estimates, not certainties. Market conditions can change rapidly, particularly around major economic releases.
Economic-calendar information depends on MetaTrader 5 calendar availability and broker-server data. Verify important event times and figures independently.
The indicator's primary technical calculations use M3 data, and its trend dashboard evaluates D1, H4, H1, M15, M5 and M3. Performance and data availability may vary across instruments, brokers and market conditions.
Always test the indicator in a demo environment before live use. Apply appropriate risk management and make independent trading decisions.
LAZYTRADER
LazyTrader Market Intelligence — Trend. Levels. Market Context.
Bring a more organized view of the market to your MetaTrader 5 charts.