DTFX Algo Zones for MT5
- 지표
-
Minh Truong Pham
 Hello, my name is Pham and I am a programmer and trader! At here, I create amazing forex indicators and expert advisors for Metatrader.
I will try:
+ Provide best tools base on my 5 years experience as a trader and 10 years as a programmer. - 버전: 1.5
- 업데이트됨: 12 9월 2024
- 활성화: 5
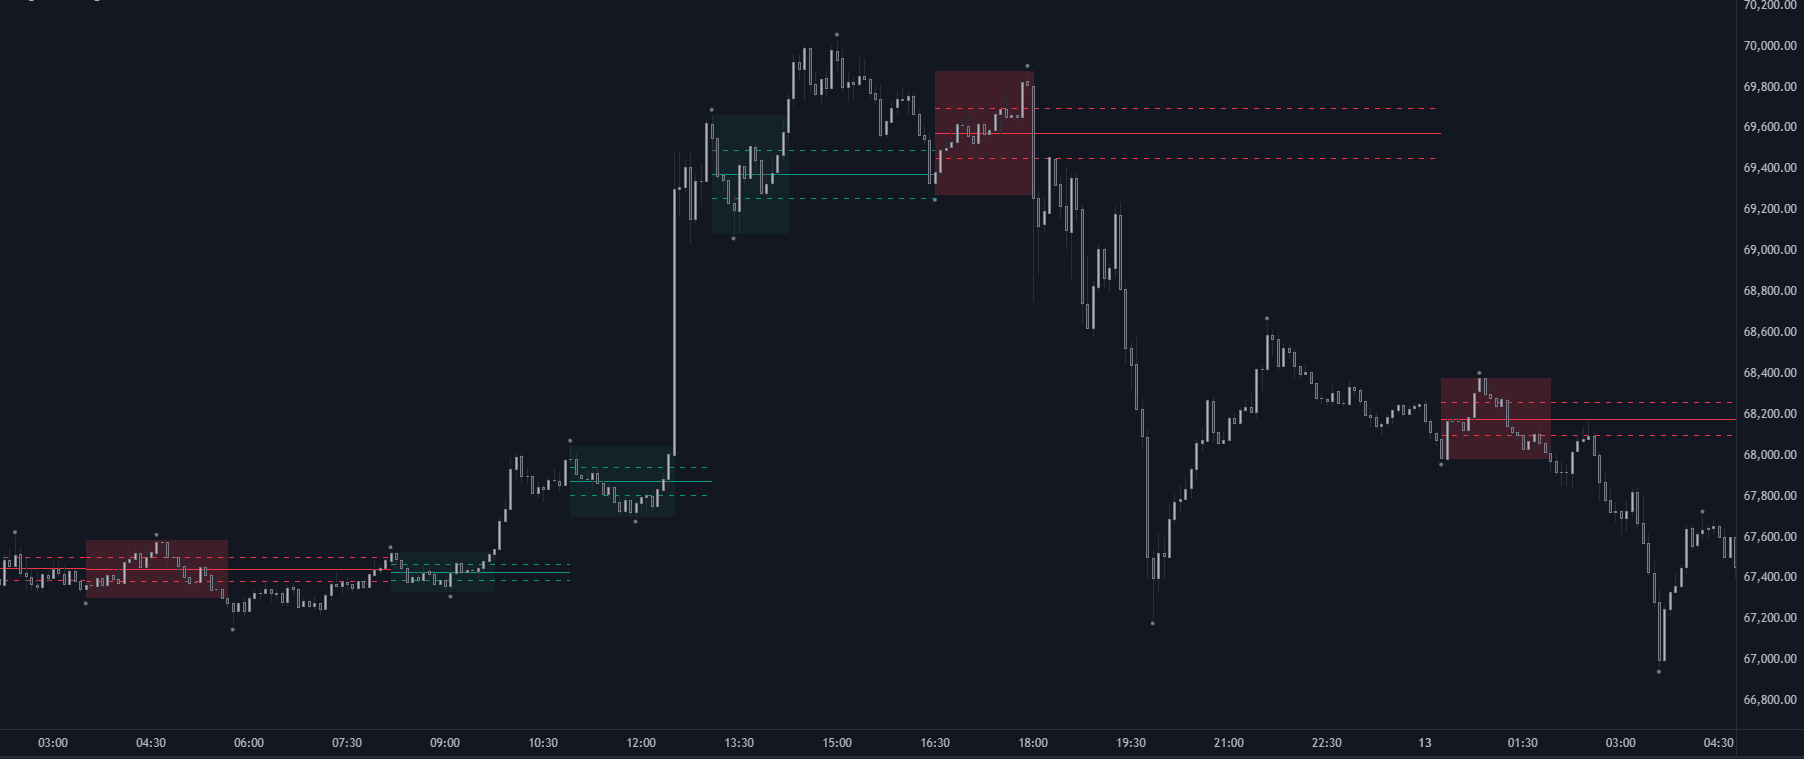
DTFX Algo Zones are auto-generated Fibonacci Retracements based on market structure shifts.
These retracement levels are intended to be used as support and resistance levels to look for price to bounce off of to confirm direction.
🔶 USAGE
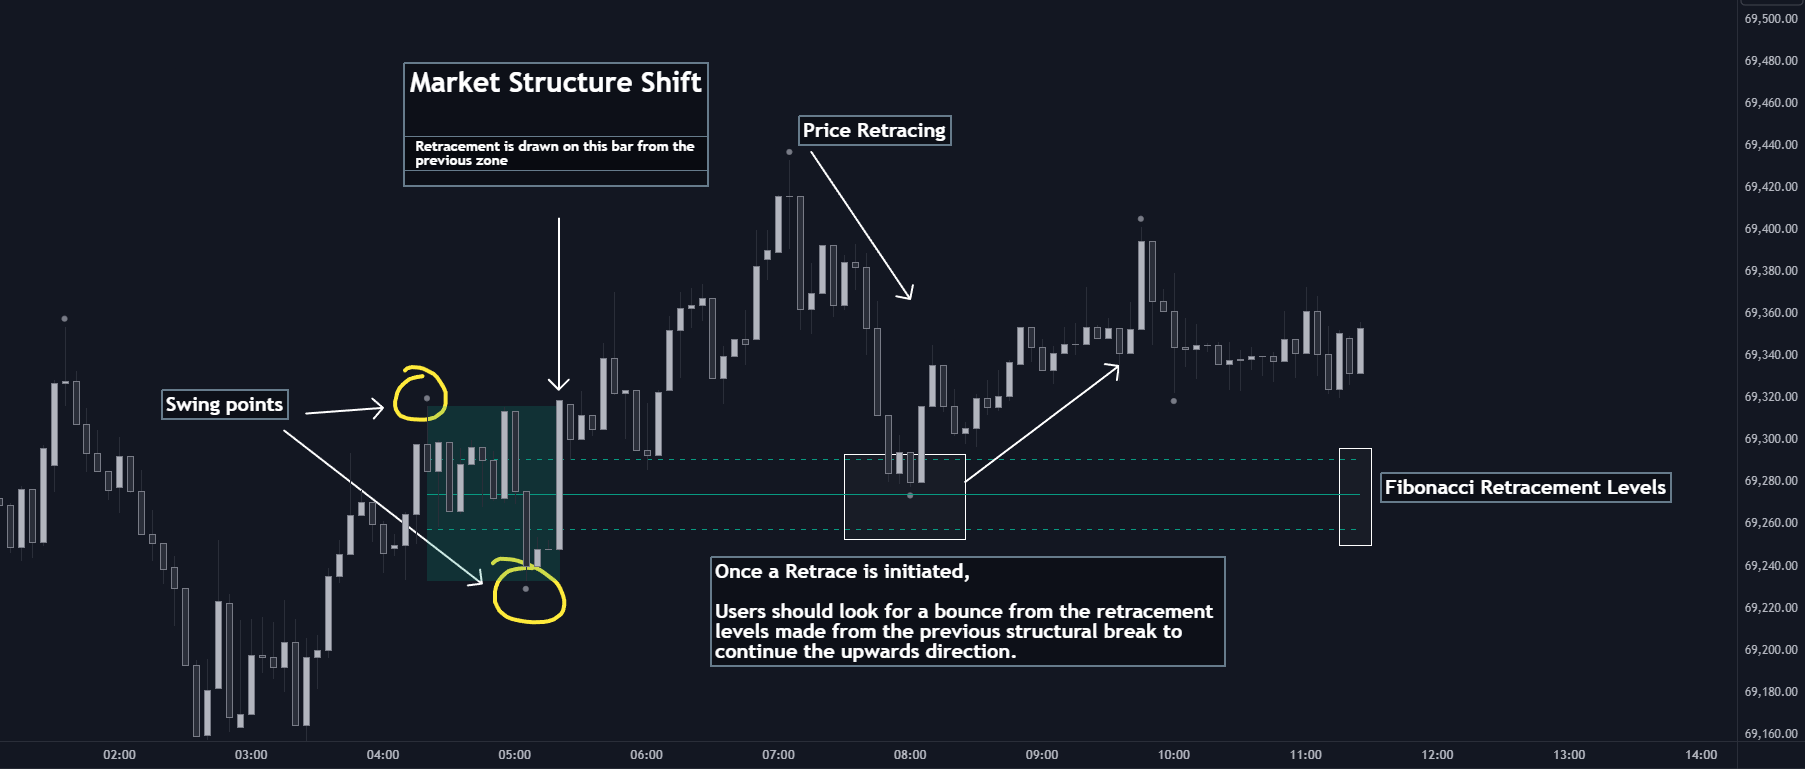
Figure 1
Due to the retracement levels only being generated from identified market structure shifts, the retracements are confined to only draw from areas considered more important due to the technical Break of Structure (BOS) or Change of Character (CHoCH).
The simple action that causes a market structure shift occurs is price breaking above or below a specific swing point. When a market structure shift happens, a retracement is drawn from the point of break to the highest or lowest point since that point. Due to the price action necessary for a market structure shift, these retracements will not always be immediately actionable.
These retracement levels are intended to be used as points to watch for price to retrace to and bounce from, confirming the current direction of price.
In the example below, after the retracement is initiated, by bouncing off of the retracement levels formed from the previous market structure shift it would further confirm the bias of the market structure shift. A break going through these levels would display a weakness from the current market structure shift, implying that it could simply be noise.
Figure 2
🔶 DETAILS
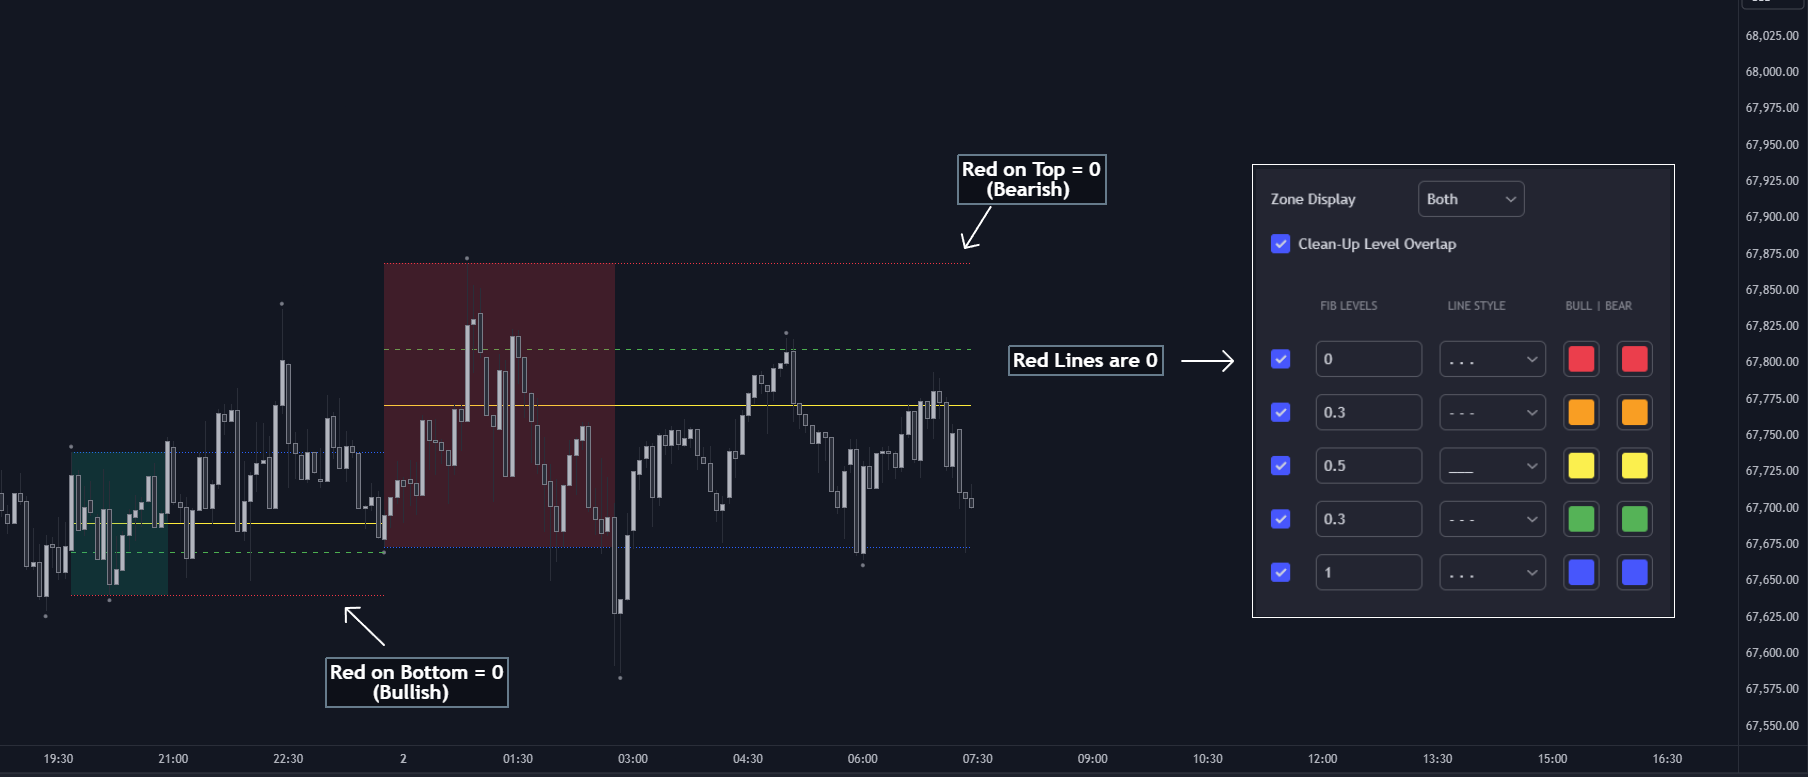
The script uses standard SMC Market structure identification to determine Break of Structures (BOS) and Change of Characters (CHoCH). The specific swing points can be identified by the shapes placed above or below the specific swing high/low candle.
By unchecking the "Display All Zones" setting, users are able to specify the exact number of retracement zones to display using the "Show Last" parameter. This is handy for cleaning up the chart to stay focused on the most recent retracements.
Additionally, when displaying multiple zones, the "Clean-Up Level Overlap" setting may be helpful for decluttering as well. This option optimizes the display of retracement levels to minimize their overlap on other adjacent zones.
The script allows for up to 5 Fib levels to be displayed from each zone, with options for display, value, line style, and color for each of the 5.
The calculation for Fib Levels changes depending on the direction of market structure shifts. When an upwards (Bullish) zone is generated, the retracement is drawn with the bottom of the zone being 0 and the top of the zone being 1. This is reversed for downwards (Bearish) zones.
Figure 3
🔶 SETTINGS- Structure Length: Sets the SMC structure length to use for finding MMS.
- Show Last: Displays this number of retracement zones. (Display All Zones Must be Unchecked)
- Display All Zones: Ignores "Show Last" number and displays all historical MMS Retracement Zones.
- Zone Display: Choose which zones to display, only bearish, only bullish, or both.
- Clean-Up Level Overlap: Minimizes overlap between adjacent zones and levels.
- Fib Levels: Settings to display and customize up to 5 Fib levels for each zone.
- Notification settings
🔶 UPGRADED
v 1.2: Add HTF mode (input setting) with default is current timeframe. Use can choose higher detect model at timeframe. Indicator will auto switch to current timeframe if user choose lower timeframe (and show comment at top left of screen to notice)