Qv2 Trend MT5
- 지표
- 버전: 1.30
- 업데이트됨: 26 1월 2022
- 활성화: 5

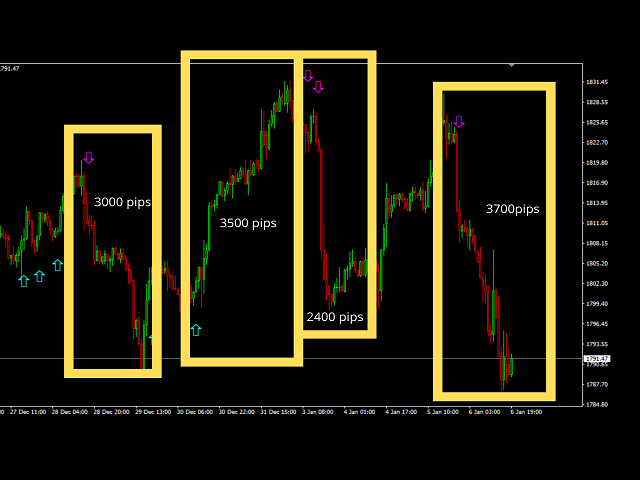
The Qv² Trend is an indicator that aims to identify trends.
Buying trend signals are indicated by arrows pointing up.
Selling trend signals are indicated by arrows pointing down.
It can be used in all deadlines.
It can be used in all pairs.
I use it on the H1 with a period of 24.
Important Recommendation: Make sure you trade in trend market.
Good Trades, in trend market