Candle Diamond Pattern Testing
- 지표
-
Danny Giovanni Romero Lozano
 I am a quantitative trader and algorithmic developer specialized in building advanced trading systems for synthetic indices and high-volatility instruments. My expertise combines statistical modeling, market structure analysis, and systematic execution through custom-built indicators and Expert
 - 버전: 1.30
Live Version Here : https://www.mql5.com/en/market/product/160868
Complete Guide to the Candle Diamond Pattern for MT5
Introduction to the Candle Diamond Pattern Indicator
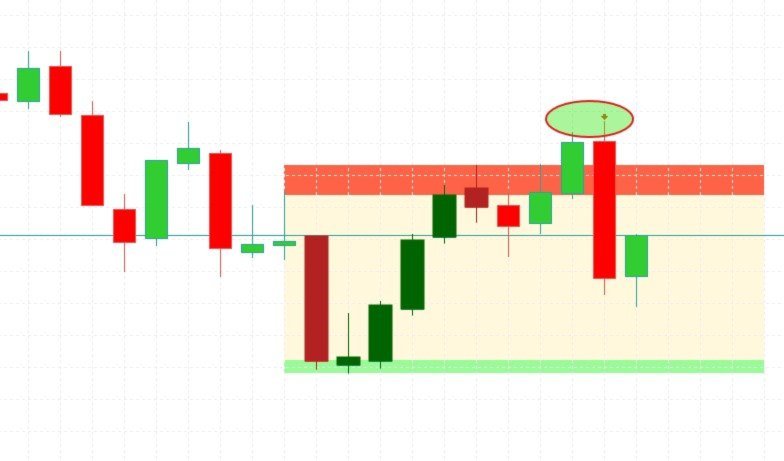
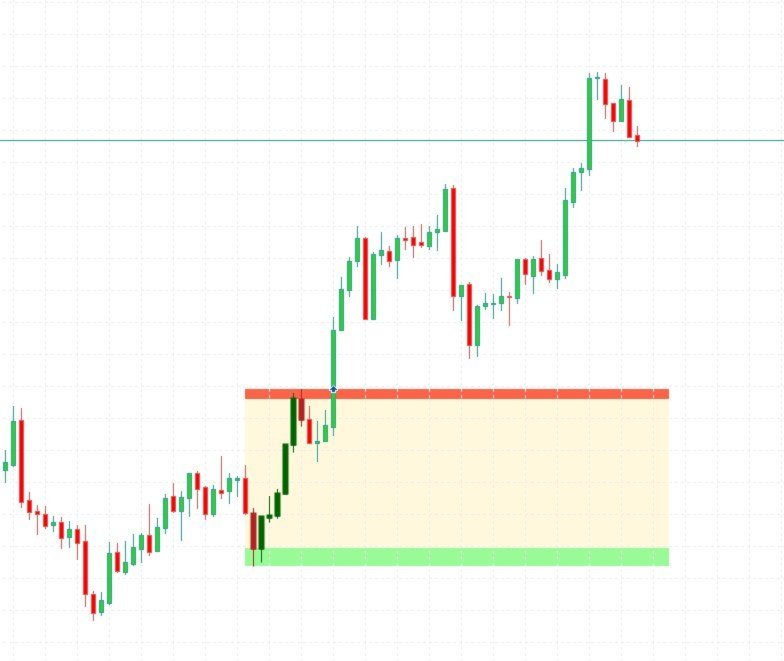
The Diamond Candlestick Pattern indicator for MetaTrader 5 is an advanced technical analysis tool designed to identify diamond-shaped consolidation formations, followed by potential directional breakouts. This technical formation represents a period of market indecision that generally precedes significant price movements.
Key Features of the Indicator
1. Automatic Range Detection
The indicator automatically analyzes the price structure to identify:
Dynamic Support Levels: Support lines that adapt to real-time price action
Dynamic Resistance Levels: Resistance lines that reflect current selling pressure
Diamond Pattern Formation: Automatic detection of the characteristic consolidation structure
2. Multifaceted Trading System
Range Trading Strategy
Bounce Trades: Entry into long positions near identified dynamic support
Rejection Trades: Entry into short positions near dynamic resistance
Intra-range Risk Management: Stop Loss and Take Profit optimized for sideways conditions
Double Top/Bottom Strategy
Reversal Pattern Detection: Automatic identification of double top and double bottom formations
Breakout Confirmation: Confirmation signals for trend-following trades
Target Projection: Automatic calculation of targets Price based on pattern height
Configurable parameters