Custom Bollinger Bands

  • 지표
  • Yu Zhang
  • 버전: 1.3
  • 업데이트됨: 27 10월 2021
  • 활성화: 20

1. What is it

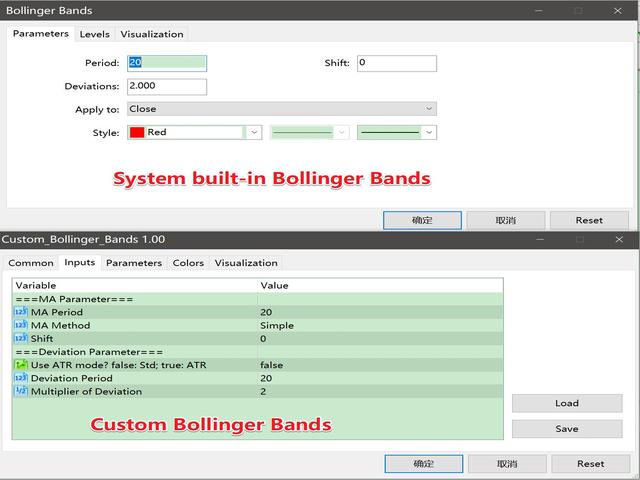
The classic Bollinger Bands and the Bollinger Bands indicator built into the system,  they have the same mean period and deviation period.  And the method of average is just the simple moving average method.  The deviation method used is just the standard deviation method.  All this limits our research because:
  • Sometimes we would like to have longer period averages + shorter period deviations.
  • Sometimes we want moving averages that are not limited to simple moving averages but also include other moving average patterns.
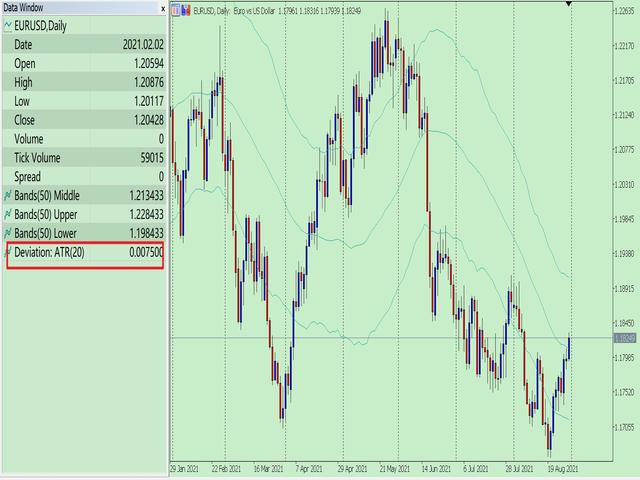
  • The standard deviation is used to portray price fluctuations influenced by price position, while the ATR is used to portray price fluctuations that reflect a different market situation.

Therefore, we developed the Bollinger Bands indicator which has more functions.

2. Calculation method

  • Mean (mean value under a method)  +/-  Multiplier * Deviation (Standard Deviation or ATR)
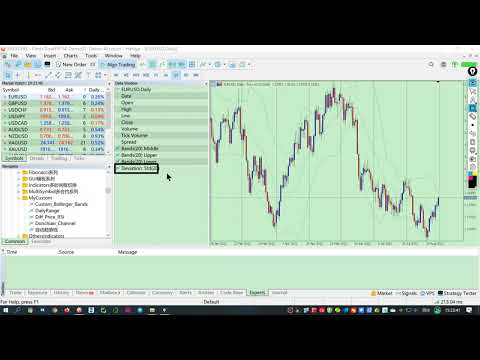
3. How to use

The following is an introduction to the indicator parameters, which are simple and easy to understand.
===MA Parameter===
  • InpMAPeriod = 20;                         // MA Period
  • InpMAShift = 0;                             // MA Shift, Only MA Value Shift.
  • InpMAMethod = MODE_SMA;           // MA Method:  MODE_SMA,  MODE_EMA,  MODE_SMMA,  MODE_LWMA
  • InpApplied_Price = PRICE_CLOSE;  // MA applied_price
  • InpAllShift= 0;                              // All Shift(Plot Shfit)
===Deviation Parameter===
  • IsUsedATR = false;                 // Use ATR mode?  false: deviation is standard deviation;  true: deviation is ATR
  • InpDeviationPeriod = 20;       // Deviation Period
  • InpMulDeviations = 2.0;         // Multiplier of Deviation


추천 제품
RBreaker
Zhong Long Wu
RBreaker Gold Indicators는 금 선물을 위한 단기 데이 트레이딩 전략으로, 추세 추종과 데이 내 반전의 두 가지 거래 방식을 결합합니다. 추세 장에서 수익을 포착할 수 있을 뿐만 아니라, 시장이 반전될 때 적시에 이익을 확정하고 추세에 맞춰 반대 포지션을 잡을 수 있습니다. 이 전략은 미국 잡지 Futures Truth에서 15년 연속으로 가장 수익성 높은 트레이딩 전략 상위 10위 안에 선정되었습니다. 긴 라이프사이클을 자랑하며, 현재까지 국내외에서 널리 사용되고 연구되고 있습니다. 본 지표는 2026년 금 선물의 움직임을 반영하여 14일 ATR 지표를 기반으로 돌파 계수 A, 관찰 계수 B, 반전 계수 R을 보다 합리적인 값으로 정의했습니다. 매우 훌륭한 지표이며, 안정적인 연간 수익성을 달성했습니다. 강력히 추천합니다~ 위 지표는 변동성이 높은 상품에 적합하며, 매개변수는 금 선물, 주가 지수 선물 등에 적합합니다. 다른 상품이 필요한 경우 돌파 계수 A
숫자 시퀀스 중 하나를 "산불 시퀀스"라고 합니다. 가장 아름다운 새로운 시퀀스 중 하나로 인식되었습니다. 주요 특징은 이 시퀀스가 ​​가장 짧은 경우에도 선형 추세를 피한다는 것입니다. 이 지표의 기초를 형성한 것은 이 속성입니다. 금융 시계열을 분석할 때 이 지표는 가능한 모든 추세 옵션을 거부하려고 합니다. 그리고 그가 실패하는 경우에만 그는 추세의 존재를 인식하고 적절한 신호를 제공합니다. 이 접근 방식을 통해 새로운 트렌드가 시작되는 순간을 정확하게 결정할 수 있습니다. 그러나 거짓 긍정도 가능합니다. 숫자를 줄이기 위해 이 표시기에 추가 필터가 추가되었습니다. 새 막대가 열리면 신호가 생성됩니다. 어떤 경우에도 다시 그리기가 발생하지 않습니다. 표시 매개변수: Applied Price   - 적용된 가격 상수. Period Main   - 표시기의 기본 기간, 유효한 값은 5 - 60 이내입니다. Period Additional   - 추가 기간, 이 매개변수의 유효한
Universal Soul Reaper
Pieter Gerhardus Van Zyl
Universal Soul Reaper is an atmospheric market-flow oscillator designed to interpret price behavior as a cycle of spiritual energy. Instead of reacting to raw price alone, it visualizes the state of the market’s soul —revealing when momentum is awakening, stabilizing, or fading. The indicator operates in a separate window and presents three interwoven entities: the Ectoplasmic Veil , the Spirit Boundary , and the Soul Core . Together, they form a living framework that helps traders sense pressu
Noize Absorption Index
Ekaterina Saltykova
Noize Absorption Index - is the manual trading system that measures the difference of pressure between bears forces and bulls forces. Green line - is a noize free index that showing curent situation. Zero value of index shows totally choppy/flat market.Values above zero level shows how powerfull bullish wave is and values below zero measures bearish forces.Up arrow appears on bearish market when it's ready to reverse, dn arrow appears on weak bullish market, as a result of reverse expectation.
CosmiCLab FIBO
Kirils Subins
CosmiCLab SMC FIBO CosmiCLab SMC FIBO is a professional trading indicator designed for traders who use Smart Money Concepts (SMC), market structure analysis and Fibonacci retracement levels. The indicator automatically detects market swings and builds Fibonacci levels based on the latest impulse movement. It also identifies market structure changes such as BOS (Break of Structure) and CHOCH (Change of Character), helping traders understand the current market direction. CosmiCLab SMC FIBO also pr
Caicai L&S Yield Histogram Important Notice: This indicator is an integral tool of the automated EA Caicai Long and Short Pair Trading . This indicator visually displays the percentage deviation (Yield %) of a pair's current spread relative to its own historical mean. It is an excellent tool for quickly visualizing the gross financial potential of a market distortion in Long & Short operations. Main Features: Percentage Visualization: Understand the size of the distortion in palpable percentage
Bollinger Trend Lines – MT4 & MT5 Bollinger Trend Lines is a professional volatility-based trend indicator designed to clearly identify trend direction and dynamic stop levels using Bollinger Bands. Fuses on one core principle: follow the trend, ignore noise, and let volatility define the stop. How it works The indicator builds trailing trend lines using Bollinger Bands: In an uptrend , the lower band trails price and can only rise In a downtrend , the upper band trails price and can only
The  SuperTrend Advance Trading  is a widely-used technical indicator based on  SuperTrend Strategy + Price Action + EMA . How it works: -  Buy/Sell Signals  can be generated when the trend reverses, the conditions of Price action, TrendLine and EMA are met. - After the  Signal  appears, be patient and wait until the candle closes, at that time place the order as soon as possible. You may have time to review your entry, consider whether it is a good entry or not. - Carefully review the entry, up
Universal Trend
Maryna Shulzhenko
The Universal Trend indicator was created to detect trends in price movement and allows you to quickly determine not only the direction of the trend, but also understand the levels of interaction between buyers and sellers. The indicator works on all timeframes and currency pairs. The indicator gives fairly accurate signals and it is customary to use it both in trending and flat markets. It is advisable to use the indicator in combination with other tools for more reliable signals and making a
Antique Trend
Nadiya Mirosh
The Antique Trend Indicator is a revolutionary trend trading and filtering solution with all the important features of a trend tool built into one tool! The Antique Trend indicator is good for any trader, suitable for any trader both for Forex and binary options. There is no need to configure anything, everything has been perfected by time and experience, it works great during flats and trends. The Antique Trend indicator is a tool for technical analysis of financial markets, reflecting curren
Little Swinger    (Best choice for passive income lovers) Developed by RobotechTrading   key features: Financial Freedom Back testing results will match with real live trading results Proper TP and SL Controlled Risk Highly Optimized settings Running on our Real Live Accounts Little Risk, Little Drawdown, Little Stress, Little BUT stable income, just set and forget. Strategy: Not Indicator based No Martingale  No Grid  No Repaint strategy Safe and Secure calculation of Live data and than take
ROMAN5 Time Breakout Indicator automatically draws the boxes for daily support and resistance breakouts. It helps the user identifying whether to buy or sell. It comes with an alert that will sound whenever a new signal appears. It also features an email facility. Your email address and SMTP Server settings should be specified in the settings window of the "Mailbox" tab in your MetaTrader 5. Blue arrow up = Buy. Red arrow down = Sell. You can use one of my Trailing Stop products that automatical
FREE
Manyal trading system, CovEchoTrend Robot, focuses on reliability and flexibility. By employing statistical analysis methods to study the relationships between the base indicator and market patterns, the system enables a deeper understanding of market processes. Intelligent pattern analysis: The application of statistical data processing helps identify key trend reversal points more accurately, signaling significant market shifts. Informed decision-making is based on the intersection of indicato
Supply and Demand DE inspired EA Professional Supply & Demand Zone Trading System with Multi-Timeframe Confirmation Overview This advanced Expert Advisor automatically identifies and trades high-probability Supply and Demand zones using institutional trading principles. The EA combines classical supply/demand zone detection with modern confirmation filters including Break of Structure (BoS), Fair Value Gaps (FVG), and higher timeframe validation. 5m chart Setfile link: https://drive.google.com/
FREE
The   Trendlines Oscillator   helps traders identify trends and momentum based on the normalized distances between the current price and the most recently detected bullish and bearish trend lines. The indicator features bullish and bearish momentum, a signal line with crossings, and multiple smoothing options. USAGE The   Trendlines Oscillator   works by systematically: Identifying pivot highs and lows. Connecting pivots to form bullish (support) and bearish (resistance) trendlines. Measuring
Liquidity Sniper QQE Merge Liquidity Sniper QQE Merge is a technical analysis indicator for MetaTrader 5 designed to combine price level detection with momentum filtering. The indicator identifies potential price levels based on pivot structures and evaluates market conditions using a smoothed momentum calculation. Signals are generated when both price structure and momentum criteria are satisfied. It provides a visual representation of levels and signals directly on the chart. Main features: P
New Product Description for MadoCryptoXPro --- MadoCryptoXPro — The Smartest Crypto Warrior ️ Battle-tested on BTC & ETH. Built for real-time chaos. --- MadoCryptoXPro isn’t just another technical bot. It’s a battlefield machine designed to handle the madness of BTCUSD and ETHUSD with surgical precision. Whether the market is flat, trending, or just plain psycho — it stays focused, adapts fast, and protects your capital like a vault guard on Red Bull. --- Core Features: Smart
Stormer RSI 2
Ricardo Rodrigues Lucca
This strategy was learned from Stormer to be used on B3. Basically, 15 minutes before closing the market, it will check RSI and decided if it will open an position. This strategy do not define a stop loss. If the take profit reach the entry price it will close at market the position. The same happens if the maximal number of days is reached. It is created to brazilian people, so all configuration are in portuguese. Sorry Activations allowed have been set to 50.
Ichimoku Aiko MTF
Michael Jonah Randriamampionontsoa
Ichimoku Aiko MTF is a collection of technical indicators that show support and resistance levels, as well as momentum and trend direction. It is a multi-timeframe indicator so you don't need to change the chart timeframe when you want to see the ichimoku clouds on a higher timeframe.  eg. The chart timeframe is M15 and you want to see on the M15 timeframe chart the H1 ichimoku indicators (the ichimoku in Metatrader can't do that) that's why you need to use Ichimoku Aiko MTF.
SMC Venom Model BPR 지표는 Smart Money(SMC) 개념 내에서 일하는 트레이더를 위한 전문 도구입니다. 가격 차트에서 두 가지 주요 패턴을 자동으로 식별합니다. FVG (공정 가치 갭)는 3개의 캔들의 조합으로, 첫 번째와 세 번째 캔들 사이에 갭이 있습니다. 이는 볼륨 지원이 없는 레벨 사이에 구역을 형성하여 종종 가격 수정으로 이어집니다. BPR (균형 가격 범위)은 두 개의 FVG 패턴의 조합으로, "브리지"를 형성합니다. 이는 가격이 낮은 볼륨 활동으로 움직일 때 브레이크아웃과 레벨로의 복귀 구역으로, 캔들 사이에 갭을 생성합니다. 이러한 패턴은 거래자가 차트에서 거래량과 가격 역학을 분석하여 주요 지지/저항 수준, 돌파 구역 및 진입 지점을 식별하는 데 도움이 되며, 여기서 대형 시장 참여자와 일반 참여자 간의 상호 작용이 발생합니다. 이 지표는 사각형과 화살표 형태로 패턴을 시각화하며 유연한 경고 설정도 지원합니다. 주요 특징: 패턴 표시 모드
DAILY OH/OL SDEV QUANT MODEL - STATISTICAL TRADING WITH PRECISION RISK MANAGEMENT TRADE WITH MATHEMATICAL CERTAINTY - KNOW YOUR EXACT STOP-LOSS AND TAKE-PROFIT BEFORE YOU ENTER This indicator analyzes 5,000+ days of price history to give you: Exact entry levels (sigma bands locked at daily open) Exact stop-loss distance (from M
Maximum Trend Arrows OT MT5
Mulweli Valdaz Makulana
STRICTLY FOR BOOM INDEX ONLY!!!!! Here I bring the Maximum Trend Arrows OT1.0 MT5 indicator. This indicator is made up of a combination of different trend indicators for entries and exits, for entries an orange arrow will paint on the chart below the current market and a red flag for closing of trades and it produces buy arrows only. When the orange arrow appears, it will appear along with it's sound to notify you. The 1H timeframe is recommended, don't use it anywhere else than on the 1H timefr
The MACD Expert Advisor  uses the Moving Average  Convergence/Divergence indicator to determine the market trend. It uses the MACD signal to place its entries automatically. The EA also uses the moving average indicator for additional confirmation. Various settings enable the EA to be optimized for different market conditions and trend following strategies. This program can also trade on specific trading sessions to capitalize on the increase of trading volume on certain times of the day. It ca
Specialist E1
Slaven Kresic
Automatic Expert Advisor. Night scalp system, with trend detection and pullback entry. Dynamic exit signal, for SL or TP. Every trade has fix SL. No usage of risky strategies like martingale, hedge, grid etc. About EA Scalper strategy Technical strategy Can use with small deposits Pairs with best rezults: AUDNZD, AUDCAD, AUDCHF, EURAUD, GBPAUD, USDCHF, CADCHF, EURNZD, EURGBP, GBPCAD, GBPCHF, EURCHF Time Frame: M15 Recommendations Broker account with ECN and low spread Test it first to find out
Range Breakout Master is a comprehensive Expert Advisor designed to capture the full potential of range breakout and fakeout trading, one of the most reliable and widely used concepts in intraday technical trading. Built on transparent, rule-based logic with no martingale and no grid, it covers every aspect of breakout and fakeout trading - from range formation and entry logic through trade management and risk control. Its high versatility and large number of customizable inputs make it adaptab
Chỉ báo này sẽ thông báo cho bạn nếu cấu hình xu hướng thành công. Tín hiệu theo xu hướng không nên được tăng theo, nhưng tín hiệu mua ở mức giá thấp theo mô hình giao dịch thông thường của bạn, hoặc tín hiệu bán ở mức giá tốt, là một lựa chọn rất tốt. Hãy thiết lập nó trên khung thời gian lớn hơn và theo dõi các khung thời gian nhỏ hơn, bám sát các xu hướng chính. Tôi thường thiết lập ba khung thời gian gần nhau nhất và không bao giờ đi ngược tín hiệu của INdicator này. INdicator   này không có
Classic SNR MetaTrader 5 Expert Advisor | Multi-Symbol Support & Resistance Trading with Trend-Based Logic Overview Classic SNR Breakout EA is a professional trading robot that identifies structural Support & Resistance levels using daily swing points and executes trades based on H1 price action relative to these levels. The EA applies   dual logic : in an uptrend, it sells on H1 rejection below an SNR level; in a downtrend, it buys on H1 rejection above an SNR level. Breakout confirmations are
Exp5 The xCustomEA for MT5
Vladislav Andruschenko
4.27 (11)
The xCustomEA for MetaTrader 5 — 사용자 지정 지표용 범용 Expert Advisor 거의 모든 사용자 지정 지표를 자동매매 전략으로 전환할 수 있습니다. The xCustomEA for MetaTrader 5는 사용자의 커스텀 지표에서 신호를 읽고, 설정한 로직에 따라 자동으로 주문을 실행하는 범용 Expert Advisor입니다. 지표 이름, 신호 버퍼, 핵심 파라미터만 지정하면 EA가 해당 정보를 바탕으로 자동매매를 수행합니다. 새로운 아이디어가 생길 때마다 로봇을 처음부터 다시 만들지 않아도 되기 때문에, 지표 기반 전략을 빠르게 실전 운용에 연결하고 싶은 트레이더와 개발자에게 매우 실용적인 솔루션입니다. The xCustomEA는 단순한 신호 연결 도구가 아닙니다. 사용자 지정 지표 연동 기능과 The X 제품군의 강력한 거래 프레임워크를 결합하여, 진입, 청산, 필터, 보호, 포지션 관리까지 하나의 환경 안에서 구성할 수 있습니다. The xCus
Price Magnet — Price Density and Attraction Levels Indicator Price Magnet is a professional analytical tool designed to identify key support and resistance levels based on statistical Price Density. The indicator analyzes a specified historical period and detects price levels where the market spent the most time. These zones act as “magnets,” attracting price action or forming a structural base for potential reversals. Unlike traditional Volume Profile tools, Price Magnet focuses on price-time d
Tma Poc Gold
Ignacio Agustin Mene Franco
POC + TMA SCALPER GOLD - Expert Advisor Professional DESCRIPTION: Automated trading system designed specifically for XAU/USD, combining Point of Control (POC) with Triangular Moving Average (TMA) to identify high-volume and trending zones. It uses advanced risk management with dynamic trailing stops and an intelligent grid system. TECHNICA
이 제품의 구매자들이 또한 구매함
ARIPoint
Temirlan Kdyrkhan
ARIPoint is a powerful trading companion designed to generate high-probability entry signals with dynamic TP/SL/DP levels based on volatility. Built-in performance tracking shows win/loss stats, PP1/PP2 hits, and success rates all updated live. Key Features: Buy/Sell signals with adaptive volatility bands Real-time TP/SL/DP levels based on ATR Built-in MA Filter with optional ATR/StdDev volatility Performance stats panel (Success, Profit/Loss, PP1/PP2) Alerts via popup, sound, push, or email Cu
SuperScalp Pro
Van Minh Nguyen
4.59 (22)
SuperScalp Pro – 고급 멀티 필터 스캘핑 지표 시스템 SuperScalp Pro는 클래식 Supertrend와 여러 지능형 확인 필터를 결합한 고급 스캘핑 지표로, 거래 기회를 식별하는 데 도움을 줍니다. M1부터 H4까지 다양한 시간대에서 효율적으로 작동하며, XAUUSD, BTCUSD 및 주요 Forex 통화쌍에 최적화되어 있습니다. 이 지표는 명확한 매수 및 매도 신호를 제공하며, ATR 기반으로 진입가, 손절가, 익절가를 자동 계산하여 보다 효과적인 리스크 관리를 지원합니다. Fibonacci Take Profit 기능은 중요한 가격 구간에서 더 빠르게 포지션을 청산할 수 있도록 하며, 해당 수준 도달 시 알림을 전송합니다. 기본 설정은 Fibonacci Take Profit이 활성화된 상태로 최적화되어 있으며, 보다 안정적이고 일관된 거래 경험에 중점을 둡니다. 차트에 적용하는 것만으로 즉시 사용할 수 있습니다. 고급 사용자를 위해 모든 파라미터는 자유롭게 사용
Entry In The Zone and SMC Multi Timeframe is a real-time 2-in-1 market analysis tool that combines market structure analysis and a No Repaint BUY / SELL signal system into a single indicator, built on Smart Money Concepts (SMC) — a widely adopted framework used by professional traders to understand market structure. This indicator helps you see the market more clearly, make decisions based on structure rather than guesswork, and focus on high-probability zones where price is more likely to react
SignalTech MT5
Yue Wang
5 (15)
SignalTech MT5 is a trading system for EURUSD, USDCHF, USDJPY, AUDUSD, NZDUSD, EURJPY, AUDJPY, NZDJPY, CADJPY H2 and H3 Timeframe.  All the winning trades with chart setups are published on the comments page. 2025-12 1174 Pips 2026-01 2624 Pips 2026-02 2937 Pips 2026-03 2165 Pips 2026-04 2243 Pips It can generate signals with Buy/Sell Arrows and Pop-Up/Sound Alerts. Each signal has clear Entry and Stop Loss levels, which should be automatically flagged on the chart, as well as potential Targets
Divergence Bomber
Ihor Otkydach
4.9 (87)
이 지표를 구매하신 분께는 다음과 같은 혜택이 무료로 제공됩니다: 각 거래를 자동으로 관리하고, 손절/익절 수준을 설정하며, 전략 규칙에 따라 거래를 종료하는 전용 도우미 툴 "Bomber Utility" 다양한 자산에 맞게 지표를 설정할 수 있는 셋업 파일(Set Files) "최소 위험", "균형 잡힌 위험", "관망 전략" 모드로 설정 가능한 Bomber Utility의 셋업 파일 이 전략을 빠르게 설치, 설정, 시작할 수 있도록 돕는 단계별 영상 매뉴얼 주의: 위의 모든 보너스를 받기 위해서는 MQL5 개인 메시지 시스템을 통해 판매자에게 연락해 주세요. 독창적인 커스텀 지표인 “Divergence Bomber(다이버전스 봄버)”를 소개합니다. 이 지표는 MACD 다이버전스(괴리) 전략을 기반으로 한 올인원(All-in-One) 거래 시스템입니다. 이 기술 지표의 주요 목적은 가격과 MACD 지표 간의 다이버전스를 감지하고, **향후 가격이 어느 방향으로 움직일지를 알려주는
Power Candles MT5
Daniel Stein
5 (8)
Power Candles V3 - 자체 최적화 강도 지표 파워 캔들 V3는 적용된 모든 차트에서 통화 및 상품의 강세를 실행 가능한 거래 계획으로 전환합니다. 단순히 캔들에 색상을 입히는 대신, 백그라운드에서 실시간 자동 최적화를 수행하여 현재 보고 있는 종목에 대한 최적의 손절매, 익절 및 신호 임계값을 제공합니다. 한 번의 클릭으로 실시간 거래에 적용할 수 있으며, 진입점, 손절매 및 익절 선이 정확한 가격에 맞춰 차트에 표시되고, 방향과 함께 알림이 발령됩니다. 이 도구는 Stein Investments 에코시스템의 일부입니다. 18개 이상의 도구와 함께 당신의 1대1 AI 트레이딩 멘토 Max.  항상 대기 중, 모든 인디케이터를 깊이 있게 이해, 무언가를 차근차근 생각해보고 싶은 순간에 도움을 줍니다.  https://stein.investments 에서 만나보세요 매 종가 바마다 3,000회 이상의 트레이딩 시뮬레이션. 9가지 강도 상태. 2가지 전략을 병렬로 테스트.
Quantum TrendPulse
Bogdan Ion Puscasu
5 (23)
SuperTrend   ,   RSI   ,   Stochastic   의 힘을 하나의 포괄적인 지표로 결합하여 트레이딩 잠재력을 극대화하는 궁극의 트레이딩 도구   인 Quantum TrendPulse를   소개합니다. 정밀성과 효율성을 추구하는 트레이더를 위해 설계된 이 지표는 시장 추세, 모멘텀 변화, 최적의 진입 및 종료 지점을 자신 있게 식별하는 데 도움이 됩니다. 주요 특징: SuperTrend 통합:   주요 시장 추세를 쉽게 따라가고 수익성의 물결을 타세요. RSI 정밀도:   매수 과다 및 매도 과다 수준을 감지하여 시장 반전 시점을 파악하는 데 적합하며 SuperTrend 필터로 사용 가능 확률적 정확도:   변동성이 큰 시장에서 숨겨진 기회를 찾기 위해 확률적 진동   을 활용하고 SuperTrend의 필터로 사용 다중 시간대 분석:   M5부터 H1 또는 H4까지 다양한 시간대에 걸쳐 시장을 최신 상태로 유지하세요. 맞춤형 알림:   맞춤형 거래 조건이 충족되면
FX Trend MT5 NG
Daniel Stein
5 (4)
FX Trend NG: 차세대 멀티 마켓 트렌드 인텔리전스 개요 FX Trend NG 는 다중 시간 프레임 기반의 전문 트렌드 분석 및 시장 모니터링 도구입니다. 몇 초 만에 전체 시장 구조를 파악할 수 있도록 설계되었습니다. 여러 차트를 일일이 전환할 필요 없이, 어떤 종목이 추세에 있는지, 어디에서 모멘텀이 약화되고 있는지, 그리고 어떤 시간 프레임이 서로 정렬되어 있는지 즉시 확인할 수 있습니다. 출시 기념 특별 혜택 – FX Trend NG 를 $30 (6개월) 또는 $80 평생 라이선스 로 이용할 수 있습니다. 이미 Stein Investments 고객이신가요? -> 메시지를 보내 전용 고객 그룹에 참여하세요. 설정이나 사용 방법이 필요하신가요? -> Stein Investments 공식 페이지 를 방문하세요. 1. FX Trend NG가 특별한 이유 3단계 추세 로직 – 단순한 Buy / Sell이 아닙니다 • 대부분의 지표는 Buy 또는 Sell 두 가지 상태만 제
이 지표를 구매하면 제 프로페셔널 트레이드 매니저를 무료로 드립니다. 우선 이 거래 시스템이 리페인팅, 리드로잉 및 레이그 인디케이터가 아니라는 점을 강조하는 것이 중요합니다. 이는 수동 및 로봇 거래 모두에 이상적인 것으로 만듭니다. 온라인 강좌, 설명서 및 프리셋 다운로드. "스마트 트렌드 트레이딩 시스템 MT5"은 새로운 및 경험이 풍부한 트레이더를 위해 맞춤형으로 제작된 종합적인 거래 솔루션입니다. 10개 이상의 프리미엄 인디케이터를 결합하고 7개 이상의 견고한 거래 전략을 특징으로 하여 다양한 시장 조건에 대한 다목적 선택이 가능합니다. 트렌드 추종 전략: 효과적인 트렌드 추이를 타기 위한 정확한 진입 및 손절 관리를 제공합니다. 반전 전략: 잠재적인 트렌드 반전을 식별하여 트레이더가 범위 시장을 활용할 수 있게 합니다. 스캘핑 전략: 빠르고 정확한 데이 트레이딩 및 단기 거래를 위해 설계되었습니다. 안정성: 모든 인디케이터가 리페인팅, 리드로잉 및 레이그가 아니므로 신뢰
Basic Harmonic Patterns Dashboard MT5
Mehran Sepah Mansoor
4.36 (11)
이 대시보드는 선택한 심볼에 대해 사용 가능한 최신 고조파 패턴을 표시하므로 시간을 절약하고 더 효율적으로 사용할 수 있습니다 /   MT4 버전 . 무료 인디케이터:   Basic Harmonic Pattern 인디케이터 열 Symbol :   선택한 심볼이 나타납니다 Trend :   강세 또는 약세 Pattern :   패턴 유형(가틀리, 나비, 박쥐, 게, 상어, 사이퍼 또는 ABCD) Entry :   진입 가격 SL:   스톱로스 가격 TP1:   1차 테이크프로핏 가격 TP2:   2차 테이크프로핏 가격 TP3:   3차 테이크프로핏 가격 Current price:   현재 가격 Age (in bars):   마지막으로 그려진 패턴의 나이 주요 입력 Symbols :   "28개 주요 통화쌍" 또는 "선택한 심볼" 중에서 선택합니다. Selected Symbols :   쉼표로 구분하여 모니터링하려는 원하는 심볼("EURUSD,GBPUSD,XAUUSD")을 선택
Gann Made Easy MT5
Oleg Rodin
5 (3)
Gann Made Easy 는 mr.의 이론을 사용하여 최고의 거래 원칙을 기반으로 하는 전문적이고 사용하기 쉬운 Forex 거래 시스템입니다. W.D. 간. 이 표시기는 Stop Loss 및 Take Profit Levels를 포함하여 정확한 BUY 및 SELL 신호를 제공합니다. PUSH 알림을 사용하여 이동 중에도 거래할 수 있습니다. 구매 후 거래 방법 안내 및 유용한 추가 지표를 무료로 받으시려면 저에게 연락주세요! 아마도 Gann 거래 방법에 대해 이미 여러 번 들었을 것입니다. 일반적으로 Gann의 이론은 초보자 거래자뿐만 아니라 이미 거래 경험이 있는 사람들에게도 매우 복잡한 것입니다. Gann의 거래 방식은 이론적으로 적용하기 쉽지 않기 때문입니다. 나는 그 지식을 연마하고 Forex 지표에 최고의 원칙을 적용하기 위해 몇 년을 보냈습니다. 표시기는 적용하기가 매우 쉽습니다. 차트에 첨부하고 간단한 거래 권장 사항을 따르기만 하면 됩니다. 지표는 지속적으로 시장 분석
Grabber System MT5
Ihor Otkydach
4.83 (23)
탁월한 기술적 지표인 Grabber를 소개합니다. 이 도구는 즉시 사용 가능한 “올인원(All-Inclusive)” 트레이딩 전략으로 작동합니다. 하나의 코드 안에 강력한 시장 기술 분석 도구, 매매 신호(화살표), 알림 기능, 푸시 알림이 통합되어 있습니다. 이 인디케이터를 구매하신 모든 분들께는 다음의 항목이 무료로 제공됩니다: Grabber 유틸리티: 오픈 포지션을 자동으로 관리하는 도구 단계별 영상 매뉴얼: 설치, 설정, 그리고 실제 거래 방법을 안내 맞춤형 세트 파일: 인디케이터를 빠르게 자동 설정하여 최고의 성과를 낼 수 있도록 도와줍니다 다른 전략은 이제 잊어버리세요! Grabber만이 여러분을 새로운 트레이딩의 정점으로 이끌어 줄 수 있습니다. Grabber 전략의 주요 특징: 거래 시간 프레임: M5부터 H4까지 거래 가능한 자산: 어떤 자산이든 사용 가능하지만, 제가 직접 테스트한 종목들을 추천드립니다 (GBPUSD, GBPCAD, GBPCHF, AUDCAD, AU
Btmm state engine pro
Garry James Goodchild
5 (4)
BTMM State Engine Pro is a MetaTrader 5 indicator for traders who use the Beat The Market Maker approach: Asian session context, kill zone timing, level progression, peak formation detection, and a multi-pair scanner from a single chart. It combines cycle state logic with a built-in scanner dashboard so you do not need the same tool on many charts at once. What it does Draws the Asian session range; session times can follow broker server offset or be set in inputs. Tracks level progression (L
Trend Screener Pro MT5
STE S.S.COMPANY
4.85 (104)
트렌드 표시기, 트렌드 트레이딩 및 필터링을 위한 획기적인 고유 솔루션, 하나의 도구 안에 내장된 모든 중요한 트렌드 기능! Forex, 상품, 암호 화폐, 지수 및 주식과 같은 모든 기호/도구에 사용할 수 있는 100% 다시 칠하지 않는 다중 시간 프레임 및 다중 통화 표시기입니다. Trend Screener는 차트에 점이 있는 화살표 추세 신호를 제공하는 효율적인 지표 추세 추종 지표입니다. 추세 분석기 표시기에서 사용할 수 있는 기능: 1. 트렌드 스캐너. 2. 최대 이익 분석이 있는 추세선. 3. 추세 통화 강도 측정기. 4. 경고가 있는 추세 반전 점. 5. 경고가 있는 강력한 추세 점. 6. 추세 화살표 Trend Screener Indicator가 있는 일일 분석 예, 일일 신호 성능...등은 여기에서 찾을 수 있습니다. 여기를 클릭하십시오. LIMITED TIME OFFER : Trend Screener Indicator는 50$ 및 평생 동안만 사용할 수 있습니다.
소개       Quantum Breakout PRO   , 브레이크아웃 존 거래 방식을 변화시키는 획기적인 MQL5 지표! 13년 이상의 거래 경험을 가진 숙련된 트레이더 팀이 개발한       퀀텀 브레이크아웃 PRO       혁신적이고 역동적인 브레이크아웃 존 전략으로 거래 여정을 새로운 차원으로 끌어올리도록 설계되었습니다. Quantum Breakout Indicator는 5개의 이익 목표 영역이 있는 브레이크아웃 영역의 신호 화살표와 브레이크아웃 상자를 기반으로 한 손절 제안을 제공합니다. 초보자 거래자와 전문 거래자 모두에게 적합합니다. Quantum EA 채널:       여기를 클릭하세요 중요한! 구매 후 설치 매뉴얼을 받으려면 개인 메시지를 보내주십시오. 추천: 기간: M15 통화쌍: GBPJPY, EURJPY, USDJPY,NZDUSD, XAUUSD 계정 유형: 스프레드가 매우 낮은 ECN, Raw 또는 Razor 브로커 시간: GMT +3 중개인 :
Meridian Pro
Ottaviano De Cicco
5 (1)
Meridian Pro 2.00: Professional Multi-Timeframe Trend Matrix for MT5 Meridian Pro 2.00 is a professional adaptive trend matrix for MetaTrader 5. It combines the original Meridian trend engine, a clean chart ribbon, closed-bar signal arrows, an 8-timeframe dashboard, Fuel momentum, weighted consensus, synthetic HTF processing and chart-native higher-timeframe context lines. The goal is simple: read current trend, multi-timeframe structure, strength, momentum and EA-ready state from one discipline
Azimuth Pro
Ottaviano De Cicco
5 (7)
Azimuth Pro V2: Synthetic Fractal Structure and Confirmed Entries for MT5 Overview Azimuth Pro is a multi-level swing structure indicator by Merkava Labs . Four nested swing layers, swing-anchored VWAP, ABC pattern detection, three-timeframe structural filtering, and closed-bar confirmed entries — one chart, one workflow from micro-swings to macro-cycles. This is not a blind signal product. It is a structure-first workflow for traders who care about location, context, and timing. V2 Launch Offe
우선적으로, 이 거래 도구는 전문적인 거래에 이상적인 비-다시 그리기 및 지연되지 않는 지표입니다.  온라인 강좌, 사용자 매뉴얼 및 데모. 스마트 가격 액션 컨셉트 인디케이터는 신규 및 경험 많은 트레이더 모두에게 매우 강력한 도구입니다. Inner Circle Trader Analysis 및 Smart Money Concepts Trading Strategies와 같은 고급 거래 아이디어를 결합하여 20가지 이상의 유용한 지표를 하나로 결합합니다. 이 인디케이터는 스마트 머니 컨셉트에 중점을 두어 대형 기관의 거래 방식을 제공하고 이동을 예측하는 데 도움을 줍니다.  특히 유동성 분석에 뛰어나 기관이 어떻게 거래하는지 이해하는 데 도움을 줍니다. 시장 트렌드를 예측하고 가격 변동을 신중하게 분석하는 데 탁월합니다. 귀하의 거래를 기관 전략에 맞추어 시장의 동향에 대해 더 정확한 예측을 할 수 있습니다. 이 인디케이터는 시장 구조를 분석하고 중요한 주문 블록을 식별하고 다양
FX Levels MT5
Daniel Stein
5 (13)
FX Levels: 모든 시장을 위한 뛰어난 정확도의 지지와 저항 간단 요약 통화쌍, 지수, 주식, 원자재 등 어떤 시장이든 믿을 만한 지지·저항 레벨을 찾고 싶나요? FX Levels 는 전통적인 “Lighthouse” 기법과 첨단 동적 접근을 결합해, 거의 보편적인 정확성을 제공합니다. 실제 브로커 경험을 반영하고, 자동화된 일별 업데이트와 실시간 업데이트를 결합함으로써 FX Levels 는 가격 반전 포인트를 파악하고, 수익 목표를 설정하며, 자신 있게 트레이드를 관리할 수 있게 돕습니다. 지금 바로 시도해 보세요—정교한 지지/저항 분석이 어떻게 여러분의 트레이딩을 한 단계 끌어올릴 수 있는지 직접 확인하세요! 1. FX Levels가 트레이더에게 매우 유용한 이유 뛰어난 정확도의 지지·저항 존 • FX Levels 는 다양한 브로커 환경에서도 거의 동일한 존을 생성하도록 설계되어, 데이터 피드나 시간 설정 차이로 인한 불일치를 해소합니다. • 즉, 어떤 브로커를 사용하
OmniSync Projection
Antonio-alin Teculescu
5 (1)
Chronos Fractal Engine is an innovative price projection indicator for MetaTrader 5, designed to transform your technical analysis by intelligently identifying and projecting historical price patterns. Built upon an advanced correlation algorithm and the fractal principles of the market, this powerful tool visualizes potential future price movements, giving you a unique edge in your trading decisions. What is Chronos Fractal Engine? At its core, the Chronos Fractal Engine employs a sophisticat
RelicusRoad Pro MT5
Relicus LLC
5 (24)
RelicusRoad Pro: 퀀트 시장 운영 체제 70% 할인 평생 이용권 (한정 시간) - 2,000명 이상의 트레이더와 함께하세요 왜 대부분의 트레이더는 "완벽한" 지표를 가지고도 실패할까요? 진공 상태에서 단일 개념 만으로 거래하기 때문입니다. 문맥 없는 신호는 도박입니다. 지속적인 승리를 위해서는 컨플루언스(중첩) 가 필요합니다. RelicusRoad Pro는 단순한 화살표 지표가 아닙니다. 완전한 퀀트 시장 생태계 입니다. 독점적인 변동성 모델링을 사용하여 가격이 이동하는 "공정 가치 로드"를 매핑하고, 단순 노이즈와 실제 구조적 돌파를 구분합니다. 추측은 그만두세요. 기관급 로드 로직으로 거래를 시작하세요. 핵심 엔진: "Road" 알고리즘 시스템의 중심에는 시장 상황에 실시간으로 적응하는 동적 변동성 채널인 Road Algo 가 있습니다. 세이프 라인(평형) 과 가격이 수학적으로 반전될 가능성이 높은 확장 레벨 을 투영합니다. Simple Road: 일반적인 시장을 위
Atomic Analyst MT5
Issam Kassas
3.94 (31)
우선적으로 언급할 점은이 거래 지표가 다시 그리지 않고 지연되지 않으며 이를 통해 수동 및 로봇 거래 모두에 이상적이라는 점입니다. 사용자 매뉴얼: 설정, 입력 및 전략. Atomic Analyst는 가격의 강도와 모멘텀을 활용하여 시장에서 더 나은 이점을 찾는 PA Price Action Indicator입니다. 고급 필터를 장착하여 잡음과 거짓 신호를 제거하고 거래 잠재력을 높이는 데 도움이 됩니다. 복잡한 지표의 다중 레이어를 사용하여 Atomic Analyst는 차트를 스캔하고 복잡한 수학적 계산을 간단한 신호와 색상으로 변환하여 초보 트레이더가 이해하고 일관된 거래 결정을 내릴 수 있도록합니다. "Atomic Analyst"는 새로운 및 경험이 풍부한 트레이더를위한 종합적인 거래 솔루션입니다. 프리미엄 지표와 최고 수준의 기능을 하나의 거래 전략에 결합하여 모든 종류의 트레이더에 대한 다재다능한 선택지가되었습니다. 인트라데이 거래 및 스캘핑 전략 : 빠르고 정확한 일일
Trend indicator AI mt5
Ramil Minniakhmetov
5 (17)
트렌드 인공 지능 지표는 실행 가능한 진입 점 및 반전 경고와 추세 식별을 결합하여 상인의 시장 분석을 향상시킬 훌륭한 도구입니다. 이 표시기는 사용자가 자신감과 정밀도로 외환 시장의 복잡성을 탐색 할 수 있도록 지원합니다 기본 신호 외에도 트렌드 인공 지능 지표는 풀백 또는 되돌림 중에 발생하는 2 차 진입 점을 식별하여 거래자가 기존 트렌드 내에서 가격 수정을 활용할 수 있도록합니다. 중요한 장점: ·작동 4 및 5 *명확한 구매 또는 판매 신호 *다시 칠하지 않습니다 *모든 자산에서 작동 나는 전보 사기에 개 또는 세트를 판매하지 않도록주의. 모든 설정은 블로그에 여기에 무료.  중요! 지침 및 보너스를 얻기 위해 구입 후 즉시 저에게 연락! 진짜 가동 감시는 뿐 아니라 나의 다른 제품 여기에서 찾아낼 수 있습니다: https://www.mql5.com/en/users/mechanic/seller&nbsp ; 설정 및 입력: 모든 자산에 대해 기본 설정을 권
SMC Intraday Formula
Kareem Abbas
5 (5)
먼저 솔직하게 말하겠습니다. 어떤 인디케이터도 단독으로 당신을 수익성 있게 만들어주지 않습니다. 누군가 그렇게 말한다면, 그는 당신에게 꿈을 파는 것입니다. 완벽한 매수/매도 화살표를 보여주는 모든 인디케이터는 완벽하게 보이도록 만들 수 있습니다 — 단지 올바른 과거 구간을 확대하고 승리한 거래만 캡처하면 됩니다. 우리는 그렇게 하지 않습니다.  SMC Intraday Formula는 도구입니다. 시장 구조를 읽고, 가장 높은 확률의 가격 구간을 표시하며, 현재 스마트 머니의 흐름이 어떻게 보이는지 아주 단순한 언어로 보여줍니다. 최종 결정은 여전히 당신이 합니다. 실행도 당신이 합니다. 하지만 이제는 희망이 아니라 정확성으로 거래하게 됩니다. 우리는 이 인디케이터를 지난 약 3년 동안 골드(XAUUSD) 및 주요 외환 통화쌍의 데이 트레이딩 스캘핑에 사용해 왔습니다. M1, M5, M15, M30에서 우리의 핵심 도구입니다. 이 도구는 미래를 예측하려 하지 않습니다 — 지금 형성
FX Power MT5 NG
Daniel Stein
5 (31)
FX Power: 통화 강세 분석으로 더 스마트한 거래 결정을 개요 FX Power 는 어떤 시장 상황에서도 주요 통화와 금의 실제 강세를 이해하기 위한 필수 도구입니다. 강한 통화를 매수하고 약한 통화를 매도함으로써 FX Power 는 거래 결정을 단순화하고 높은 확률의 기회를 발견합니다. 트렌드를 따르거나 극단적인 델타 값을 사용해 반전을 예측하고자 한다면, 이 도구는 귀하의 거래 스타일에 완벽히 적응합니다. 단순히 거래하지 말고, FX Power 로 더 스마트하게 거래하세요. 1. FX Power가 거래자에게 매우 유용한 이유 통화와 금의 실시간 강세 분석 • FX Power 는 주요 통화와 금의 상대적 강세를 계산하고 표시하여 시장 역학에 대한 명확한 통찰력을 제공합니다. • 어떤 자산이 앞서고 있고 어떤 자산이 뒤처지는지 모니터링하여 보다 현명한 거래 결정을 내릴 수 있습니다. 포괄적인 멀티 타임프레임 뷰 • 단기, 중기 및 장기 타임프레임에서 통화와 금의 강세를
Smart Stop Indicator – 차트 위에서 직접 작동하는 지능형 스톱로스 시스템 개요 Smart Stop Indicator는 감이나 추측이 아닌 명확하고 체계적인 방식으로 스톱로스를 설정하고 싶은 트레이더를 위한 맞춤형 솔루션입니다. 이 도구는 클래식 프라이스 액션 논리(고점, 저점 구조)와 현대적인 브레이크아웃 인식을 결합하여 실제로 가장 논리적인 다음 스톱 레벨을 정확히 식별합니다. 추세, 박스권, 빠른 브레이크아웃 상황 등 어떤 시장에서도 인디케이터는 최적의 SL 구역과 상태(“new”, “broken”, “valid”)를 차트에 직접 표시합니다. 새로운 기능으로 SL 거리의 %ADR 표시가 추가되었습니다. 핵심 기능 자동 시장구조 기반 스톱 설정 • 시장 구조와 실시간 가격 움직임을 기반으로 의미 있는 스톱로스 레벨을 자동으로 탐지합니다. 스마트 브레이크아웃 감지 • 빠른 방향 변화나 돌파 상황에서도 불필요한 조기 스톱 조정을 강요하지 않으며 유연하게 반응합
Market Structure Order Block Dashboard MT5는 시장 구조와 주요 가격 반응 구역을 차트에서 직접 읽고자 하는 트레이더를 위해 설계된 MT5 지표입니다. BOS, ChoCH, 오더 블록, Fair Value Gap (FVG), 유동성, Kill Zones, Volume Profile 그리고 빠른 분석을 위한 콤팩트한 대시보드를 결합합니다. 이 지표는 시장 구조, ICT 및 Smart Money 개념을 의사결정 프레임워크로 사용하는 트레이더를 대상으로 합니다. 추세 지속, 가능한 반전, 가격 불균형, 유동성 타겟 및 관심 구역을 보다 체계적으로 식별하는 데 도움을 줄 수 있습니다. 구매자를 위한 포함 리소스 구매 후 MQL5 개인 메시지로 요청하시면 완전한 PDF 사용 설명서와 파라미터 설정 팁을 제공해 드립니다. MQL5 개인 메시지를 통한 직접 기술 지원. 1.20 버전은 두 가지 주요 추가 기능을 제공합니다: Pending BOS / Pending
Crystal Heikin Ashi Signals
Muhammad Jawad Shabir
5 (2)
Crystal Heikin Ashi Signals - Professional Trend & Signal Detection Indicator Advanced Heikin Ashi Visualization with Intelligent Signal System for Manual & Automated Trading Final Price: $149 ---------> Price goes up $10 after every 10 sales . Limited slots available — act fast . Overview Crystal Heikin Ashi Signals is a professional-grade MetaTrader 5 indicator that combines pure Heikin Ashi candle visualization with an advanced momentum-shift detection system. Designed for both manual traders
KT Alpha Hunter Arrows MT5
KEENBASE SOFTWARE SOLUTIONS
대부분의 화살표 인디케이터는 신호만 보여주고, 나머지 판단은 모두 트레이더에게 맡깁니다. KT Alpha Hunter Arrows는 완성된 트레이딩 플랜을 제공합니다. 각 신호 화살표가 표시될 때마다 진입선, 손절선, 네 개의 익절 목표, 그리고 현재 심볼과 시간대가 지금 거래할 가치가 있는지 알려주는 실시간 엣지 판정이 함께 그려집니다. 포함된 Trade Manager EA는 사용자가 직접 진입한 뒤의 실행 관리를 맡아, 시장이 흔들리고 감정이 개입되기 쉬운 상황에서도 거래 원칙을 유지할 수 있도록 도와줍니다. 리페인트 없음. 종가 확정 후 신호만 표시. Forex, Gold, Indices 및 사용자가 거래하는 다양한 MT5 지원 상품에 맞게 설계되었습니다. 주요 기능 캔들이 마감된 후에만 표시되는 리페인트 없는 매수 및 매도 화살표. 각 신호마다 진입선, 구조적 손절선, 네 개의 익절 목표 표시. 현재 차트에서 매수와 매도 셋업을 별도로 평가하는 Edge Dashboard.
Market Structure Patterns
Samuel Manoel De Souza
4.47 (19)
Market Structure Patterns   is an indicator based on   smart money concepts   that displays   SMC/ICT   elements that can take your trading decisions to the next level. Take advantage of the   alerts ,   push notifications   and   email messages   to keep informed from when an element is formed on the chart, the price crosses a level and/or enters in a box/zone. Developers can access the values of the elements of the indicator using the   global variables  what allows the automation of trading
제작자의 제품 더 보기
1. Why did I develop this series of indicators I found that most traders need to use multiple time frame indicators. They usually switch time frame to see indicators. However, once the timeframe is switched, you cannot see the  corresponding relationship  between  the price in the smaller timeframe  and  the indicator in the larger timeframe . For example: if your price chart is in H1 timeframe, you can see H4, D1 and W1 indicators in H1 timeframe Chart. This is more helpful for you to find th
This product can be used to synchronize multiple Charts, and each Chart can be set to a different sync mode. With this product you can better view and manipulate charts: different time frames for a single Symbol, the same time frame for multiple Symbols... and more. PS: The link below is the FreeDemo product, you can use it on EURUSD/XUAUSD/USDCNH symbol: https://www.mql5.com/en/market/product/38557 Feature: Chart settings  can be synchronized, including : background, indentation, size, etc. M
This product can be used to synchronize multiple Charts, and each Chart can be set to a different sync mode. With this product you can better view and manipulate charts: different time frames for a single Symbol, the same time frame for multiple Symbols, system indicators for single/multiple Symbols... and more. Feature: Chart settings can be synchronized, including : background, indentation, size, etc. Multiple Chart window start times  or end times can be synchronized. Multiple Chart time fr
Have you ever take a long time to watch a Symbol when the network link is not good ? Have you ever wait for a long time when you switch chart between different Symbols or different TimeFrames ? If you do long-term backtesting , Have you ever to be downloaded datas for a long time ? Yes, If there is no data in the system, those will happen.  1. What is this: Download all the Symbol data in Market Watch to the system. PS: This is not outputting data to Files. This Link go to Demo version: https:/
Do you think it's a bit cumbersome when you need to switch symbols or timeframes with mouse click? 1. What is this? This is a program that can switch symbols and timeframes with direction keys. Fast switching, very convenient, no mouse click required. For traders, one symbol with multi-timeframe charts are usually added,  you can change symbol on those charts easily. For multi-currency traders, different symbol charts are usually added, you can also change those timeframes easily. I wrote this p
1. What is this         Rising volatility and falling volatility are not the same, whether it is academic research or actual testing has shown this point.         The original ATR indicator is calculated by putting up and down fluctuations together. This indicator is to calculate separately the upward volatility and the downward volatility, which can better help you study the market. 2. Indicator description          There are two modes for the calculation of this indicator, as shown in the fo
I see that many tools in the market deal with Position and Order in the form of operation panels. Which is loaded into a Chart in the form of an EA. However, once the operator panel EA is loaded, no other EAs can be loaded. So, I wrote the one-click operation of Position and Order as a script, so you can load other EAs and easily complete one-click operation of Trade. 1. What is this: This is a one-click script to close position order. Now you can close position tickets at high speed, for examp
I see that many tools in the market deal with Position and Order in the form of operation panels. Which is loaded into a Chart in the form of an EA. However, once the operator panel EA is loaded, no other EAs can be loaded. So, I wrote the one-click operation of Position and Order as a script, so you can load other EAs and easily complete one-click operation of Trade. 1. What is this: This is a one-click script to delete the pending order . Now you can delete pending tickets at high speed, for
Do you think it's a bit cumbersome when you need to switch symbols or timeframes with mouse click? 1. What is this? This is a program that can switch symbols and timeframes with direction keys. Fast switching, very convenient, no mouse click required. For traders, one symbol with multi-timeframe charts are usually added,  you can change symbol on those charts  easily . For multi-currency traders, different symbol charts are usually added, you can also change those timeframes easily. I wrote thi
According to trading experience: Some symbols are easy to reverse on certain days, such as Monday, or afternoon, and so on. So comparing the current price with the corresponding historical moment price is valuable. If the price coordinate system uses a logarithmic price, you will get a lot of valuable information. 1. What is this? This program can convert the symbol price and add it to your Chart. You can compare it with your major chart. The DEMO version Link: https://www.mql5.com/en/market/pr
What is this: Violent trading: means sending a large number of orders to your brokerage server,  it can conduct a stress test of the trading. In this program you can run a variety of trading tests.  Now you can trade at high speed, For example 1000 orders in an instant. The Demo version's link:  https://www.mql5.com/en/market/product/38431/ Why to use: Whether manual trading or EA trading,  the status of the broker server is very important. So it is beneficial to conduct a trading stress test on
1. Why did I develop this series of indicators I found that most traders need to use multiple time frame indicators. They usually switch time frame to see indicators. However, once the timeframe is switched, you cannot see the  corresponding relationship  between  the price in the smaller timeframe  and  the indicator in the larger timeframe . For example: if your price chart is in H1 timeframe, you can see H4, D1 and W1 indicators in H1 timeframe Chart. This is more helpful for you to find th
필터:
Аврора
96
Аврора 2021.08.31 11:01 
 

사용자가 평가에 대한 코멘트를 남기지 않았습니다

리뷰 답변