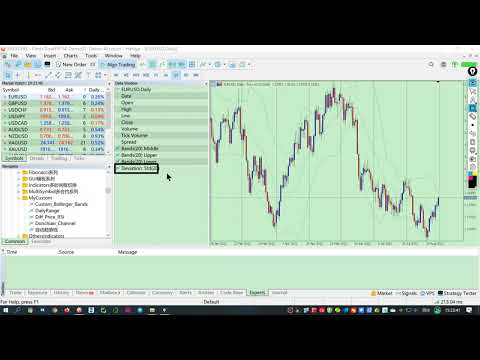
Custom Bollinger Bands

1. What is it

The classic Bollinger Bands and the Bollinger Bands indicator built into the system,  they have the same mean period and deviation period.  And the method of average is just the simple moving average method.  The deviation method used is just the standard deviation method.  All this limits our research because:
  • Sometimes we would like to have longer period averages + shorter period deviations.
  • Sometimes we want moving averages that are not limited to simple moving averages but also include other moving average patterns.
  • The standard deviation is used to portray price fluctuations influenced by price position, while the ATR is used to portray price fluctuations that reflect a different market situation.

Therefore, we developed the Bollinger Bands indicator which has more functions.

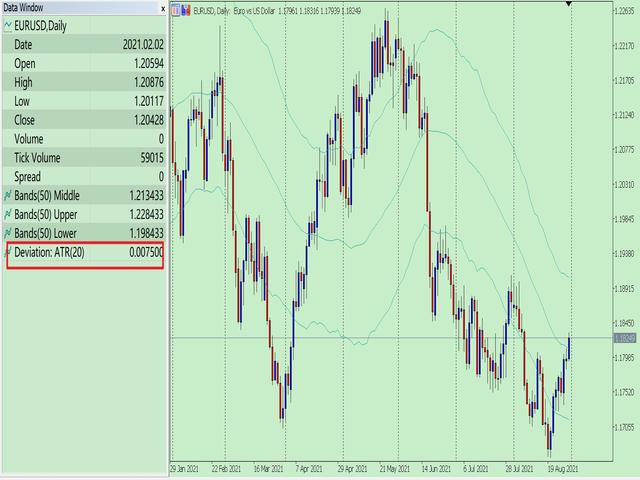
2. Calculation method

  • Mean (mean value under a method)  +/-  Multiplier * Deviation (Standard Deviation or ATR)

3. How to use

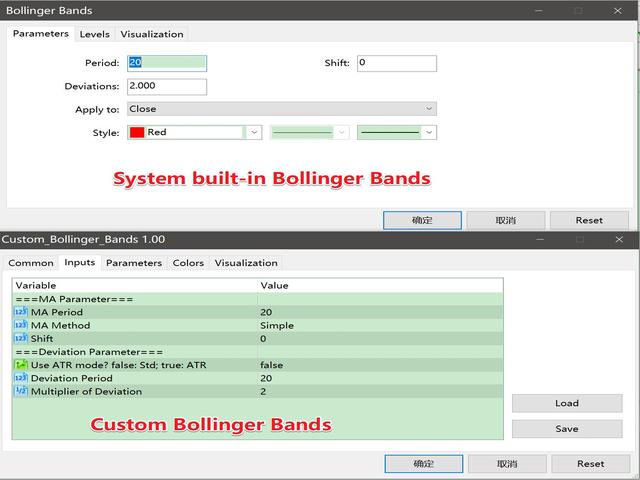
The following is an introduction to the indicator parameters, which are simple and easy to understand.
===MA Parameter===
  • InpMAPeriod = 20;                         // MA Period
  • InpMAShift = 0;                             // MA Shift, Only MA Value Shift.
  • InpMAMethod = MODE_SMA;           // MA Method:  MODE_SMA,  MODE_EMA,  MODE_SMMA,  MODE_LWMA
  • InpApplied_Price = PRICE_CLOSE;  // MA applied_price
  • InpAllShift= 0;                              // All Shift(Plot Shfit)
===Deviation Parameter===
  • IsUsedATR = false;                 // Use ATR mode?  false: deviation is standard deviation;  true: deviation is ATR
  • InpDeviationPeriod = 20;       // Deviation Period
  • InpMulDeviations = 2.0;         // Multiplier of Deviation


Prodotti consigliati
RBreaker
Zhong Long Wu
RBreaker Gold Indicators is a short-term intraday trading strategy for gold futures that combines trend following and intraday reversal approaches. It not only captures profits during trending markets but also enables timely profit-taking and counter-trend trading during market reversals. This strategy has been ranked among the top ten most profitable trading strategies by the American magazine   Futures Truth   for 15 consecutive years. It boasts a long lifecycle and remains widely used and st
Una delle sequenze numeriche è chiamata "Sequenza di incendi boschivi". È stata riconosciuta come una delle nuove sequenze più belle. La sua caratteristica principale è che questa sequenza evita andamenti lineari, anche quelli più brevi. È questa proprietà che ha costituito la base di questo indicatore. Quando si analizza una serie temporale finanziaria, questo indicatore cerca di rifiutare tutte le possibili opzioni di tendenza. E solo se fallisce, riconosce la presenza di una tendenza e dà il
Universal Soul Reaper
Pieter Gerhardus Van Zyl
Universal Soul Reaper is an atmospheric market-flow oscillator designed to interpret price behavior as a cycle of spiritual energy. Instead of reacting to raw price alone, it visualizes the state of the market’s soul —revealing when momentum is awakening, stabilizing, or fading. The indicator operates in a separate window and presents three interwoven entities: the Ectoplasmic Veil , the Spirit Boundary , and the Soul Core . Together, they form a living framework that helps traders sense pressu
Noize Absorption Index - is the manual trading system that measures the difference of pressure between bears forces and bulls forces. Green line - is a noize free index that showing curent situation. Zero value of index shows totally choppy/flat market.Values above zero level shows how powerfull bullish wave is and values below zero measures bearish forces.Up arrow appears on bearish market when it's ready to reverse, dn arrow appears on weak bullish market, as a result of reverse expectation.
CosmiCLab SMC FIBO CosmiCLab SMC FIBO is a professional trading indicator designed for traders who use Smart Money Concepts (SMC), market structure analysis and Fibonacci retracement levels. The indicator automatically detects market swings and builds Fibonacci levels based on the latest impulse movement. It also identifies market structure changes such as BOS (Break of Structure) and CHOCH (Change of Character), helping traders understand the current market direction. CosmiCLab SMC FIBO also pr
Caicai L&S Yield Histogram Important Notice: This indicator is an integral tool of the automated EA Caicai Long and Short Pair Trading . This indicator visually displays the percentage deviation (Yield %) of a pair's current spread relative to its own historical mean. It is an excellent tool for quickly visualizing the gross financial potential of a market distortion in Long & Short operations. Main Features: Percentage Visualization: Understand the size of the distortion in palpable percentage
Bollinger Trend Lines – MT4 & MT5 Bollinger Trend Lines is a professional volatility-based trend indicator designed to clearly identify trend direction and dynamic stop levels using Bollinger Bands. Fuses on one core principle: follow the trend, ignore noise, and let volatility define the stop. How it works The indicator builds trailing trend lines using Bollinger Bands: In an uptrend , the lower band trails price and can only rise In a downtrend , the upper band trails price and can only
The  SuperTrend Advance Trading  is a widely-used technical indicator based on  SuperTrend Strategy + Price Action + EMA . How it works: -  Buy/Sell Signals  can be generated when the trend reverses, the conditions of Price action, TrendLine and EMA are met. - After the  Signal  appears, be patient and wait until the candle closes, at that time place the order as soon as possible. You may have time to review your entry, consider whether it is a good entry or not. - Carefully review the entry, up
Universal Trend
Maryna Shulzhenko
The Universal Trend indicator was created to detect trends in price movement and allows you to quickly determine not only the direction of the trend, but also understand the levels of interaction between buyers and sellers. The indicator works on all timeframes and currency pairs. The indicator gives fairly accurate signals and it is customary to use it both in trending and flat markets. It is advisable to use the indicator in combination with other tools for more reliable signals and making a
The Antique Trend Indicator is a revolutionary trend trading and filtering solution with all the important features of a trend tool built into one tool! The Antique Trend indicator is good for any trader, suitable for any trader both for Forex and binary options. There is no need to configure anything, everything has been perfected by time and experience, it works great during flats and trends. The Antique Trend indicator is a tool for technical analysis of financial markets, reflecting curren
Little Swinger    (Best choice for passive income lovers) Developed by RobotechTrading   key features: Financial Freedom Back testing results will match with real live trading results Proper TP and SL Controlled Risk Highly Optimized settings Running on our Real Live Accounts Little Risk, Little Drawdown, Little Stress, Little BUT stable income, just set and forget. Strategy: Not Indicator based No Martingale  No Grid  No Repaint strategy Safe and Secure calculation of Live data and than take
ROMAN5 Time Breakout Indicator automatically draws the boxes for daily support and resistance breakouts. It helps the user identifying whether to buy or sell. It comes with an alert that will sound whenever a new signal appears. It also features an email facility. Your email address and SMTP Server settings should be specified in the settings window of the "Mailbox" tab in your MetaTrader 5. Blue arrow up = Buy. Red arrow down = Sell. You can use one of my Trailing Stop products that automatical
FREE
Manyal trading system, CovEchoTrend Robot, focuses on reliability and flexibility. By employing statistical analysis methods to study the relationships between the base indicator and market patterns, the system enables a deeper understanding of market processes. Intelligent pattern analysis: The application of statistical data processing helps identify key trend reversal points more accurately, signaling significant market shifts. Informed decision-making is based on the intersection of indicato
Supply and Demand DE inspired EA Professional Supply & Demand Zone Trading System with Multi-Timeframe Confirmation Overview This advanced Expert Advisor automatically identifies and trades high-probability Supply and Demand zones using institutional trading principles. The EA combines classical supply/demand zone detection with modern confirmation filters including Break of Structure (BoS), Fair Value Gaps (FVG), and higher timeframe validation. 5m chart Setfile link: https://drive.google.com/
FREE
The   Trendlines Oscillator   helps traders identify trends and momentum based on the normalized distances between the current price and the most recently detected bullish and bearish trend lines. The indicator features bullish and bearish momentum, a signal line with crossings, and multiple smoothing options. USAGE The   Trendlines Oscillator   works by systematically: Identifying pivot highs and lows. Connecting pivots to form bullish (support) and bearish (resistance) trendlines. Measuring
New Product Description for MadoCryptoXPro --- MadoCryptoXPro — The Smartest Crypto Warrior ️ Battle-tested on BTC & ETH. Built for real-time chaos. --- MadoCryptoXPro isn’t just another technical bot. It’s a battlefield machine designed to handle the madness of BTCUSD and ETHUSD with surgical precision. Whether the market is flat, trending, or just plain psycho — it stays focused, adapts fast, and protects your capital like a vault guard on Red Bull. --- Core Features: Smart
Stormer RSI 2
Ricardo Rodrigues Lucca
This strategy was learned from Stormer to be used on B3. Basically, 15 minutes before closing the market, it will check RSI and decided if it will open an position. This strategy do not define a stop loss. If the take profit reach the entry price it will close at market the position. The same happens if the maximal number of days is reached. It is created to brazilian people, so all configuration are in portuguese. Sorry Activations allowed have been set to 50.
Ichimoku Aiko MTF
Michael Jonah Randriamampionontsoa
Ichimoku Aiko MTF is a collection of technical indicators that show support and resistance levels, as well as momentum and trend direction. It is a multi-timeframe indicator so you don't need to change the chart timeframe when you want to see the ichimoku clouds on a higher timeframe.  eg. The chart timeframe is M15 and you want to see on the M15 timeframe chart the H1 ichimoku indicators (the ichimoku in Metatrader can't do that) that's why you need to use Ichimoku Aiko MTF.
Prime Power ML è un Currency Strength Meter avanzato con due modelli di reti neurali ONNX che filtrano i segnali per probabilità di vincita prima di mostrarli. A differenza degli indicatori CSM tradizionali che mostrano ogni divergenza tra valute, Prime Power ML evidenzia solo i segnali dove l'AI conferma un vantaggio statistico. Come funziona L'indicatore calcola in tempo reale la forza di 8 valute principali (USD, EUR, GBP, JPY, AUD, CAD, CHF, NZD) usando il punteggio RSI su tutte le 28 coppie
L'indicateur SMC Venom Model BPR est un outil professionnel pour les traders travaillant dans le concept Smart Money (SMC). Il identifie automatiquement deux modèles clés sur le graphique des prix: FVG   (Fair Value Gap) est une combinaison de trois bougies, dans laquelle il y a un écart entre la première et la troisième bougie. Forme une zone entre les niveaux où il n'y a pas de support de volume, ce qui conduit souvent à une correction des prix. BPR   (Balanced Price Range) est une combinaiso
DAILY OH/OL SDEV QUANT MODEL - STATISTICAL TRADING WITH PRECISION RISK MANAGEMENT TRADE WITH MATHEMATICAL CERTAINTY - KNOW YOUR EXACT STOP-LOSS AND TAKE-PROFIT BEFORE YOU ENTER This indicator analyzes 5,000+ days of price history to give you: Exact entry levels (sigma bands locked at daily open) Exact stop-loss distance (from M
STRICTLY FOR BOOM INDEX ONLY!!!!! Here I bring the Maximum Trend Arrows OT1.0 MT5 indicator. This indicator is made up of a combination of different trend indicators for entries and exits, for entries an orange arrow will paint on the chart below the current market and a red flag for closing of trades and it produces buy arrows only. When the orange arrow appears, it will appear along with it's sound to notify you. The 1H timeframe is recommended, don't use it anywhere else than on the 1H timefr
The MACD Expert Advisor  uses the Moving Average  Convergence/Divergence indicator to determine the market trend. It uses the MACD signal to place its entries automatically. The EA also uses the moving average indicator for additional confirmation. Various settings enable the EA to be optimized for different market conditions and trend following strategies. This program can also trade on specific trading sessions to capitalize on the increase of trading volume on certain times of the day. It ca
Specialist E1
Slaven Kresic
Automatic Expert Advisor. Night scalp system, with trend detection and pullback entry. Dynamic exit signal, for SL or TP. Every trade has fix SL. No usage of risky strategies like martingale, hedge, grid etc. About EA Scalper strategy Technical strategy Can use with small deposits Pairs with best rezults: AUDNZD, AUDCAD, AUDCHF, EURAUD, GBPAUD, USDCHF, CADCHF, EURNZD, EURGBP, GBPCAD, GBPCHF, EURCHF Time Frame: M15 Recommendations Broker account with ECN and low spread Test it first to find out
Range Breakout Master is a comprehensive Expert Advisor designed to capture the full potential of range breakout and fakeout trading, one of the most reliable and widely used concepts in intraday technical trading. Built on transparent, rule-based logic with no martingale and no grid, it covers every aspect of breakout and fakeout trading - from range formation and entry logic through trade management and risk control. Its high versatility and large number of customizable inputs make it adaptab
Chỉ báo này sẽ thông báo cho bạn nếu cấu hình xu hướng thành công. Tín hiệu theo xu hướng không nên được tăng theo, nhưng tín hiệu mua ở mức giá thấp theo mô hình giao dịch thông thường của bạn, hoặc tín hiệu bán ở mức giá tốt, là một lựa chọn rất tốt. Hãy thiết lập nó trên khung thời gian lớn hơn và theo dõi các khung thời gian nhỏ hơn, bám sát các xu hướng chính. Tôi thường thiết lập ba khung thời gian gần nhau nhất và không bao giờ đi ngược tín hiệu của INdicator này. INdicator   này không có
Classic SNR MetaTrader 5 Expert Advisor | Multi-Symbol Support & Resistance Trading with Trend-Based Logic Overview Classic SNR Breakout EA is a professional trading robot that identifies structural Support & Resistance levels using daily swing points and executes trades based on H1 price action relative to these levels. The EA applies   dual logic : in an uptrend, it sells on H1 rejection below an SNR level; in a downtrend, it buys on H1 rejection above an SNR level. Breakout confirmations are
Price Magnet — Price Density and Attraction Levels Indicator Price Magnet is a professional analytical tool designed to identify key support and resistance levels based on statistical Price Density. The indicator analyzes a specified historical period and detects price levels where the market spent the most time. These zones act as “magnets,” attracting price action or forming a structural base for potential reversals. Unlike traditional Volume Profile tools, Price Magnet focuses on price-time d
Tma Poc Gold
Ignacio Agustin Mene Franco
POC + TMA SCALPER GOLD - Expert Advisor Professional DESCRIPTION: Automated trading system designed specifically for XAU/USD, combining Point of Control (POC) with Triangular Moving Average (TMA) to identify high-volume and trending zones. It uses advanced risk management with dynamic trailing stops and an intelligent grid system. TECHNICA
The Riko Trend indicator is a revolutionary trend trading and filtering solution with all the important features of a trend tool built into one tool! The Riko Trend indicator is good for any trader, suitable for any trader for both forex and binary options. You don’t need to configure anything, everything is perfected by time and experience, it works great during a flat and in a trend. The Riko Trend indicator is a technical analysis tool for financial markets that reflects the current price f
Gli utenti di questo prodotto hanno anche acquistato
ARIPoint
Temirlan Kdyrkhan
1 (1)
ARIPoint is a powerful trading companion designed to generate high-probability entry signals with dynamic TP/SL/DP levels based on volatility. Built-in performance tracking shows win/loss stats, PP1/PP2 hits, and success rates all updated live. Key Features: Buy/Sell signals with adaptive volatility bands Real-time TP/SL/DP levels based on ATR Built-in MA Filter with optional ATR/StdDev volatility Performance stats panel (Success, Profit/Loss, PP1/PP2) Alerts via popup, sound, push, or email Cu
SuperScalp Pro
Van Minh Nguyen
4.57 (21)
SuperScalp Pro – Sistema avanzato di indicatore scalping multi-filtro SuperScalp Pro è un indicatore di scalping avanzato che combina il classico Supertrend con molteplici filtri intelligenti di conferma per aiutare a identificare opportunità di trading. Funziona in modo efficiente su diversi timeframe da M1 a H4, con prestazioni ottimizzate su XAUUSD, BTCUSD e principali coppie Forex. L’indicatore fornisce chiari segnali Buy e Sell, insieme a livelli di ingresso, stop loss e take profit calcola
Divergence Bomber
Ihor Otkydach
4.9 (86)
Ogni acquirente dell’indicatore riceverà inoltre gratuitamente: L’utilità esclusiva “Bomber Utility”, che gestisce automaticamente ogni operazione, imposta i livelli di Stop Loss e Take Profit e chiude le posizioni secondo le regole della strategia I file di configurazione (set file) per adattare l’indicatore a diversi asset I set file per configurare il Bomber Utility in tre modalità: “Rischio Minimo”, “Rischio Bilanciato” e “Strategia di Attesa” Una guida video passo-passo per installare, conf
Entry In The Zone and SMC Multi Timeframe is a real-time 2-in-1 market analysis tool that combines market structure analysis and a No Repaint BUY / SELL signal system into a single indicator, built on Smart Money Concepts (SMC) — a widely adopted framework used by professional traders to understand market structure. This indicator helps you see the market more clearly, make decisions based on structure rather than guesswork, and focus on high-probability zones where price is more likely to react
Quantum TrendPulse
Bogdan Ion Puscasu
5 (23)
Ecco   Quantum TrendPulse   , lo strumento di trading definitivo che combina la potenza di   SuperTrend   ,   RSI   e   Stocastico   in un unico indicatore completo per massimizzare il tuo potenziale di trading. Progettato per i trader che cercano precisione ed efficienza, questo indicatore ti aiuta a identificare con sicurezza le tendenze di mercato, i cambiamenti di momentum e i punti di entrata e uscita ottimali. Caratteristiche principali: Integrazione SuperTrend:   segui facilmente l'andame
Power Candles MT5
Daniel Stein
4.75 (8)
Power Candles – Segnali di ingresso basati sulla forza per tutti i mercati Power Candles porta l’analisi di forza collaudata di Stein Investments direttamente sul grafico dei prezzi. Invece di reagire solo al prezzo, ogni candela viene colorata in base alla reale forza di mercato, consentendo di identificare immediatamente accumuli di momentum, accelerazioni della forza e transizioni di trend pulite. Un’unica logica per tutti i mercati Power Candles funziona automaticamente su tutti i simboli di
Se acquisti questo indicatore, riceverai il mio Trade Manager Professionale + EA  GRATUITAMENTE. Innanzitutto è importante sottolineare che questo sistema di trading è un indicatore Non-Repainting, Non-Redrawing e Non-Lagging, il che lo rende ideale sia per il trading manuale che per quello automatico. Corso online, manuale e download di preset. Il "Sistema di Trading Smart Trend MT5" è una soluzione completa pensata sia per i trader principianti che per quelli esperti. Combina oltre 10 indicat
Gann Made Easy è un sistema di trading Forex professionale e facile da usare che si basa sui migliori principi del trading utilizzando la teoria di mr. WD Gann. L'indicatore fornisce segnali ACQUISTA e VENDI accurati, inclusi i livelli di Stop Loss e Take Profit. Puoi fare trading anche in movimento utilizzando le notifiche PUSH. CONTATTAMI DOPO L'ACQUISTO PER RICEVERE GRATUITAMENTE LE ISTRUZIONI DI TRADING E OTTIMI INDICATORI EXTRA! Probabilmente hai già sentito parlare molte volte dei metodi d
Azimuth Pro
Ottaviano De Cicco
5 (6)
Azimuth Pro V2: Synthetic Fractal Structure and Confirmed Entries for MT5 Overview Azimuth Pro is a multi-level swing structure indicator by Merkava Labs . Four nested swing layers, swing-anchored VWAP, ABC pattern detection, three-timeframe structural filtering, and closed-bar confirmed entries — one chart, one workflow from micro-swings to macro-cycles. This is not a blind signal product. It is a structure-first workflow for traders who care about location, context, and timing. V2 Launch Offe
OmniSync Projection
Antonio-alin Teculescu
5 (1)
Chronos Fractal Engine is an innovative price projection indicator for MetaTrader 5, designed to transform your technical analysis by intelligently identifying and projecting historical price patterns. Built upon an advanced correlation algorithm and the fractal principles of the market, this powerful tool visualizes potential future price movements, giving you a unique edge in your trading decisions. What is Chronos Fractal Engine? At its core, the Chronos Fractal Engine employs a sophisticat
FX Trend MT5 NG
Daniel Stein
5 (4)
FX Trend NG: La Nuova Generazione di Intelligenza di Trend Multi-Mercato Panoramica FX Trend NG è uno strumento professionale di analisi del trend multi-timeframe e monitoraggio dei mercati. Ti consente di comprendere la struttura completa del mercato in pochi secondi. Invece di passare tra numerosi grafici, puoi identificare immediatamente quali strumenti sono in trend, dove il momentum sta diminuendo e dove esiste un forte allineamento tra i timeframe. Offerta di Lancio – Ottieni FX Trend NG
Trend Screener Pro MT5
STE S.S.COMPANY
4.85 (104)
Indicatore di tendenza, soluzione unica rivoluzionaria per il trading di tendenze e il filtraggio con tutte le importanti funzionalità di tendenza integrate in un unico strumento! È un indicatore multi-timeframe e multi-valuta al 100% non ridipingibile che può essere utilizzato su tutti i simboli/strumenti: forex, materie prime, criptovalute, indici e azioni. Trend Screener è un indicatore di tendenza che segue un indicatore efficiente che fornisce segnali di tendenza a freccia con punti nel gra
Grabber System MT5
Ihor Otkydach
4.83 (23)
Ti presento un eccellente indicatore tecnico: Grabber, che funziona come una strategia di trading "tutto incluso", pronta all’uso. In un solo codice sono integrati strumenti potenti per l’analisi tecnica del mercato, segnali di trading (frecce), funzioni di allerta e notifiche push. Ogni acquirente di questo indicatore riceve anche gratuitamente: L’utility Grabber: per la gestione automatica degli ordini aperti Video tutorial passo dopo passo: per imparare a installare, configurare e utilizzare
Cominciamo con la verità. Nessun indicatore da solo ti renderà profittevole. Se qualcuno ti dice il contrario, ti sta vendendo un sogno. Qualsiasi indicatore che mostra frecce perfette di acquisto/vendita può essere reso impeccabile — basta ingrandire la giusta sezione della storia e catturare solo i trade vincenti. Noi non lo facciamo.  SMC Intraday Formula è uno strumento. Legge la struttura del mercato per te, identifica le zone a più alta probabilità e ti mostra esattamente come appare la t
Scopri quale strategia funziona davvero sul tuo simbolo - prima di rischiare denaro reale. Power Bar rileva le barre di prezzo estreme su qualsiasi simbolo e qualsiasi timeframe, poi esegue istantaneamente il backtest di 3 diverse strategie di trading per confrontare tassi di vincita, fattori di profitto e P&L fianco a fianco. Tutto in un unico pannello interattivo. Niente supposizioni. Niente curve-fitting. Solo dati. Cosa rende Power Bar unico? La maggior parte degli indicatori fornisce un se
CGE Trading Suite
Carl Gustav Johan Ekstrom
5 (2)
Institutional-Grade Analytics for MT5 C GE Trading Suite delivers the analytical edge typically reserved for professional trading desks. The platform integrates a full suite of analytical tools into one seamless workflow: dynamic grid mapping, liquidity behavior analysis, ECM, trend lines, MIDAS, trade cycles, and directional channel projections. Together, these provide a unified view of market structure and momentum. Directional clarity is further enhanced by the capital flow index, which meas
SignalTech MT5 is a trading system for EURUSD, USDCHF, USDJPY, AUDUSD, NZDUSD, EURJPY, AUDJPY, NZDJPY, CADJPY H2 and H3 Timeframe.  It can generate signals with Buy/Sell Arrows and Pop-Up/Sound Alerts. Each signal has clear Entry and Stop Loss levels, which should be automatically flagged on the chart, as well as potential Targets 1, 2, and 3. The Entry and TP levels are fixed after the trade is taken. The exit level is dynamic. If there are signs of a potential short-term trend reversal, the
Atomic Analyst MT5
Issam Kassas
3.94 (31)
Innanzitutto, vale la pena sottolineare che questo indicatore di trading non è repaint, non è ridisegno e non presenta ritardi, il che lo rende ideale sia per il trading manuale che per quello automatico. Manuale utente: impostazioni, input e strategia. L'Analista Atomico è un indicatore di azione del prezzo PA che utilizza la forza e il momentum del prezzo per trovare un miglior vantaggio sul mercato. Dotato di filtri avanzati che aiutano a rimuovere rumori e segnali falsi, e aumentare il pote
FX Power MT5 NG
Daniel Stein
5 (31)
FX Power: Analizza la Forza delle Valute per Decisioni di Trading Più Intelligenti Panoramica FX Power è lo strumento essenziale per comprendere la reale forza delle principali valute e dell'oro in qualsiasi condizione di mercato. Identificando le valute forti da comprare e quelle deboli da vendere, FX Power semplifica le decisioni di trading e rivela opportunità ad alta probabilità. Che tu segua le tendenze o anticipi inversioni utilizzando valori estremi di Delta, questo strumento si adatta
Btmm state engine pro
Garry James Goodchild
5 (4)
BTMM State Engine Pro is a MetaTrader 5 indicator for traders who use the Beat The Market Maker approach: Asian session context, kill zone timing, level progression, peak formation detection, and a multi-pair scanner from a single chart. It combines cycle state logic with a built-in scanner dashboard so you do not need the same tool on many charts at once. What it does Draws the Asian session range; session times can follow broker server offset or be set in inputs. Tracks level progression (L
Presentazione       Quantum Breakout PRO   , l'innovativo indicatore MQL5 che sta trasformando il modo in cui scambi le zone di breakout! Sviluppato da un team di trader esperti con un'esperienza di trading di oltre 13 anni,       Quantum Breakout PRO       è progettato per spingere il tuo viaggio di trading a nuovi livelli con la sua strategia innovativa e dinamica della zona di breakout. Quantum Breakout Indicator ti fornirà frecce di segnalazione sulle zone di breakout con 5 zone target di
Bill Williams Advanced
Siarhei Vashchylka
5 (11)
Bill Williams Advanced is designed for automatic chart analysis using Bill Williams' "Profitunity" system. The indicator analyzes four timeframes at once. Manual (Be sure to read before purchasing) Advantages 1. Analyzes the chart using Bill Williams' "Profitunity" system. Signals are displayed in a table in the corner of the screen and on the price chart. 2. Finds all known AO and AC signals, as well as zone signals. Equipped with a trend filter based on the Alligator. 3. Finds "Divergence Bar
Berma Bands
Muhammad Elbermawi
5 (8)
L'indicatore Berma Bands (BBs) è uno strumento prezioso per i trader che cercano di identificare e capitalizzare i trend di mercato. Analizzando la relazione tra il prezzo e le BBs, i trader possono discernere se un mercato è in una fase di trend o di range. Visita il [ Berma Home Blog ] per saperne di più. Le Berma Bands sono composte da tre linee distinte: la Upper Berma Band, la Middle Berma Band e la Lower Berma Band. Queste linee sono tracciate attorno al prezzo, creando una rappresentazion
Auto Optimized Parabolic RSI: Motore di Momentum 3D Avanzato La maggior parte degli indicatori per trader privati fallisce perché si affida a parametri statici che smettono di funzionare nel momento in cui la volatilità del mercato cambia. Auto Optimized Parabolic RSI risolve il problema dell'"obsolescenza dell'indicatore" ricalcolando continuamente il proprio vantaggio matematico, portando un adattamento quantitativo di livello istituzionale direttamente sul tuo terminale MT5. Il Vantaggio Prin
Meridian Pro
Ottaviano De Cicco
5 (1)
Meridian Pro: Professional Multi-Timeframe Trend Matrix for MT5 Overview Meridian Pro is a multi-timeframe trend matrix by Merkava Labs that compresses directional state, strength, momentum condition and matrix agreement into one compact panel. One adaptive engine, applied consistently from M1 to W1. No per-symbol tuning. No indicator stacking. One structured readout across every asset and every timeframe. Launch Offer — Get Meridian Pro for USD 99 (introductory). Regular price: USD 149. 1. Why
Crystal Heikin Ashi Signals
Muhammad Jawad Shabir
5 (2)
Crystal Heikin Ashi Signals - Professional Trend & Signal Detection Indicator Advanced Heikin Ashi Visualization with Intelligent Signal System for Manual & Automated Trading Final Price: $149 ---------> Price goes up $10 after every 10 sales . Limited slots available — act fast . Overview Crystal Heikin Ashi Signals is a professional-grade MetaTrader 5 indicator that combines pure Heikin Ashi candle visualization with an advanced momentum-shift detection system. Designed for both manual traders
Market Structure Order Block Dashboard MT5 è un indicatore MT5 progettato per i trader che vogliono leggere la struttura di mercato e le principali aree di reazione del prezzo direttamente sul grafico. Combina BOS, ChoCH, Order Blocks, Fair Value Gaps (FVG), Liquidity, Kill Zones, Volume Profile e un dashboard compatto per un’analisi rapida. Questo indicatore è pensato per i trader che utilizzano la struttura di mercato, i concetti ICT e Smart Money come quadro decisionale. Può aiutare a identif
IX Power MT5
Daniel Stein
4.92 (13)
IX Power: Scopri approfondimenti di mercato per indici, materie prime, criptovalute e forex Panoramica IX Power è uno strumento versatile progettato per analizzare la forza di indici, materie prime, criptovalute e simboli forex. Mentre FX Power offre la massima precisione per le coppie di valute utilizzando i dati di tutte le coppie disponibili, IX Power si concentra esclusivamente sui dati di mercato del simbolo sottostante. Questo rende IX Power una scelta eccellente per mercati non correlat
ARICoins
Temirlan Kdyrkhan
ARICoin is a powerful trading companion designed to generate high-probability entry signals with dynamic TP/SL/DP levels based on volatility. Built-in performance tracking shows win/loss stats, PP1/PP2 hits, and success rates all updated live. Key Features: Buy/Sell signals with adaptive volatility bands Real-time TP/SL/DP levels based on ATR Built-in MA Filter with optional ATR/StdDev volatility Performance stats panel (Success, Profit/Loss, PP1/PP2) Alerts via popup, sound, push, or email Cust
Meravith Scanner
Ivan Stefanov
5 (1)
MERAVITH SCANNER è un indicatore professionale per i mercati finanziari su MetaTrader 5, che integra più strumenti di analisi in un unico sistema. Esegue tutti i calcoli automaticamente utilizzando una metodologia proprietaria basata sul prezzo medio ponderato per il volume (VWAP), eliminando completamente l’interpretazione soggettiva. L’indicatore funziona su tutte le classi di asset (Forex, Azioni, Indici, Commodities, Criptovalute) e su tutti i timeframe, da M1 a Mensile. Il principio fondame
Altri dall’autore
This product can be used to synchronize multiple Charts, and each Chart can be set to a different sync mode. With this product you can better view and manipulate charts: different time frames for a single Symbol, the same time frame for multiple Symbols... and more. PS: The link below is the FreeDemo product, you can use it on EURUSD/XUAUSD/USDCNH symbol: https://www.mql5.com/en/market/product/38557 Feature: Chart settings  can be synchronized, including : background, indentation, size, etc. M
This product can be used to synchronize multiple Charts, and each Chart can be set to a different sync mode. With this product you can better view and manipulate charts: different time frames for a single Symbol, the same time frame for multiple Symbols, system indicators for single/multiple Symbols... and more. Feature: Chart settings can be synchronized, including : background, indentation, size, etc. Multiple Chart window start times  or end times can be synchronized. Multiple Chart time fr
Have you ever take a long time to watch a Symbol when the network link is not good ? Have you ever wait for a long time when you switch chart between different Symbols or different TimeFrames ? If you do long-term backtesting , Have you ever to be downloaded datas for a long time ? Yes, If there is no data in the system, those will happen.  1. What is this: Download all the Symbol data in Market Watch to the system. PS: This is not outputting data to Files. This Link go to Demo version: https:/
Do you think it's a bit cumbersome when you need to switch symbols or timeframes with mouse click? 1. What is this? This is a program that can switch symbols and timeframes with direction keys. Fast switching, very convenient, no mouse click required. For traders, one symbol with multi-timeframe charts are usually added,  you can change symbol on those charts easily. For multi-currency traders, different symbol charts are usually added, you can also change those timeframes easily. I wrote this p
1. What is this         Rising volatility and falling volatility are not the same, whether it is academic research or actual testing has shown this point.         The original ATR indicator is calculated by putting up and down fluctuations together. This indicator is to calculate separately the upward volatility and the downward volatility, which can better help you study the market. 2. Indicator description          There are two modes for the calculation of this indicator, as shown in the fo
I see that many tools in the market deal with Position and Order in the form of operation panels. Which is loaded into a Chart in the form of an EA. However, once the operator panel EA is loaded, no other EAs can be loaded. So, I wrote the one-click operation of Position and Order as a script, so you can load other EAs and easily complete one-click operation of Trade. 1. What is this: This is a one-click script to close position order. Now you can close position tickets at high speed, for examp
I see that many tools in the market deal with Position and Order in the form of operation panels. Which is loaded into a Chart in the form of an EA. However, once the operator panel EA is loaded, no other EAs can be loaded. So, I wrote the one-click operation of Position and Order as a script, so you can load other EAs and easily complete one-click operation of Trade. 1. What is this: This is a one-click script to delete the pending order . Now you can delete pending tickets at high speed, for
Do you think it's a bit cumbersome when you need to switch symbols or timeframes with mouse click? 1. What is this? This is a program that can switch symbols and timeframes with direction keys. Fast switching, very convenient, no mouse click required. For traders, one symbol with multi-timeframe charts are usually added,  you can change symbol on those charts  easily . For multi-currency traders, different symbol charts are usually added, you can also change those timeframes easily. I wrote thi
According to trading experience: Some symbols are easy to reverse on certain days, such as Monday, or afternoon, and so on. So comparing the current price with the corresponding historical moment price is valuable. If the price coordinate system uses a logarithmic price, you will get a lot of valuable information. 1. What is this? This program can convert the symbol price and add it to your Chart. You can compare it with your major chart. The DEMO version Link: https://www.mql5.com/en/market/pr
What is this: Violent trading: means sending a large number of orders to your brokerage server,  it can conduct a stress test of the trading. In this program you can run a variety of trading tests.  Now you can trade at high speed, For example 1000 orders in an instant. The Demo version's link:  https://www.mql5.com/en/market/product/38431/ Why to use: Whether manual trading or EA trading,  the status of the broker server is very important. So it is beneficial to conduct a trading stress test on
1. Why did I develop this series of indicators I found that most traders need to use multiple time frame indicators. They usually switch time frame to see indicators. However, once the timeframe is switched, you cannot see the  corresponding relationship  between  the price in the smaller timeframe  and  the indicator in the larger timeframe . For example: if your price chart is in H1 timeframe, you can see H4, D1 and W1 indicators in H1 timeframe Chart. This is more helpful for you to find th
Filtro:
Аврора
96
Аврора 2021.08.31 11:01 
 

L'utente non ha lasciato alcun commento sulla valutazione.

Rispondi alla recensione