DYJ TradingView
- 지표
-
Daying Cao
 Hello!
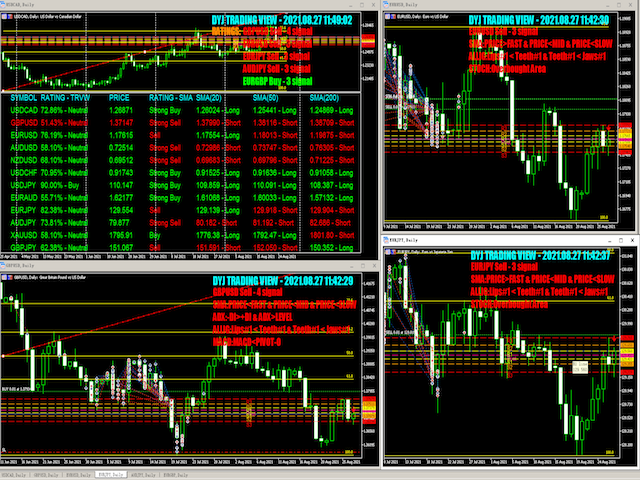
I am a software engineer has been developing for many years.have their own unique trading system, has a wealth of EA trading experience. The main currency is EUR/USD, GBP/USD. USD/JPY,AUD/USD , USD/CAD, gold, EUR/NZD cross currency. - 버전: 2.6
- 업데이트됨: 18 9월 2021
- 활성화: 5
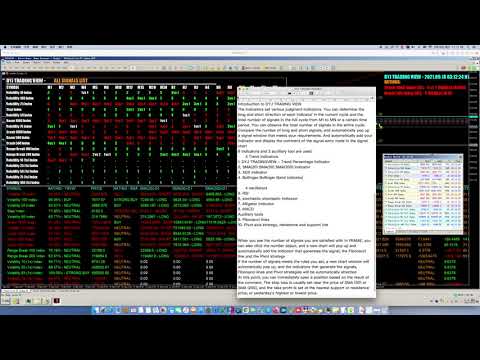
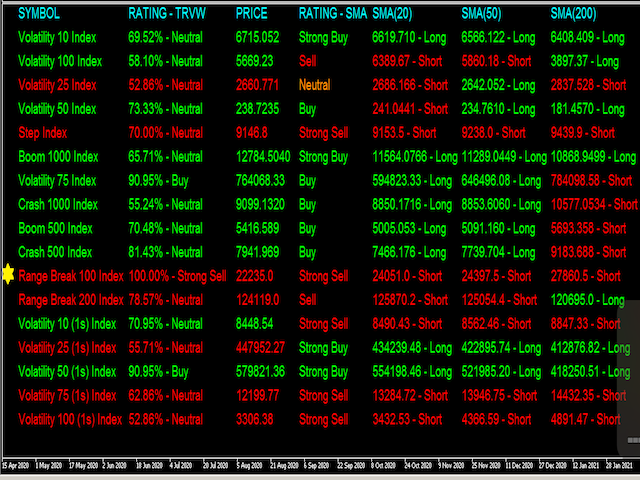
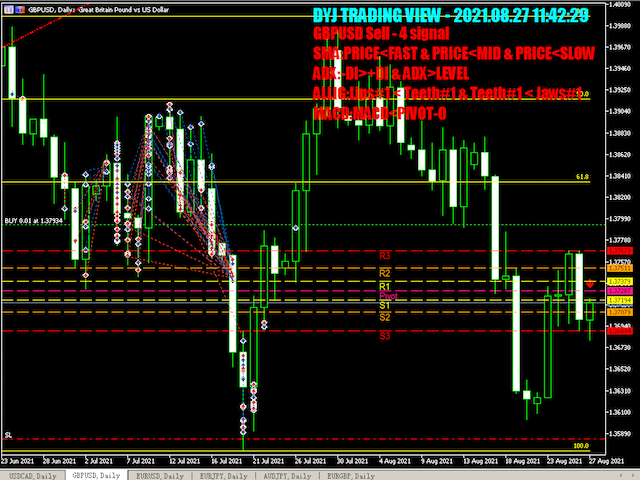
DYJ TRADINGVIEW는 등급 신호 카운트 및 분석 도구를 사용하여 글로벌 시장에서 진입 기회를 찾는 다중 지표 등급 시스템입니다.
DYJ TRADINGVIEW에는 시장 분석을 위한 10가지 내장 지표가 있습니다.
지표 기반 분석은 많은 거래자가 수행할 거래와 거래를 시작하고 종료할 위치에 대한 결정을 내리는 데 사용합니다.
우리는 서로를 잘 보완할 수 있는 몇 가지 다른 유형을 사용합니다.
귀하의 시장을 추적하기 위해 저희를 사용하십시오. 더 정확한 거래를 찾을 수 있습니다.
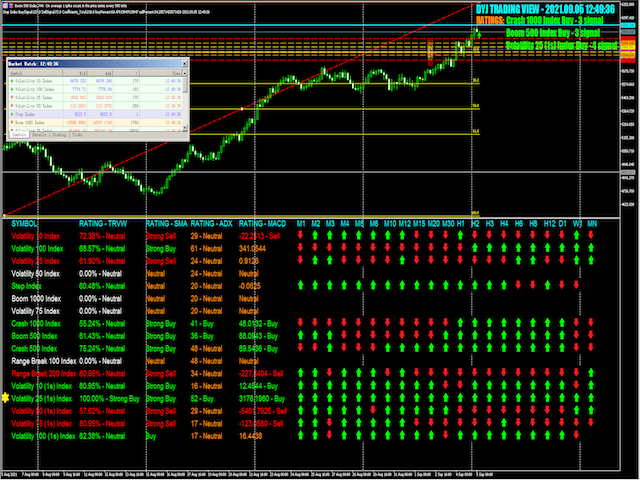
등급에 참여하는 추세 지표에는 DYJ POWERSIGNAL, ADX, SMA, 볼린저 밴드가 있습니다.
등급에 참여하는 오실레이터에는 MACD, RSI, Stochastic, Alligator가 있습니다.
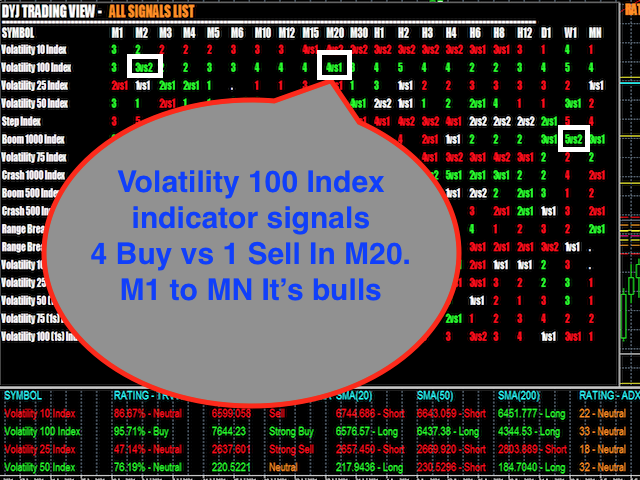
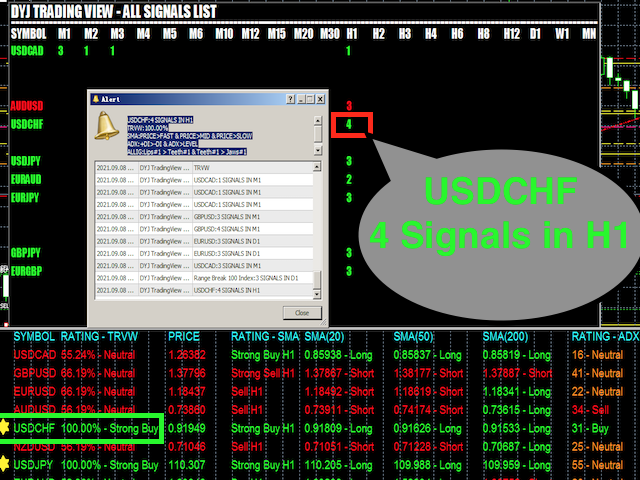
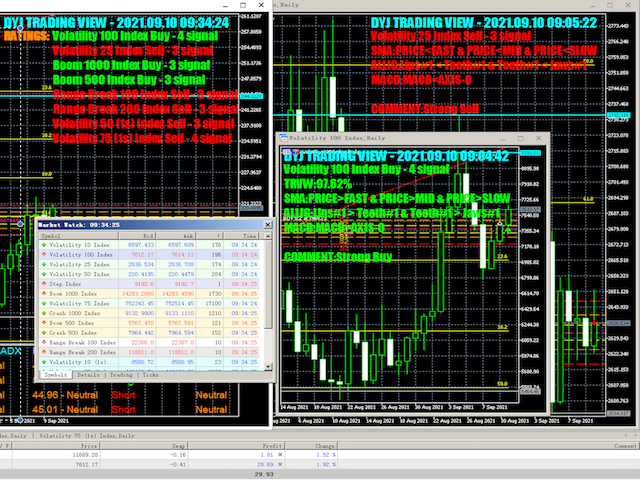
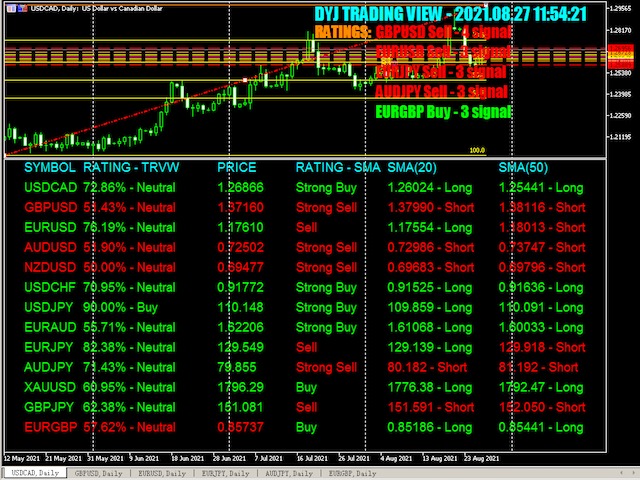
시그널의 개수가 3개 이상일 때 시그널을 매수 또는 매도하는 동일한 방향을 나타내는 3개의 지표가 있을 때 시장 거래에 진입하기 시작합니다.
입력
[일반]
ViewName = "DYJ TRADING VIEW" --> 회사 이름.
InpIsDisplayPrice = true --> 표시 가격.
InpPriceShiftBars = 1 --> 가격 이동 막대
InpMaxTrends = 3 --> 신호가 InpMaxTrends, 등급 기호보다 큽니다.
[트레이딩뷰]
InpPowerSignalMinPercent = 90 --> TradeingView 최소 백분율
InpPowerSignalStrongPercent = 100 --> TradeingView 강한 백분율
InpPowerSignalMaxPercent = 100 --> TradeingView 최대 백분율
InpHiddenPeriodTrend = false --> M1에서 MN으로 숨기기
[양초]
InpUseCandle = true --> 촛불을 사용합니다.
InpEntryUpper = 33 --> 다중 스프레드, 항목 구매입니다.
InpEntryLower = 33 --> 다중 스프레드, 항목 판매입니다.
[엄마]
InpUseMA=참;
InpIsDisplayFastMA=true --> DisplayFastMA
InpIsDisplayMidMA=true --> MidMA 표시
InpIsDisplaySlowMA=true --> SlowMA 표시
InpMAFastPeriod=20 --> 빠른 기간
InpMAMidPeriod=50 --> 중간 기간
InpMASlowPeriod=200 --> 느린 기간
[ADX]
InpUseAdx=true --> ADX 사용
InpIsDisplayPlusdi=거짓; --> 디스플레이 ADX Plusdi
InpIsDisplayMinusdi=false --> ADX Minusdi 표시
InpAdxPeriod = 14 -- ADX: 평균 기간
InpTrendLevel = 30 -- ADX: 추세 수준
[RSI]
InpUseRsi =true --> RSI 사용
InpRSIPeriod = 14 --> RSI 기간
InpRsiOversold = 30 --> R si 과매도
InpRsi과매수 = 70 --> Rsi 과매수
[볼린저]
InpUseBollinger = true --> 볼린저 사용
InpIsDisplayUpper=참
InpIsDisplaylower=true
Inp_Bands_bands_period = 20 -- 볼린저 밴드 기간
Inp_Bands_deviation = 2 -- 볼린저 밴드 편차
InpBandDistance = 50 -- BandDistance(포인트 단위)
[맥디]
InpUseMACD = true --> MACD 사용
InpIsDisplayMacdSignal=false --> MacdSignal 표시
InpMacdFast = 12 --> MacdFast
InpMacdSlow = 26 --> MacdSlow
InpMacdSignal = 9 --> MacdSignal
InpMacdPriceField = PRICE_CLOSE --> macd 계산 방법
InpMACDOpenLevel = 3 --> MACD 개방 레벨
InpMACDCCloseLevel = 2 --> MACD 닫기 수준
[MACD MA 트렌드]
InpMacdMA = 26 --> MA 기간
InpMacdMAMethod = MODE_EMA --> 스무딩 macdma 유형
InpMacdMAPriceField = PRICE_CLOSE --> macd 계산 방식
[확률]
InpUseStochastic = true --> 확률 사용
InpSTOK 기간 = 5 --> K-기간
InpSTODperiod = 3 --> D-기간
InpSTOSlowing = 3 --> 감속 기간
InpSTOMaMethod = MODE_EMA --> 확률적 평활화 유형
InpSTOPriceField = STO_LOWHIGH --> 확률적 계산 방법
InpOversoldArea = 20 --> 재고 과매도 영역
InpOverboughtArea = 80 --> 스토치 과매수 영역
[악어]
Inp_jaw_period = 13 --> 죠 계산 기간
Inp_jaw_shift = 8 --> 턱의 수평 이동
Inp_teeth_period = 8 --> 치아 계산 기간
Inp_teeth_shift = 5 --> 치아의 수평 이동
Inp_lips_period = 5 --> 입술 계산 기간
Inp_lips_shift = 3 --> 입술의 수평 이동
Inp_ma_method = MODE_EMA --> 스무딩 유형
Inp_applied_price = PRICE_MEDIAN --> 가격 유형
[피벗]
InpUsePivot = 참;
InpCalculationMode = FIBONACCI_RETRACEMENT --> FIBONACCI RETRACEMENT
[피보나치]
InpUse피보나치 = true;
InpFibDate1=1 --> 첫 번째 포인트의 날짜, %
InpFibPrice1=1 --> 첫 번째 포인트 가격, %
InpFibDate2=100 --> 두 번째 포인트의 날짜, %
InpFibPrice2=100 --> 두 번째 포인트 가격, %
[패널]
InpLanguage = 영어 --> 영어 또는 중국어

I highly recommended Dyj global for their products and customer's services. I sincerely think they are the best in the industry they will go above an beyond to make sure you get the best trading results. I have been using this service for approximately one year.