PZ Correlation
- 지표
- 버전: 2.2
- 업데이트됨: 21 10월 2020

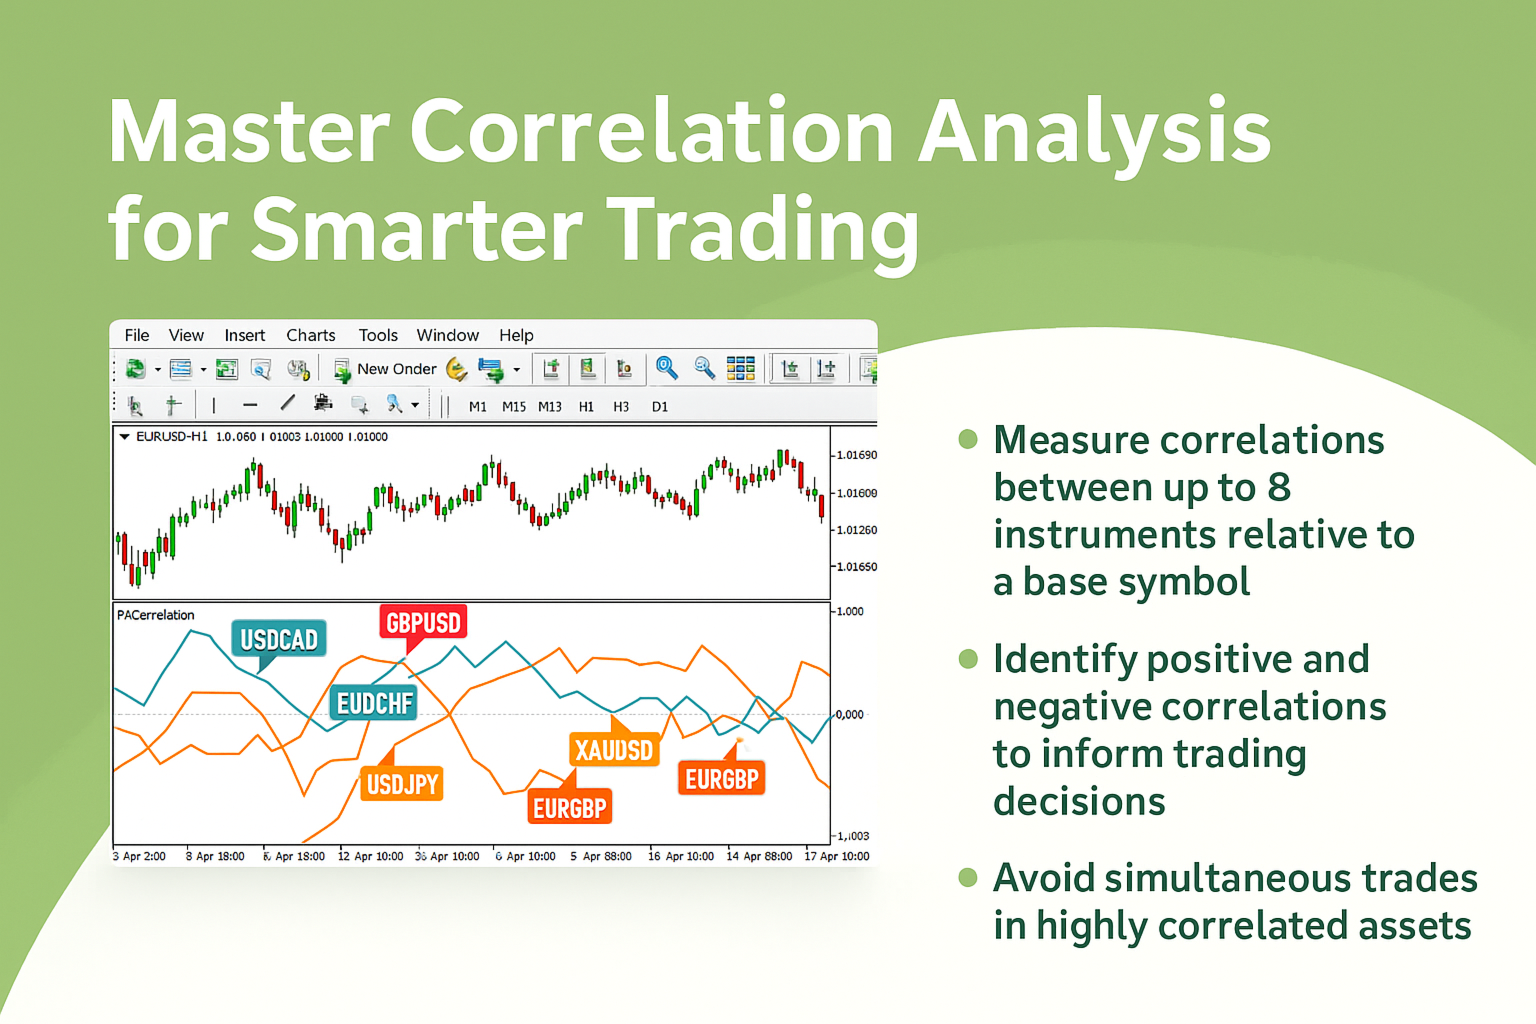
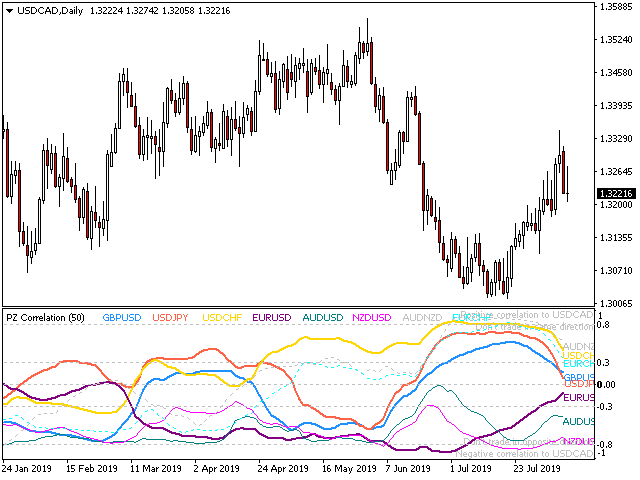
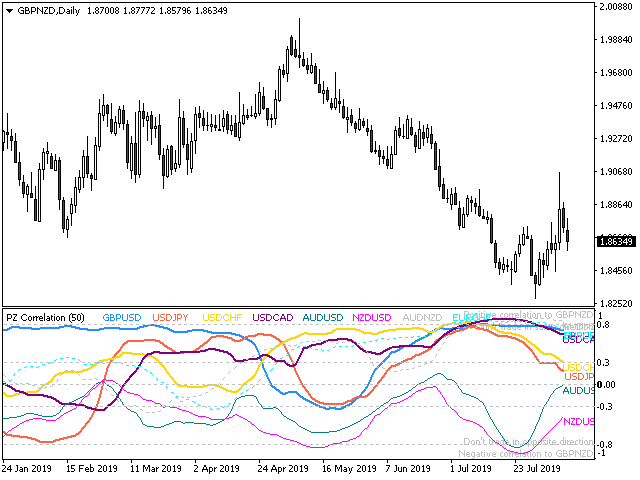
In the world of finance, correlation is a statistical measure of how two securities move in relation to each other. Correlations are used in advanced portfolio management. This indicator measures how different securities move in relation to a reference one, thus making portfolio management easier.
[ Installation Guide | Update Guide | Troubleshooting | FAQ | All Products | 👉 Get Help ]
- Avoid concurrent trades in highly correlated instruments
- Find trading opportunities among highly correlated instruments
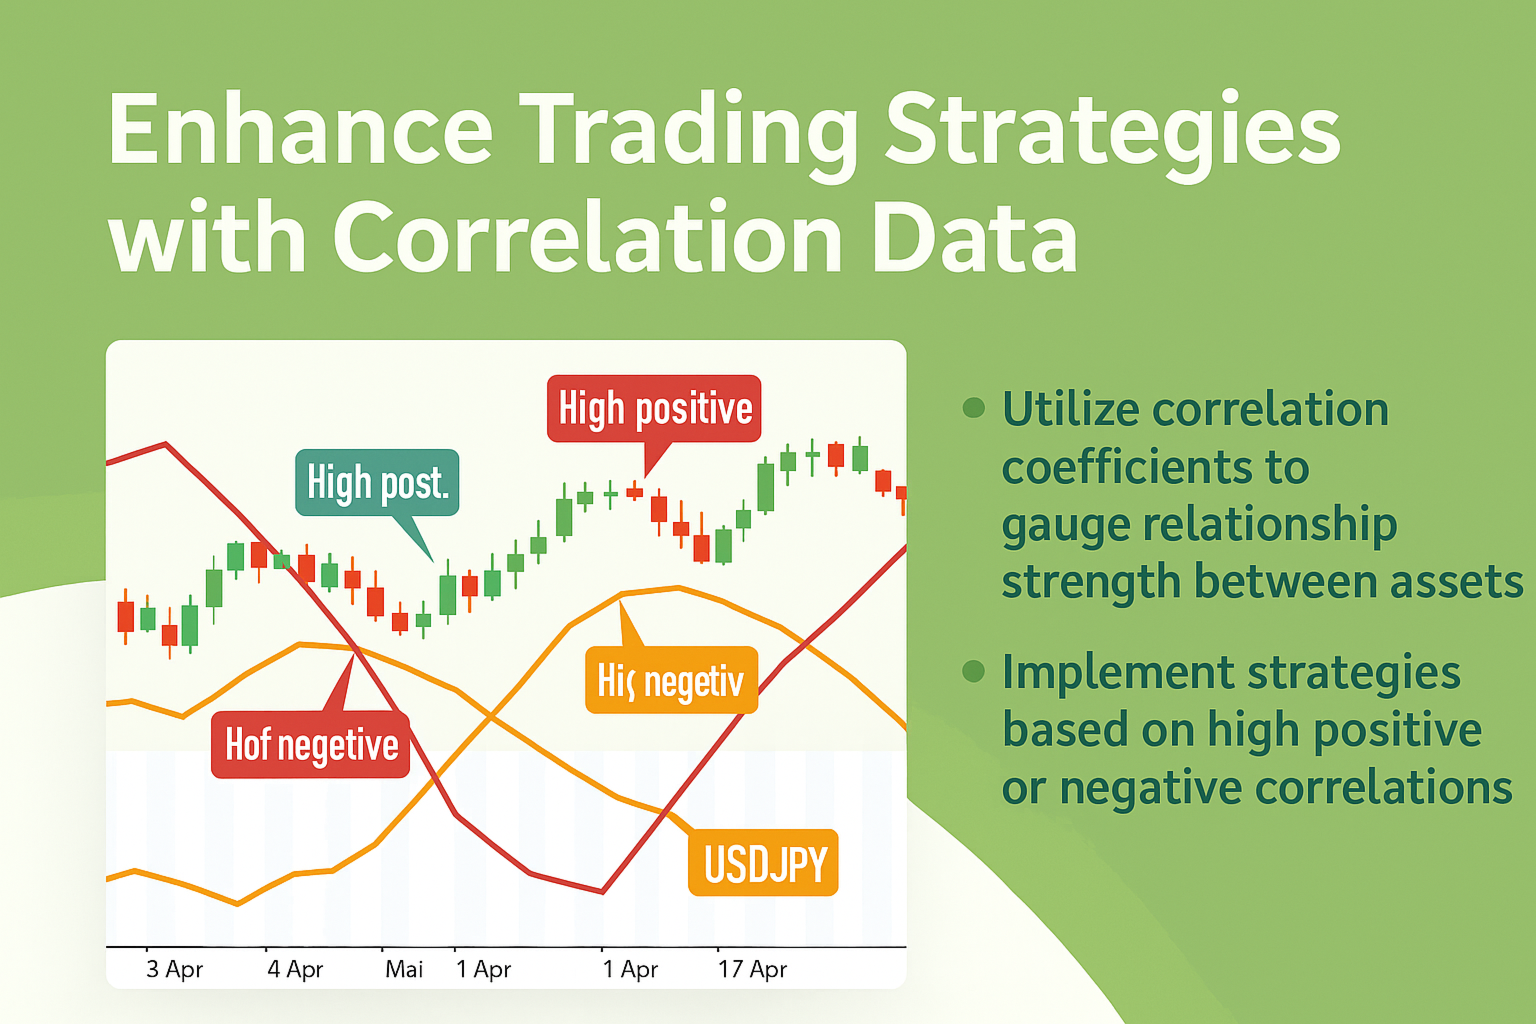
- Correlation is positive when two securities rise in price together
- Correlation is negative when one security increases and the other decreases
The correlation between two securities is measured by a correlation coefficient.
- A coefficient of zero is neutral correlation
- A coefficient of 0.3 is low positive correlation
- A coefficient over 0.8 is high positive correlation
- A coefficient of -0.3 is low negative correlation
- A coefficient over -0.8 is high negative correlation
The correlation is calculated against the native symbol of the chart, and the symbols to evaluate are entered as parameters.
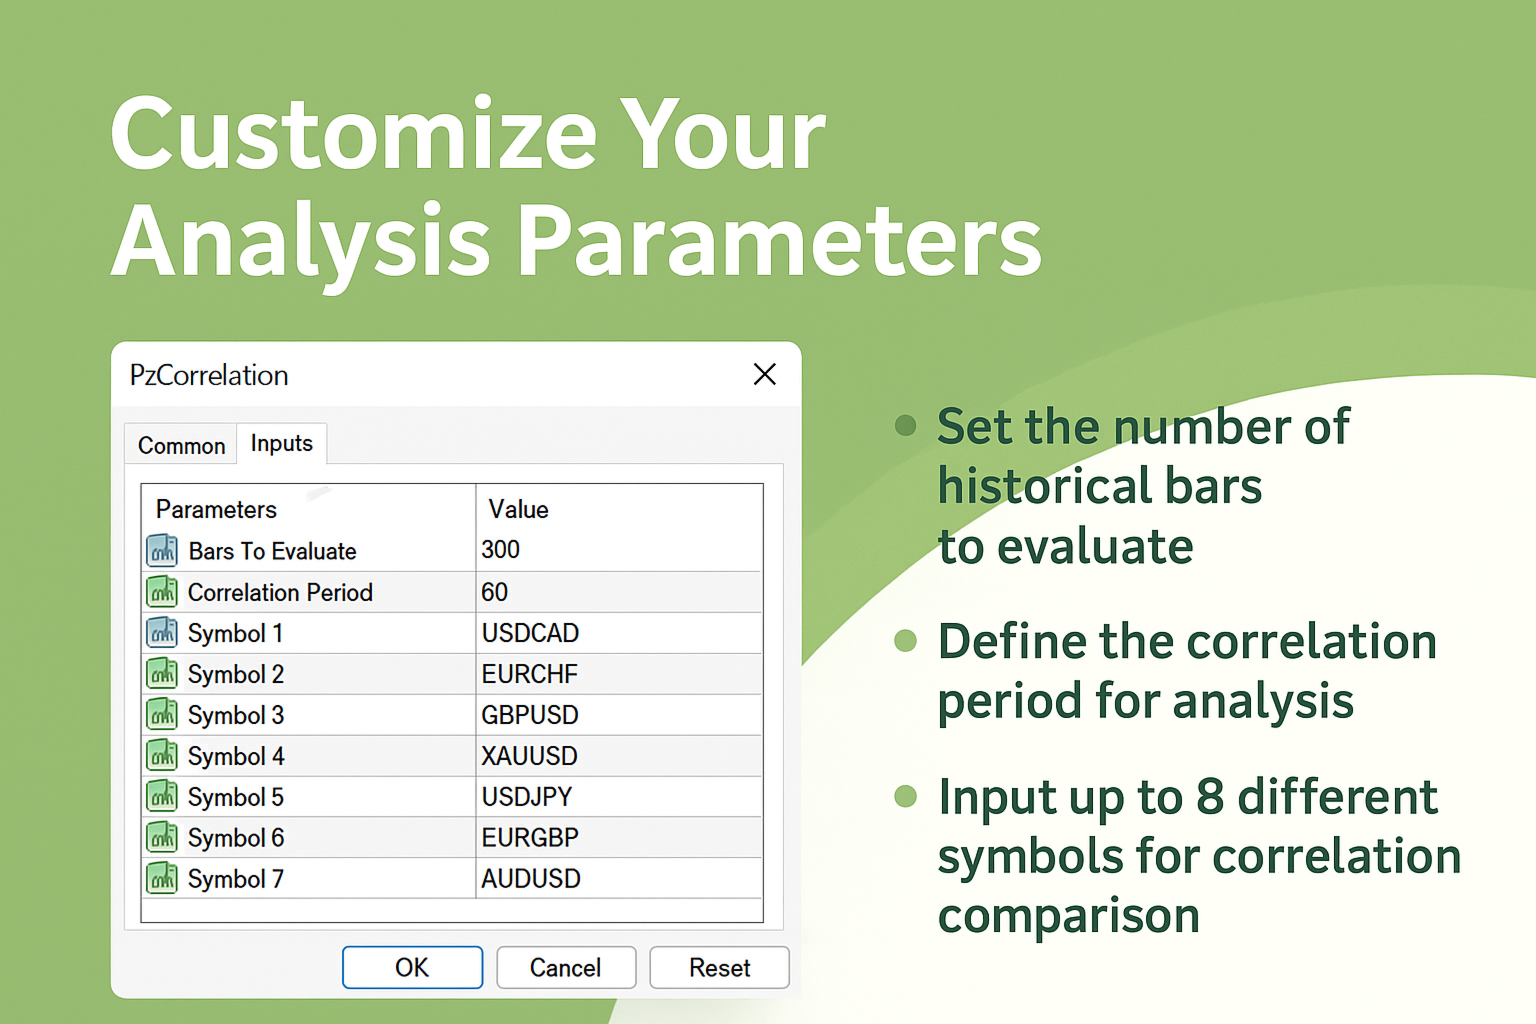
Input Parameters
- Max History Bars: Amunt of bars to evaluate to the past upon loading.
- Correlation Period: Amount of bars to use to calculate the correlation.
- 1st Symbol to 8th Symbol: Enter the symbols to calculate the correlation.
Author
Arturo López Pérez, private investor and speculator, software engineer and founder of Point Zero Trading Solutions.
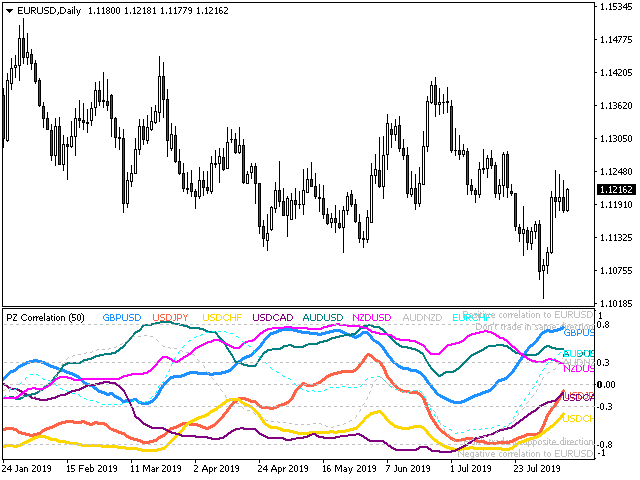


Индикатор PZ correlation представляет информацию о корреляциях между валютными парами во времени в графическом виде, что позволяет мгновенно оценить ситуацию. Спасибо автору, вещь хорошая.