keryit: Очень не хватает сжатия графика,
планируется? чтобы на м5 хотя бы день, а лучше два помещались
Здравствуйте.
Масштаб кластерного графика по горизонтали можно изменять штатным способом, с помощью кнопок терминала "+" и "-".
Кроме того, в настройках индикатора есть входная переменная FramesInitWidth, которая задаёт ширину фрейма.
Ширина фрейма задаётся в пикселях монитора, а заданное значение является инициирующим относительно самого мелкого масштаба по горизонтали.
Чтобы на М5 в окне графика помещался хотя бы один целый день (сутки), там потребуется разместить 288 свечей, имеется ввиду кластерных фреймов
от этих свечей.
При разрешении монитора, например Full HD (1920х1080), разместить такое количество фреймов в пределах видимой области окна графика
просто невозможно.
А если даже попытаться сделать это насильственно (должен сказать, что входная переменная FramesInitWidth ограничена снизу, и не может
принимать значение меньше 30), то в результате там просто невозможно будет что-либо по кластерам разглядеть.
Масштаб кластерного графика по горизонтали можно изменять штатным способом, с помощью кнопок терминала "+" и "-".
Кроме того, в настройках индикатора есть входная переменная FramesInitWidth, которая задаёт ширину фрейма.
Ширина фрейма задаётся в пикселях монитора, а заданное значение является инициирующим относительно самого мелкого масштаба по
горизонтали.
Чтобы на М5 в окне графика помещался хотя бы один целый день (сутки), там потребуется разместить 288 свечей, имеется ввиду кластерных
фреймов от этих свечей.
При разрешении монитора, например Full HD (1920х1080), разместить такое количество фреймов в пределах видимой области окна графика
просто невозможно.
А если даже попытаться сделать это насильственно (должен сказать, что входная переменная FramesInitWidth ограничена снизу, и не
может принимать значение меньше 30), то в результате там просто невозможно будет что-либо по кластерам разглядеть.
У меня фрейм вообще отключен, такой масштаб нужен для общей картины, чтобы видеть интересные области, а уже по надобности
увеличить,чтобы кластера видеть
У меня фрейм вообще отключен, такой масштаб нужен для общей картины, чтобы видеть интересные области, а уже по надобности
увеличить,чтобы кластера видеть
а хочу видеть так, 4 дня например хорошо видно
Что-то мы видимо друг друга не понимаем.
Для начала тогда попытаюсь объяснить принцип работы индикатора:
Как только Вы устанавливаете этот индикатор на график, то данное окно графика уже прекращает быть свечным и превращается в кластерное.
То есть, индикатор полностью подменяет собой всё, что ранее находилось в этом окне, а также подстраивает по собственному усмотрению
размеры окна по вертикали и по горизонтали.
И главная функция индикатора заключается в том, чтобы взять некое количество свечей (обычного графика), заглянуть внутрь каждой этой
свечи, вычислить кластерное представление, и соответственно уже отобразить.
Для наглядности я приложил картинку.
На картинке два окна графика, оба Н1, слева кластерное (там установлен индикатор), а справа обычное.
В правом окне серым прямоугольником обозначена область, которая охватывает 12 штук свечей Н1.
А в левом окне мы видим те же самые 12 штук Н1 свечей, но только в их кластерном представлении.
На этой картинке тоже самое, но в меньшем масштабе, здесь помещается уже 25 свечей.
А здесь уже М5, тоже в меньшем масштабе, и этот масштаб самый мелкий, мельче просто некуда, иначе там уже будет ничего по кластерам не
разглядеть.
Сейчас там помещается 25 штук М5 свечей, а если бы окно было развёрнуто во всю ширину, то поместилось бы наверное 40 свечей, то есть в пересчёте по
М5 это будет всего лишь 200 минут.
И разместить там, в пределах даже развёрнутого окна, 288 свечей М5 (полные сутки), ну просто невозможно.
я имею ввиду вот так , чтобы масштабировалось предельно,и уже
когда есть необходимость посмотреть в кластера, тогда и увеличивать Сейчас же приходится открывать разные окна, на одном картина полная-
уровни, эти же уровни нужно скопировать на график с кластерами...
я имею ввиду вот так , чтобы масштабировалось предельно,и
уже когда есть необходимость посмотреть в кластера, тогда и увеличивать Сейчас же приходится открывать разные окна, на одном картина
полная- уровни, эти же уровни нужно скопировать на график с кластерами...
Если это возможно, очень жду такой фичи :)
А, я понял.
Такая фишка существует также и в некоторых терминалах объёмного анализа.
Когда кластерный график при каком-то критически мелком масштабе превращается в свечной график.
Нет, этот индикатор так масштабировать не умеет, и это изначально не задумывалось, и вряд-ли уже будет (но, я подумаю над этим).
Этот индикатор изначально задумывался как предельно простой, недорогой, но в то же время выполняющий основную функцию, рисование
кластерами.
я имею ввиду вот так , чтобы масштабировалось предельно,и
уже когда есть необходимость посмотреть в кластера, тогда и увеличивать Сейчас же приходится открывать разные окна, на одном картина
полная- уровни, эти же уровни нужно скопировать на график с кластерами...
Если это возможно, очень жду такой фичи :)
Сделал, пробуйте.
И рекомендую почитать вкладку "Что нового" для версии 1.8.
Я использую переводчик, поэтому я надеюсь, что вы понимаете. Спасибо.
Я купил индикатор, думая, что он поможет, но из-за масштабирования с моим монитором он делает его бесполезным для моего типа анализа. Поэтому мне было интересно, если вы можете запрограммировать диаграмму или экспортировать в Google Sheets или Excel Sheets, что я делаю вручную? Я наблюдаю общий объем торгов, предоставленный брокером на 10, 5 или 1 минутных таймфреймах. По мере изменения объема я обновляю цену. Я начинаю с того, что такое ночной профиль громкости, а затем просто сижу и обновляюсь. Я включил изображение того, как это выглядит в Google Sheets.
Я использую MT5 от AmpTrading, и мое соединение для передачи данных - CQG. В настоящее время я обновляю объем для США 10 лет и США 30 лет.
Спасибо за уделенное время.
С уважением,
отметка
Hello.
Thank you for your purchase.
I think it would be better if I answered in English.
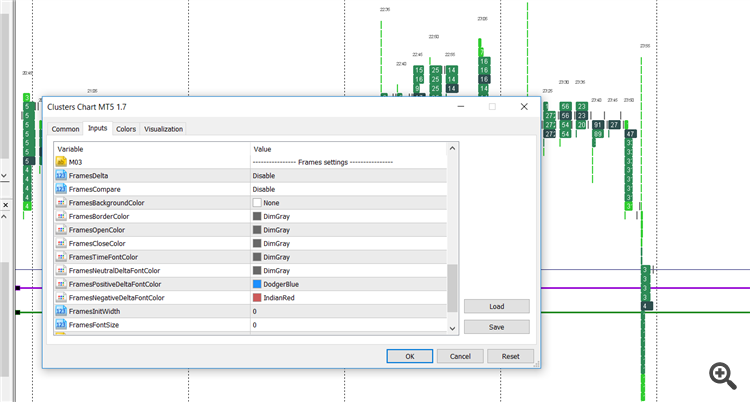
If you have problems scaling horizontally (for example, the number of profiles in the chart window is too large or too small), you can use the input variable FramesInitScale.
If you have problems scaling vertically (for example, the cluster thickness is too small or too large), you can use the input variable StepPoint to set the cluster thickness. By default, the cluster thickness is determined automatically, but you can just set a fixed thickness using this input variable.
As for exporting to Excel or some other program, my level of programming is not more than amateur and I do not know such techniques.
If I didn't answer your question, or didn't answer it completely, then write your question again and in more detail (and you can do it in English).
Thank you for your answer. I did play around with the FramesInitScale and StepPoint , the numbers got too small. I appreciate your time. Thank you for answering my question. Have wonderful day
Thanks for the reply, I works much better in "TimeAndSales" position.
But in this case, if a set HistoryTicks >100000 the indicator stops working, in M5 on ES 100000 are 9-10 bars.
This is an example of working clusters eon ES with 100000 HistoryTicks:
it works pretty well, but it is not a long history and I would need some more.
By the way, there is the options on "real" volume. but it doesn't work correctly, what is the purpose of thie "Real"?
thank you
Andrea
Hello.
The deals history is a very "voluminous material".
But in general, the indicator should do well even if 1000000 deals are configured there.
Another thing is that it takes some time to transfer this history from the broker's server to your computer.
Just try to increase the number in stages : first 100000 and wait for the result, then 200000 and wait for the result, and so gradually...
This procedure of downloading the deals history needs to be done only once, and then it will already be located locally on your computer.
The "Real" volume mode is the same as the "Tick" volume mode that I described in the previous post (that is, calculations of the candles of the lower timeframe), but it will simply use the real volume of candles.
However, in this mode, the indicator will work many times faster than in the mode "TimeAndSales".
Очень не хватает сжатия графика, планируется? чтобы на м5 хотя бы день, а лучше два помещались
Здравствуйте.
Масштаб кластерного графика по горизонтали можно изменять штатным способом, с помощью кнопок терминала "+" и "-".
Кроме того, в настройках индикатора есть входная переменная FramesInitWidth, которая задаёт ширину фрейма.
Ширина фрейма задаётся в пикселях монитора, а заданное значение является инициирующим относительно самого мелкого масштаба по горизонтали.
Чтобы на М5 в окне графика помещался хотя бы один целый день (сутки), там потребуется разместить 288 свечей, имеется ввиду кластерных фреймов от этих свечей.
При разрешении монитора, например Full HD (1920х1080), разместить такое количество фреймов в пределах видимой области окна графика просто невозможно.
А если даже попытаться сделать это насильственно (должен сказать, что входная переменная FramesInitWidth ограничена снизу, и не может принимать значение меньше 30), то в результате там просто невозможно будет что-либо по кластерам разглядеть.
У меня фрейм вообще отключен, такой масштаб нужен для общей картины, чтобы видеть интересные области, а уже по надобности увеличить,чтобы кластера видеть
а хочу видеть так, 4 дня например хорошо видно
У меня фрейм вообще отключен, такой масштаб нужен для общей картины, чтобы видеть интересные области, а уже по надобности увеличить,чтобы кластера видеть
а хочу видеть так, 4 дня например хорошо видно
Что-то мы видимо друг друга не понимаем.
Для начала тогда попытаюсь объяснить принцип работы индикатора:
Как только Вы устанавливаете этот индикатор на график, то данное окно графика уже прекращает быть свечным и превращается в кластерное.
То есть, индикатор полностью подменяет собой всё, что ранее находилось в этом окне, а также подстраивает по собственному усмотрению размеры окна по вертикали и по горизонтали.
И главная функция индикатора заключается в том, чтобы взять некое количество свечей (обычного графика), заглянуть внутрь каждой этой свечи, вычислить кластерное представление, и соответственно уже отобразить.
Для наглядности я приложил картинку.
На картинке два окна графика, оба Н1, слева кластерное (там установлен индикатор), а справа обычное.
В правом окне серым прямоугольником обозначена область, которая охватывает 12 штук свечей Н1.
А в левом окне мы видим те же самые 12 штук Н1 свечей, но только в их кластерном представлении.
На этой картинке тоже самое, но в меньшем масштабе, здесь помещается уже 25 свечей.
А здесь уже М5, тоже в меньшем масштабе, и этот масштаб самый мелкий, мельче просто некуда, иначе там уже будет ничего по кластерам не разглядеть.
Сейчас там помещается 25 штук М5 свечей, а если бы окно было развёрнуто во всю ширину, то поместилось бы наверное 40 свечей, то есть в пересчёте по М5 это будет всего лишь 200 минут.
И разместить там, в пределах даже развёрнутого окна, 288 свечей М5 (полные сутки), ну просто невозможно.
я имею ввиду вот так , чтобы масштабировалось предельно,и уже когда есть необходимость посмотреть в кластера, тогда и увеличивать
Сейчас же приходится открывать разные окна, на одном картина полная- уровни, эти же уровни нужно скопировать на график с кластерами...
Если это возможно, очень жду такой фичи :)
А, я понял.
Такая фишка существует также и в некоторых терминалах объёмного анализа.
Когда кластерный график при каком-то критически мелком масштабе превращается в свечной график.
Нет, этот индикатор так масштабировать не умеет, и это изначально не задумывалось, и вряд-ли уже будет (но, я подумаю над этим).
Этот индикатор изначально задумывался как предельно простой, недорогой, но в то же время выполняющий основную функцию, рисование кластерами.
я имею ввиду вот так , чтобы масштабировалось предельно,и уже когда есть необходимость посмотреть в кластера, тогда и увеличивать
Сейчас же приходится открывать разные окна, на одном картина полная- уровни, эти же уровни нужно скопировать на график с кластерами...
Если это возможно, очень жду такой фичи :)
Сделал, пробуйте.
И рекомендую почитать вкладку "Что нового" для версии 1.8.
Сделал, пробуйте.
И рекомендую почитать вкладку "Что нового" для версии 1.8.
Добрый день,
Я использую переводчик, поэтому я надеюсь, что вы понимаете. Спасибо.
Я купил индикатор, думая, что он поможет, но из-за масштабирования с моим монитором он делает его бесполезным для моего типа анализа. Поэтому мне было интересно, если вы можете запрограммировать диаграмму или экспортировать в Google Sheets или Excel Sheets, что я делаю вручную? Я наблюдаю общий объем торгов, предоставленный брокером на 10, 5 или 1 минутных таймфреймах. По мере изменения объема я обновляю цену. Я начинаю с того, что такое ночной профиль громкости, а затем просто сижу и обновляюсь. Я включил изображение того, как это выглядит в Google Sheets.
Я использую MT5 от AmpTrading, и мое соединение для передачи данных - CQG. В настоящее время я обновляю объем для США 10 лет и США 30 лет.
Спасибо за уделенное время.
С уважением,
отметка
Hello.
Thank you for your purchase.
I think it would be better if I answered in English.
If you have problems scaling horizontally (for example, the number of profiles in the chart window is too large or too small), you can use the input variable FramesInitScale.
If you have problems scaling vertically (for example, the cluster thickness is too small or too large), you can use the input variable StepPoint to set the cluster thickness. By default, the cluster thickness is determined automatically, but you can just set a fixed thickness using this input variable.
As for exporting to Excel or some other program, my level of programming is not more than amateur and I do not know such techniques.
If I didn't answer your question, or didn't answer it completely, then write your question again and in more detail (and you can do it in English).
Hi again,
Thank you for your answer. I did play around with the FramesInitScale and StepPoint , the numbers got too small. I appreciate your time. Thank you for answering my question. Have wonderful day
Mark
hi Evgeny Shevtsov,
Made a purchase and have been testing it against sierracharts and other orderflow/cluster/footprint software.
All of them, bid (sellers) is on the left and ask(buyers) on the right.
can we have an option so the indicator allows ClustersNegativeColor on the left and ClustersPositiveColor on the right.
regards,
sherman
Hello.
Thank you for your purchase.
I'll think about it for the next version.
In the meantime, you can use the input variable SignReverse, but it swaps the color too.
SignReverse - reverse of the volume of clusters (buyers as sellers, and sellers as buyers). What does this mean
Correct me if i'm wrong but does this mean as price are rising seller are entering in to the markert . then you get a down reversbarSignReverse - reverse of the volume of clusters (buyers as sellers, and sellers as buyers). What does this mean
Correct me if i'm wrong but does this mean as price are rising seller are entering in to the markert . then you get a down reversbarHello.
A deal in the market always involves two people.
That is, if one person buys, then another person simultaneously sells.
There are two types of orders :
Stop type orders (they are also market type orders) and limit type orders.
According to the orders execution rule :
A stop type order cannot be satisfied by a stop type order.
In other words, a stop type order can only be satisfied by a limit type order.
Thus, the deal can be viewed from two points of view - from the point of view of stop type orders, or from the point of view of limit type orders.
These two points of view are both correct (and even identical), but simply these two points of view are mirrored relative to each other.
And the input variable "SignReverse" just switches this point of view.
Hello I am trying the indicator but I found many differences in the cluster values, against a Rithmic Platform
and please look at this image:
it happens many many time that the value remains the same, (in this case 114), and this is clearly not possible in the market.
I also check it against a rithmic platform and the value are different.
Can you please check it? In this moment i cannot trust the values that I read. I am using Mt5 with Amp Futures feed
Thank you
Andrea
Hello.
This indicator uses for calculations only the historical data that comes from your broker.
In other words, this indicator does not use any extraneous data that does not belong to your broker.
There are two types of historical data of the broker:
1. Deals history - its type (buy or sell) and its volume.
2. Candles history - ascending or descending candles and its volume.
If your trading symbol has a deals history, then you can switch the input variable "VolumeType" to the "TimeAndSales" position.
And then the clusters will look very detailed, even on small timeframes.
Additionally, you can use the input variable "HistoryTicks", which sets the number of deals relative to which clusters will be built.
If your trading symbol does not have a deals history, then you must switch the input variable "VolumeType" to the "Tick" position.
And then the indicator will be used for calculation the candles of the lower (relative to the current) timeframe.
For example, if the current timeframe is M5, then the lower timeframe will be used M1, where there are only five M1 candles for each M5 candle.
And then the clusters will look not detailed, and will look something like in your picture.
But, the higher the current timeframe, the more detailed the clusters will look.
Thanks for the reply, I works much better in "TimeAndSales" position.
But in this case, if a set HistoryTicks >100000 the indicator stops working, in M5 on ES 100000 are 9-10 bars.
This is an example of working clusters eon ES with 100000 HistoryTicks:
it works pretty well, but it is not a long history and I would need some more.
By the way, there is the options on "real" volume. but it doesn't work correctly, what is the purpose of thie "Real"?
thank you
Andrea
Hello.
The deals history is a very "voluminous material".
But in general, the indicator should do well even if 1000000 deals are configured there.
Another thing is that it takes some time to transfer this history from the broker's server to your computer.
Just try to increase the number in stages : first 100000 and wait for the result, then 200000 and wait for the result, and so gradually...
This procedure of downloading the deals history needs to be done only once, and then it will already be located locally on your computer.
The "Real" volume mode is the same as the "Tick" volume mode that I described in the previous post (that is, calculations of the candles of the lower timeframe), but it will simply use the real volume of candles.
However, in this mode, the indicator will work many times faster than in the mode "TimeAndSales".