Gamma Bands MT5
- 지표
-
Ziheng Zhuang
 About me:a C/C++ programmer and forex trader, develop MT4/5 apps from October 2007.
Email: admin@fxmeter.com
My products: https://www.mql5.com/en/users/fxmeter/seller - 버전: 3.0
- 업데이트됨: 9 4월 2025
- 활성화: 10
Gamma Bands
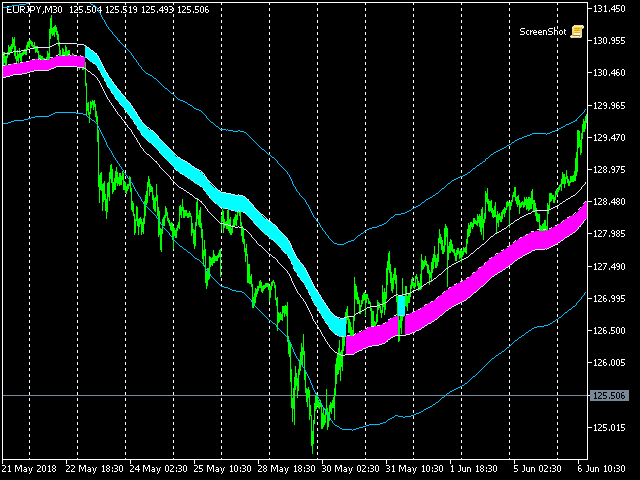
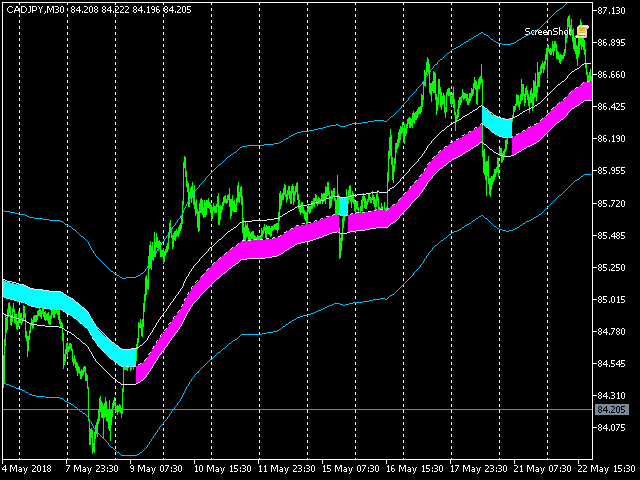
This indcator shows the trend with the color histogram. It is simple and easy to use.
Usage:
- If the histogram changes from the aqua to the fuchsia, which means the trend is up.
- If the histogram changes from the fuchsia to the aqua,which means the trend is down.
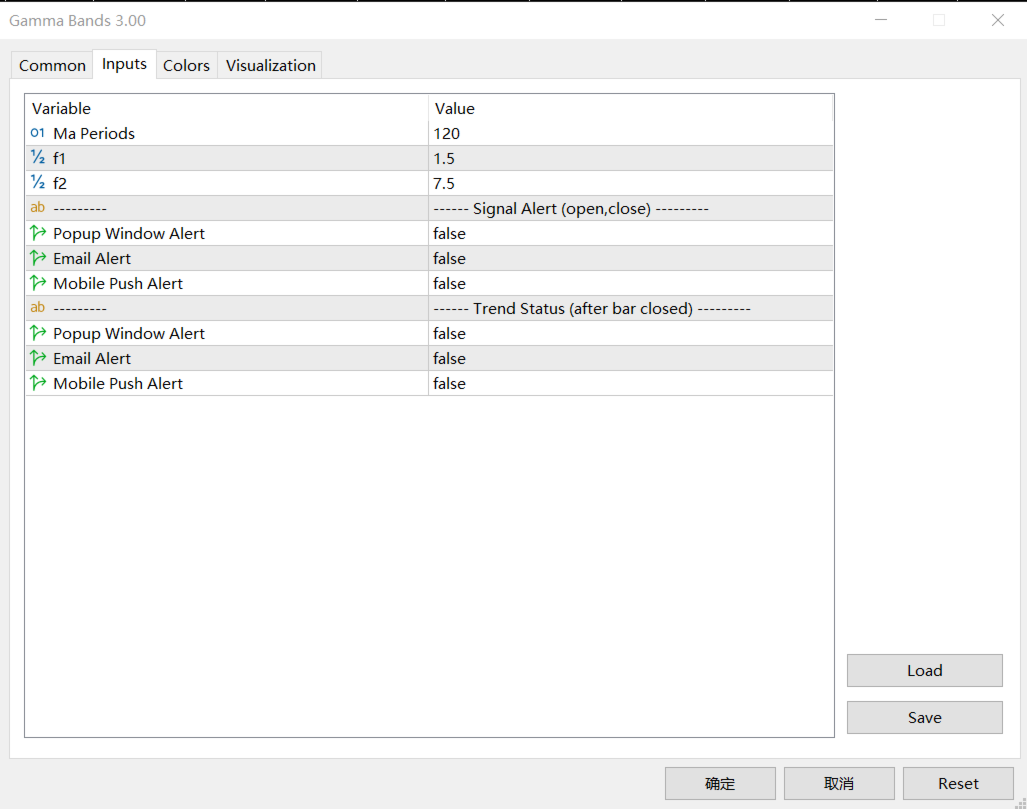
Inputs:
- MaPeriods: the periods of moving average.
- f1: the multiplier of inner bands
- f2: the multiplier of outer bands
- Popup Window Alert
- Email Alert
- Mobile Push Alert
Alerts
- When the trend changes for the long trend to the short trend or vice versa.
- When price crosses up the outter band,alert for closing buy orders.
- When price crosses down the outer band, alert for closing sell orders.


사용자가 평가에 대한 코멘트를 남기지 않았습니다