Reversal Point MT4
- 지표
-
Ziheng Zhuang
 About me:a C/C++ programmer and forex trader, develop MT4/5 apps from October 2007.
Email: admin@fxmeter.com
My products: https://www.mql5.com/en/users/fxmeter/seller - 버전: 4.0
- 업데이트됨: 1 12월 2022
- 활성화: 20
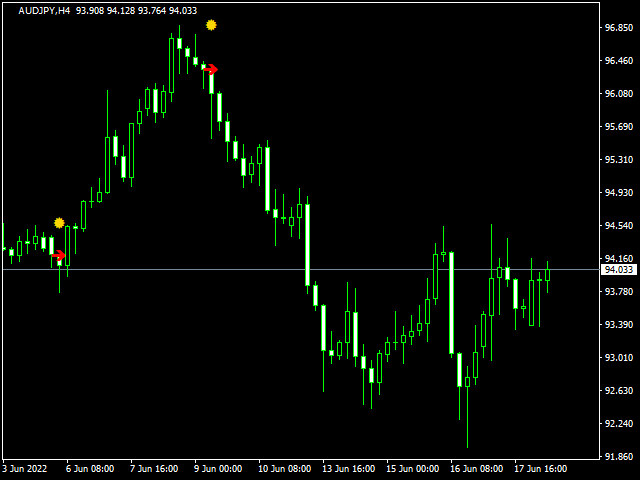
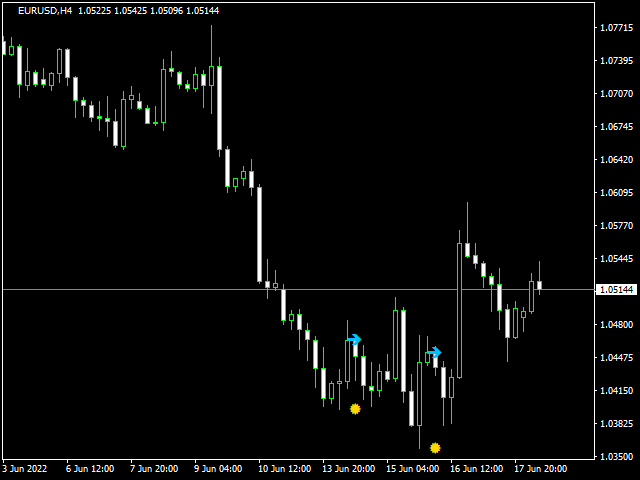
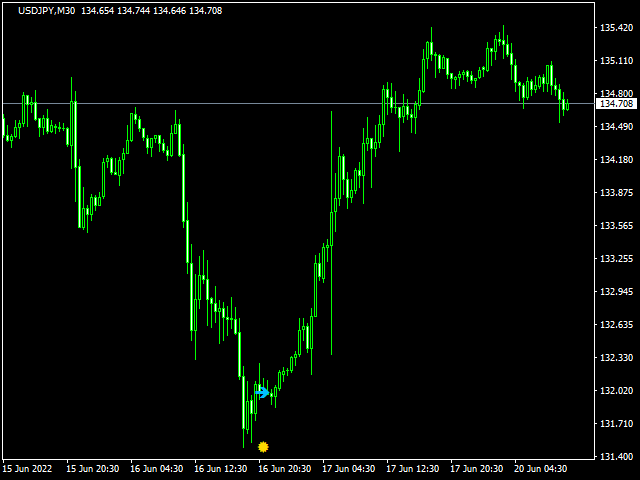
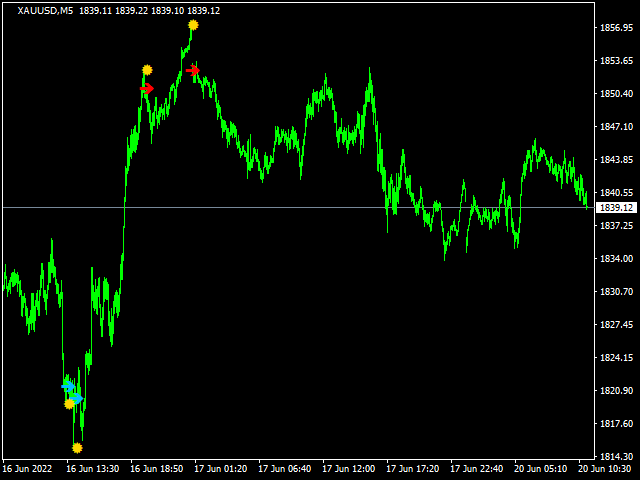
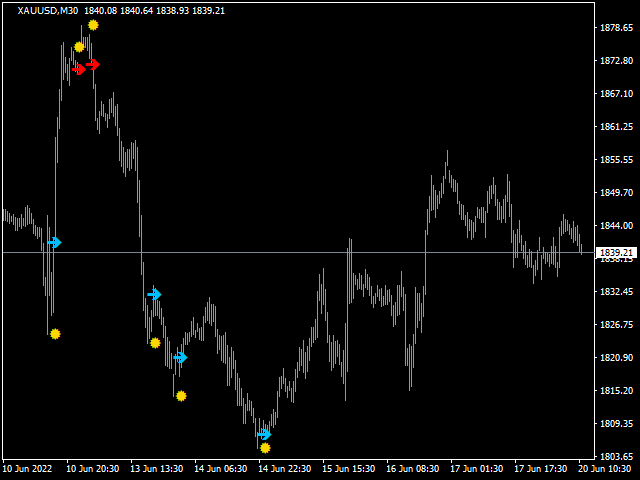
The purpose of the inidcator is to identify the reversal point.
The blue arrow is buy signal and the yellow star is its stop loss.
The red arrow is sell signal and the yellow star is its stop loss.
Alert feature: if there is a signal, the indicator will send alerts of popup window,email or mobile push.
Inputs:
- Popup Window Alert: it is false in default
- Email Alert : it is false in default
- Mobile Push Alert: it is false in default.
MetaTrader 5 Version: Reversal Point
Please note that the singal is against trend,it could be continual fail.
사용자가 평가에 대한 코멘트를 남기지 않았습니다