Midas Volume Profile
- 지표
- 버전: 1.0
- 활성화: 5

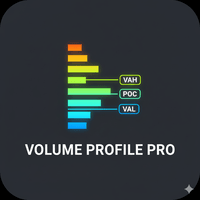
Midas Volume Profile shows where volume traded in each day or week, drawn as a histogram at the start of the session, with the levels profile traders use, and the session and anchored VWAPs that go with them. All volume is tick volume from a lower timeframe; VWAP from tick volume is not exchange VWAP.
Profiles
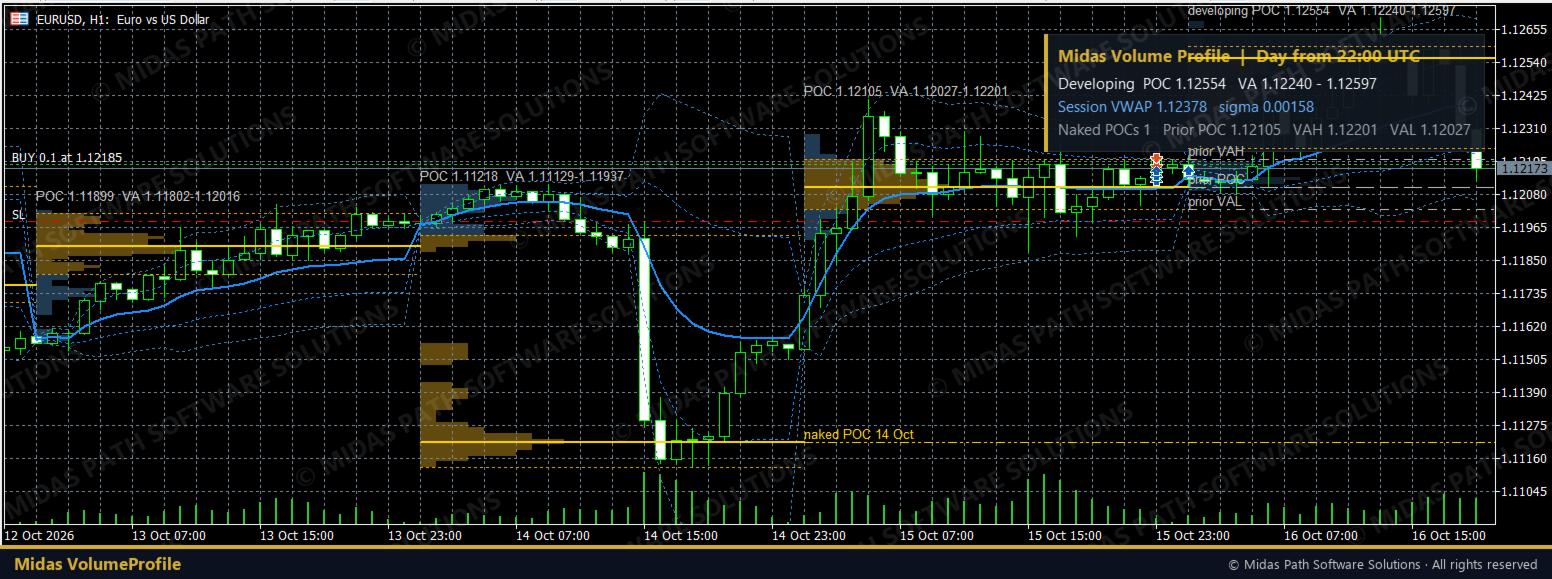
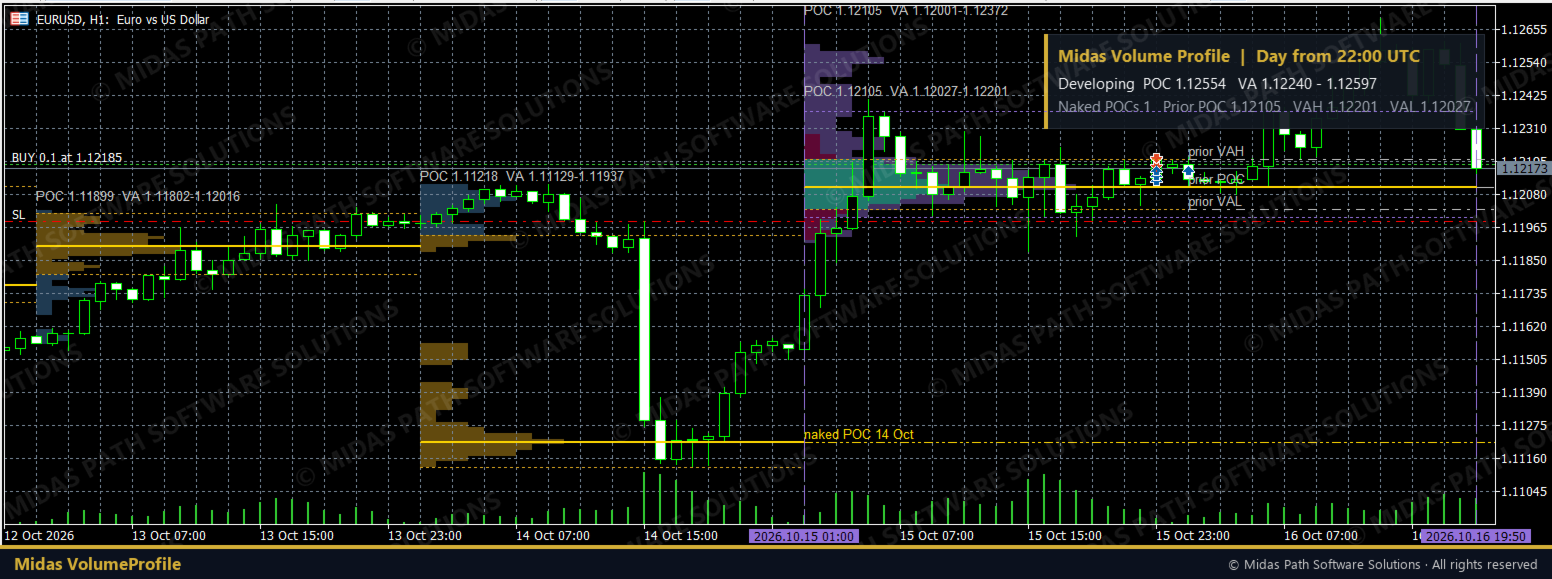
- A volume histogram for each session, with the value area highlighted.
- POC (point of control): the price row with the most volume, drawn across the session.
- Value area high and low (VAH and VAL): the range around the POC that holds 70% of the session's volume (adjustable).
- Naked POCs: earlier sessions' POCs that price has not traded through since, extended to the right until price touches them.
- The developing profile of the current session, updated as each volume candle closes.
- Prior-session levels: the previous day's (or week's) POC, VAH and VAL drawn into the current session, labelled, each with a switch.
VWAP
- Session VWAP for the day or week, from the same session start as the profiles, with 1, 2 and 3 sigma bands. Each band has its own switch and multiplier. Price: typical, close or HL2.
- Anchored VWAP, up to three at once: Ctrl+click a candle for anchor 1, Ctrl+Shift+click for anchor 2, Ctrl+Alt+click for anchor 3, or drag each anchor's vertical line. Optional bands per anchor. Anchors are kept across restarts, per symbol.
Range profile
- Switch it on and drag the two vertical lines: the indicator draws one composite profile with POC, VAH and VAL between them, built by the same arithmetic as the session profiles.
Alerts
- A sound, and if you want a pop-up or a push notification to your phone, when a volume candle trades into a naked POC, a prior VAH or VAL, the session VWAP or one of its bands.
- Each level can be switched off. At most one alert per level per session.
- Alerts say that price reached a level; they are not signals.
The panel
A small panel reads out the developing session's POC and value area, the session VWAP and its sigma, how many POCs are still naked, the prior session's levels, your anchors, and the last five alerts. Corner and font size are yours to choose.
How it is built
- Volume is tick volume (the number of price updates), the usual measure in forex and CFDs, where there is no central exchange volume. It is taken from a lower timeframe (5 minutes by default) for detail; if the chart's own timeframe is lower, that is used instead.
- Each candle's volume is shared across the price rows its high-low range covers, in proportion to the overlap. The session's range is split into 50 rows (adjustable). The value area grows from the POC towards whichever neighbouring row holds more volume, until it holds the chosen share.
- VWAP is the volume-weighted average of each candle's price from the session start or the anchor; the bands are the volume-weighted standard deviation around it.
- The session start hour is in UTC by default (22:00, the forex day) or in your broker's server time, as you choose, with no daylight-saving shift.
Inputs
- Profile: per day or per week; session start hour; hour in UTC or server time; rows; value-area share; volume timeframe.
- Display: completed sessions shown; developing session; naked POCs; histogram width and opacity; colours; panel on or off, corner and font size.
- VWAP: session VWAP on or off; price; the three bands and their multipliers.
- Anchored VWAP: each anchor on or off with its band multiplier; a default time for anchor 1.
- Range profile: on or off; colour. Prior session: POC; VAH and VAL; colour.
- Alerts: naked POC; prior VAH and VAL; session VWAP; bands; sound and sound file; pop-up; push notification; message in the panel.
Tested
The arithmetic was checked against an independent recalculation over 49,038 candles: every daily and weekly profile (session boundaries, every row's volume, POC, value area, every naked-POC touch), the session VWAP and its sigma at every candle, three anchored VWAPs along their length, fifty range profiles row by row, and 1,039 touch alerts: 200,689 checks, 0 violations. The MetaTrader build reproduces the same figures line for line on a shared test set, and its own invariant checks pass.
Notes
- Tick volume counts price changes, not traded contracts; it differs between brokers.
- Volume profiles and VWAPs describe where trading happened; they do not predict where price will go. This is not financial advice and no result is promised.
- It never trades and needs no internet or file access.