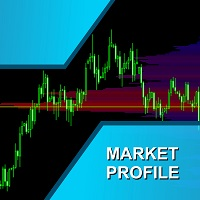
VDelta Profile Pro
- 지표
- 버전: 9.30
- 활성화: 5

VDelta Profile Pro
Volume Profile + Order-Flow Context for XAUUSD, US100 (NAS100) and US500 (SP500)
VDelta Profile Pro builds a live volume profile directly on your chart, showing where the market actually traded — the Point of Control (POC), Value Area (VAH/VAL), and High Volume Nodes (HVN). These structural levels act as natural support and resistance zones that price tends to respect, react to, and return to.
The core of this tool is volume-at-price: it measures how much activity occurred at each price level, independent of buy/sell classification. This is the most dependable layer of market structure information and the foundation everything else is built on.
How it works
- Volume Profile — distributes volume across price rows to reveal where trading concentrated. Row size adapts to volatility (ATR-based) or can be fixed.
- POC (Point of Control) — the single price level with the highest traded volume. The most significant magnet/reference on the chart.
- Value Area (VAH / VAL) — the price band containing a configurable share (default 68%) of total volume. Edges often act as decision points.
- POC Migration — tracks how the POC shifts across time, helping you read whether the consensus price is drifting up, down, or staying flat.
- HVN (High Volume Nodes) — statistically prominent volume shelves (Z-score based) marked as key levels.
- Liquidity Sweep detection — flags when price pierces a Value Area edge and closes back inside, with an absorption check.
- Delta overlay (contextual) — an estimated buy/sell pressure layer derived from candle structure, shown as a secondary, supportive read.
Transparency about delta
This tool is transparent about how its delta layer is calculated. On most retail data feeds, the tick BUY/SELL flags required for true order-flow are not reliably populated. When that is the case, VDelta Profile Pro derives delta from candle structure (an estimated value), and the panel clearly labels the active data quality (REAL flags / ESTIMATED). The volume profile, POC and Value Area do not depend on this estimation and remain reliable regardless of feed. This tool does not claim to reproduce exchange-level (CME) order flow.
Built-in presets
Pick your instrument and timeframe from a single dropdown ( InpPreset ) — XAU M5/M15, US100 M5/M15, US500 M5/M15 — and the tool configures row size and session hours for you. These presets are sensible starting points; refine them to your own data and style. PRESET_MANUAL leaves every parameter under your control.
Performance
Designed for smooth operation alongside heavy chart use: object reuse instead of constant recreation, incremental updates per bar, in-place profile expansion on breakouts (so volume is never cut off), and a configurable refresh throttle.
How to use it
VDelta Profile Pro is an analysis tool, not an automated trading robot. Use POC, Value Area and HVN as a structural map: areas to watch for reaction, continuation or reversal. It works best combined with your own strategy, entry rules and risk management — as a context and confluence layer, not a standalone signal generator. The optional arrows and dots are discretionary references, not trade instructions.
🚀 Launch price $49 — rising in steps toward $149 as demand grows. Early buyers lock in the lowest price + all future updates free.
Risk warning
Trading carries risk. This tool does not predict the market and no win rate or profit is guaranteed. Past behavior of any level does not guarantee future reaction. Always test thoroughly on a demo account and within your own risk framework before using on a live account. You are responsible for your own trading decisions.
---------------------------------------------------------------------------
How to Read VDelta Profile Pro
Each horizontal row represents a price level. The bar length shows the total traded volume at that level, and the number is the estimated delta — the difference between estimated aggressive buying and aggressive selling volume at that price. Positive (green) means estimated buying pressure dominates; negative (red) means estimated selling pressure dominates.
Colors:
- Green bars / +numbers — levels where estimated buying pressure leads.
- Red / crimson bars / –numbers — levels where estimated selling pressure leads.
- Yellow-olive bars — high-volume zone, the most actively traded area.
- Orange row (POC) — Point of Control, the single price level with the highest traded volume.
Markers and lines:
- Dots on the left — quick visual flags for rows with significant delta (red = strong negative, green = strong positive).
- Blue box — the Value Area, where the majority of volume is concentrated.
- Orange dashed line — runs through the POC.
- Upper / lower blue dashed lines — the Value Area High (VAH) and Value Area Low (VAL).
Note: Delta is an estimate of buying/selling pressure derived transparently from volume, not true exchange order-flow. Use this indicator as context alongside your own strategy. Trading involves risk; past behavior does not guarantee future results.