Market Maker Reversal Scanner MT5

By the time you've clicked through forty charts looking for a first red day at a monthly high, the setup you wanted has already closed.

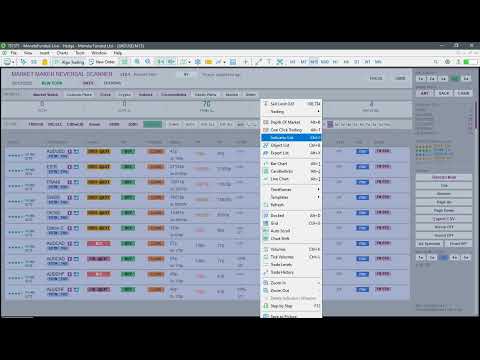
Market Maker Reversal Scanner reads your Market Watch, finds a fixed set of reversal and exhaustion patterns, scores each one on a transparent 10-point scale, and puts the results in a single sortable panel on one chart. You stop hunting. You start choosing.

New in v12.1: a DAYS / SESSIONS switch. Sessions mode runs the same scanner on closed H4 candles and tags every row Asia, London or New York. A per-pair WIN% column now sits beside that pair's own base rate, so you can see how its past signals compare with its normal behaviour.

Introduction

This is an analysis tool. It does not place, modify or close trades, and it makes no claim about profitability. It has no DLL imports and makes no web requests.

A signal here is a candidate for the next session, not an entry now. The scanner shows which instruments closed in a condition worth watching and which side is likely trapped. Where and whether you enter is your own work, on your own timeframe.

The logic follows the Stacey Burke ACB framework ("ain't coming back") and the Taylor 3-Day Cycle: price is pushed to an extreme, late traders get trapped there, and the reversal is the trade. "Market maker" in the name refers to that model of price behaviour. The scanner reads bar data only. It has no access to order flow or institutional positioning.

How it works

  • Days mode (default): each closed D1 bar is evaluated against the weekly and monthly structure around it.
  • Sessions mode: each closed H4 candle plays the role of a day. Its tag (ASIA / LONDON / NY) is the session it opened in. Signal names change to match: FRS/FGS, 3SHC/3SLC, 3S-BO, INSIDE-S, OS and S-CIB.
  • Scoring: every row shows its own arithmetic, so nothing is a black box.

Score (max 10)

  • Extreme (max 6): close at a monthly extreme = 6, close at a weekly extreme = 4, monthly high/low = 2, weekly high/low = 1.
  • Signal (max 3): FRD/FGD, 3HC/3LC, Inside Day, Outside Day, a chain, and close-in-breakout or 3-day breakout at an extreme.
  • Timing (max 2): backside of the month, first day of the trading month, Wednesday.
  • Template (max 1): FRD, FGD, Inside Day or Outside Day on a Wednesday or Thursday, backside only.
  • Tiers: ELITE 9–10, PRIME 7–8, STRONG 5–6, WATCH 3–4, ALERT 1–2.

Design rules that keep the list short:

  • FRD/FGD need an extreme on the matching side.
  • 3HC/3LC need an extreme.
  • Breakout-family signals score zero away from an extreme (default setting).
  • Only the named high-conviction setups at a monthly-close extreme can reach ELITE. Everything else caps at PRIME.

You will see fewer rows than a typical scanner produces. That is the point.

Key Features

  • One scanner, two windows. Switch between DAYS and SESSIONS live from the title bar. Scoring, filters and alerts work the same in both.
  • Narrows the universe to a watchlist you can manage. Scan your whole Market Watch or a custom list. Forex, indices and commodities are on by default. Crypto, exotics, stocks and other are off by default and can be toggled independently, with broker prefixes and suffixes handled.
  • Detected setups: FRD, FGD, 3HC, 3LC, Inside Day, Outside Day, 3-day breakout up/down, daily close-in-breakout up/down, weekly close-in-breakout up/down (Days mode), plus the 3HC→FRD / 3LC→FGD chain as a distinct high-conviction row.
  • Close-in-breakout handled as the method intends. At an extreme it is a scored row. Anywhere else it is flagged IN PLAY as a watchlist trigger, scoring zero and never alerting.
  • Direction on every row. BUY, SELL or WATCH, derived from which extreme the bar is at.
  • Per-pair WIN% next to a base rate. WIN% is how often this pair's past signals of the same setup, extreme and weekday were followed by a next-day (next-H4 in Sessions mode) close in the signal's direction. DAY G/R is how often that pair closes green or red with no signal at all. Hover for the edge, wins/n and the 90% lower bound. History is seeded on start by replaying up to 250 past daily bars per symbol. It never pools different pairs.
  • Volatility context. ADR(14), 3×ADR, distance travelled from the open and an EXT flag past 3×ADR, plus week-to-date range.
  • Written thesis per row. Hover any signal for a plain-English explanation of what fired, which extreme it is at and the ADR context.
  • Filters and sorting. Independent signal-type filters, an extreme-quality filter that cycles from all extremes down to monthly-close only, a minimum-star filter, and four sort modes (score, age, A–Z, today first). Age filters read days in Days mode and 1h / 4h / 8h since candle close in Sessions mode.
  • Data health reporting. Symbols with thin or stale history are counted, named in a tooltip, excluded from results, and retried automatically.
  • CSV export. 44 columns per row, including every score component, every extreme flag, session, age, thesis and the WIN% and base-rate fields.
  • Alerts. Pop-up, optional sound (a different file per tier) and optional e-mail (needs your terminal's SMTP settings). Alerts fire only for PRIME and ELITE setups on the latest closed bar. There is no mobile push.
  • Responsive on large lists. The universe is scanned in slices with a time budget per tick, so the terminal stays usable.
  • Interface. 13 themes including the new Obsidian Gold, a saved default theme, scrollbar and mouse-wheel scrolling, focus mode and a built-in ? GUIDE overlay. Clicking a row opens that symbol's chart (D1 by default, M5 in Sessions mode).

Risk Management and Settings

The scanner has no risk module because it never touches your account. What it gives you are the controls that decide how strict it is, which is where discipline lives:

  • InputMinStrengthFilter (default 4): shows PRIME and ELITE rows only. Lower it to widen the list.
  • InputCIBExtremeOnlyTradeable (default on): keeps breakout-family signals out of the scored list unless they are at a genuine extreme.
  • InpFRD_MinPumpDays (default 1): consecutive higher/lower closes required before an FRD/FGD. Set 3 for strict three-close behaviour.
  • InpFRD_RequireFalseBreak (default off): require the FRD/FGD bar to poke a new extreme and fail.
  • InputCheckMonthlyExtremes / InputCheckWeeklyExtremes (default on): which extreme windows are evaluated.
  • InputUseTemplateDayBonus (default on): turn off the Wednesday/Thursday template point if you don't trade the template.
  • InputShowMultipleSignalsPerSymbol (default on): every qualifying setup, or only the newest per symbol.
  • InpProbMinTrials / InpProbBackfillBars: how many graded past signals a % needs before it is shown, and how much history seeds it.
  • InpFridayCloseHourUTC (default 21, US-DST aware): after this hour Friday's bar is treated as closed.
  • InputAlertCustomOnly and InputInstanceTag: limit alerts to your custom list, and keep several attached instances from colliding.

A workflow that fits the method: take only PRIME and ELITE rows, read WIN% against DAY G/R rather than on its own, check the EXT flag before entering, and use the CSV export to keep an honest record of which tiers perform on your instruments and your feed.

FAQ

Does it trade for me? No. It reads price and displays results. It never opens, modifies or closes a position.

Does it repaint? Scored signals are built from closed bars. In Days mode the forming daily bar is skipped on weekdays. Once the Friday close hour passes, Friday's bar is treated as closed so its setups appear that evening. ADR, range and EXT figures update live. A signal row does not change after its bar closes.

What does WIN% actually tell me? Only how often this pair's past signals of the same setup were followed by a next-day close in the signal's direction. Green means reliably above 50% (90% lower bound). It does not subtract the pair's normal drift, so compare it with DAY G/R. A small number of past signals is weak evidence, and 15/19 means far more than 4/4. It is not a profit figure.

Why no backtest or profit statistics? The scanner identifies conditions. It defines no entries, stops or targets, so there is no strategy to backtest. Use the CSV export to build statistics on your own instruments.

Why are there so few signals? Most of the filtering is intentional. You can widen the list by lowering the minimum-star filter and disabling InputCIBExtremeOnlyTradeable, but you are trading precision for volume.

Which alerts are supported? Pop-up, sound and e-mail. There is no mobile push. Sound can be limited to ELITE only with MIN SOUND STARS in the sidebar.

What timeframe do I attach it to? Any. Days mode analyses D1 and Sessions mode analyses H4, whatever the chart is. The chart is only a canvas for the panel.

Will I get identical results to another trader? Not necessarily. Brokers with different server times close the daily candle at different hours, and symbol availability differs.

Some symbols aren't showing. Symbols with thin or stale history are excluded and listed under DATA HEALTH. Open those charts once so the terminal downloads D1 (and H4 for Sessions mode), then rescan.

What files does it write? Signal history and graded results (MMR_SignalHistory.csv, MMR_DayResults.csv), alert-dedup keys, and your CSV exports, all in the terminal's Files folder.

Getting Started

Attach it to any chart, open the ? GUIDE overlay and read the scoring breakdown against live rows for a week before changing a single default. Then switch to SESSIONS to see the same logic on H4. If it puts one setup in front of you on a symbol you would never have opened, it has paid for itself.

Analysis tool only. Past signal behaviour does not guarantee future results.
추천 제품
ARE Quantum Liquidity
Jakir Hussain Shaikh
ARE Quantum Liquidity Institutional Smart Money Engine ARE Quantum Liquidity is an advanced Smart Money Concepts (SMC) indicator designed to help traders identify institutional liquidity movements and high-probability trading opportunities. The indicator analyzes market structure in real time and automatically detects important price action elements used by professional traders, including Break of Structure (BOS), Change of Character (CHoCH), Order Blocks, Fair Value Gaps (FVG), Liquidity Swe
KT Pin Bar MT5
KEENBASE SOFTWARE SOLUTIONS
KT Pin Bar identifies the pin bar formation which is a type of price action pattern which depicts a sign of reversal or rejection of the trend. When combined with support and resistance, BRN and other significant levels, Pin Bar pattern proved to be a very strong sign of reversal. Basically, a pin bar is characterized by a small body relative to the bar length which is closed either in upper or lower 50% part of its length. They have very large wicks and small candle body. A pin bar candlestic
RBreaker
Zhong Long Wu
RBreaker Gold Indicators는 금 선물을 위한 단기 데이 트레이딩 전략으로, 추세 추종과 데이 내 반전의 두 가지 거래 방식을 결합합니다. 추세 장에서 수익을 포착할 수 있을 뿐만 아니라, 시장이 반전될 때 적시에 이익을 확정하고 추세에 맞춰 반대 포지션을 잡을 수 있습니다. 이 전략은 미국 잡지 Futures Truth에서 15년 연속으로 가장 수익성 높은 트레이딩 전략 상위 10위 안에 선정되었습니다. 긴 라이프사이클을 자랑하며, 현재까지 국내외에서 널리 사용되고 연구되고 있습니다. 본 지표는 2026년 금 선물의 움직임을 반영하여 14일 ATR 지표를 기반으로 돌파 계수 A, 관찰 계수 B, 반전 계수 R을 보다 합리적인 값으로 정의했습니다. 매우 훌륭한 지표이며, 안정적인 연간 수익성을 달성했습니다. 강력히 추천합니다~ 위 지표는 변동성이 높은 상품에 적합하며, 매개변수는 금 선물, 주가 지수 선물 등에 적합합니다. 다른 상품이 필요한 경우 돌파 계수 A
SPECIAL LAUNCH OFFER: $30 (1-Month Rent) Limited time offer to build our community and gather feedback! AmbM GOLD Institutional Scalper A high-precision M5 algorithm for XAUUSD (Gold) , engineered to trade exclusively at Institutional Liquidity Levels ($5/$10 psychological marks). PERFORMANCE DATA (BUY ONLY) • Win Rate: 87.09%. • Safe Growth: +$4,113 profit on $10k (13.75% Max Drawdown). • Extreme Stress Test: Successfully generated +$22,997 in a 5-year stress test (2020-2026), proving
스마트 머니의 비밀 잠금 해제: Area of Interest + Exact Fibs! 가짜 돌파(Fake breakouts)와 잘못된 진입에 지치셨나요? 대형 기관과 은행이 실제로 매수 및 매도 주문을 어디에 배치하는지 알고 싶으신가요? Area of Interest (AOI)를 만나보세요 — 고급 Pine Script 로직을 MetaTrader 5 차트로 직접 가져오는 MT5용 궁극의 정밀 인디케이터입니다. 이 지표는 마켓 메이커가 만든 숨겨진 공급 및 수요(Supply and Demand) 영역을 자동으로 감지하고, 이를 매우 정확한 동적 피보나치 되돌림 시스템과 결합합니다. 더 이상 진입점을 추측하지 말고 스나이퍼와 같은 정밀도로 거래를 시작하세요! 주요 기능 (이 지표가 최고의 선택인 이유): 자동 수요 및 공급 박스: 실시간 차트에 지지 및 저항 영역(관심 영역)을 자동으로 정확하게 그립니다. 정확한 Pine 자동 피보나치 (Auto-Fibs): 고급 로직을 사용하여 가장
Prometheus Analyst
Humphrey Mangera
PROMETHEUS TECHNICAN VERSION Free | By THE SONS A gift from The Sons — no strings, no trial, no expiry. Every trader deserves access to professional-grade market intelligence. That belief is why Prometheus Technical Version exists, and why it costs nothing. Consider it our handshake to the trading community. What You're Getting This is not a simplified tool dressed up as a gift. Prometheus Technican Version is a fully built, institutional-quality technical analysis indicator running a dual-model
FREE
Overview The Market Perspective Structure Indicator is a comprehensive MetaTrader indicator designed to provide traders with a detailed analysis of market structure across multiple timeframes. It identifies and visualizes key price action elements, including swing highs and lows, Break of Structure (BOS), Change of Character (CHOCH), internal structures, equal highs/lows, premium/discount levels, previous levels from higher timeframes, and trading session zones. With extensive customization opt
Structure King AI Signal
Shingala Gautamkumar
Structure King AI Signal Structure King AI Signal is a professional MetaTrader 5 trading indicator designed to help traders analyze market structure, trend direction, multi-timeframe confirmation and trade management from one clean dashboard. Key Features • Market Structure & Trend Analysis • BUY / SELL Signals • Multi-Timeframe (HTF) Confirmation • Entry Price Levels • Dynamic Stop Loss (SL) • TP1 / TP2 / TP3 Levels • ATR Volatility Analysis • ADX Trend Strength Filter • Adaptive Market Filter
Fibaction
Abdelkhalek Orabi
Indicator Name: Fibaction – price action candle Detector Description: Fibo Signal Boxes is a powerful Smart Money Concept (SMC)-inspired indicator that auto-detects price action candles. bullish hammers and shooting stars, then draws precise Fibonacci entry zones and multiple take-profit levels directly on the chart. as for the SL personally i use 40 pips rules  Key Features: Detects bullish hammer and shooting star reversal candles. Automatically draws Fibonacci entry and TP boxes. as
Babel Assistant
Iurii Bazhanov
4.33 (9)
Babel assistant 1 MT5 넷팅(netting) 로봇 "Babel_assistant_1"은 ZigZag 지표를 사용하여 M1, M5, M15, H1, H4, D1 및 W1 타임프레임 전반에 걸쳐 피보나치 수준을 생성하고, 매수 및 매도 트렌드의 강도를 계산합니다. 지정된 트렌드 수준 4.925를 초과하면 "Lot for open a position" 설정을 사용하여 포지션을 엽니다. 그런 다음, Babel은 특정 피보나치 수준에 대기 주문(pending orders)을 배치하고 지정된 손절매(Stop Loss) 및 이익실현(Take Profit) 라인을 설정합니다. 화면에는 포지션, 거래 및 트렌드의 현재 결과가 표시됩니다. 0.02랏 이상의 수동 포지션 증가는 로봇에 의해 자체 대기 주문의 트리거로 인식됩니다. 0.01랏의 대기 주문 또는 시장가 주문은 체결 시 단순히 포지션 볼륨을 변경합니다. 면책 조항: 아래에 제시된 자료는 정보 제공 및 교육 목적으로만 제공됩니다
FREE
They say history repeats itself. What if you could prove it in real-time? The Propfolio Ghost Pattern is an advanced algorithmic pattern-matching engine. It empowers you to select any current price action structure on your chart and instantly scan thousands of historical candles to find the exact moment in the past where the market did the exact same thing. Once it finds the highest probability match, it projects the historical outcome into the future as "Ghost Candles"—giving you a highly calcu
Zone Structure Scanner Panel for MT5 Find better setups faster — without scanning charts for hours. The Zone Structure Scanner Panel for MT5 helps you automatically scan multiple symbols, detect key weekly and daily support/resistance zones, read market structure, highlight confluence, and flag H4 rejection-confirmed setups from one powerful panel. Instead of jumping from chart to chart, you get ranked opportunities in one place so you can focus on the setups that matter most. Why it stands
Support & Resistance Auto Plot Lines Indicator for MT5 – Perfect for Scalping! Make your trading easier with our Support & Resistance Auto Plot Lines indicator for MT5. This powerful tool automatically detects key support and resistance levels on your chart, helping you make better trading decisions with minimal effort. Why Choose This Indicator? Perfect for Scalping – Quickly identify strong price zones for fast, precise entries and exits. Automatic Level Detection – No need to manually dra
SMC Smart Flow Pro
Thitipong Nookhunthod
Short Description: SMC Smart Flow Pro is an advanced Smart Money Concept indicator that automatically detects Break of Structure (BOS), Change of Character (CHoCH), and projects precise TP/SL target levels on all timeframes — built for serious traders who trade with institutional flow. Full Description: SMC Smart Flow Pro is a premium Smart Money Concept (SMC) indicator for MetaTrader 5, engineered for traders who want to trade alongside institutional order flow. By automatically mapping m
Advance Entry Levels Light
Kundan Kumar Srivastava
Introducing Your Ultimate Trading Edge:   Dynamic Support & Resistance, Advance Entry Levels Light Indicator for MT5 platform Unlock the power of precision trading with our cutting-edge Dynamic Support & Resistance Indicator. Designed to give traders unparalleled clarity, this indicator is your roadmap to identifying exactly where to buy and sell, maximizing your potential for consistent, sustainable profits. Why Choose Our Indicator? Crystal Clear Entry and Exit Points : No more guesswork. Our

멀티 타임프레임 지원, 사용자 정의 시각적 신호 및 구성 가능한 알림 시스템을 갖춘 Average True Range(ATR) 지표. 프리랜서 프로그래밍 서비스, 업데이트 및 기타 TrueTL 제품은 제 MQL5 프로필 에서 확인하실 수 있습니다. 피드백과 리뷰는 매우 감사하게 받겠습니다! ATR이란 무엇인가요? J. Welles Wilder가 개발한 Average True Range(ATR)는 시장 변동성을 측정하는 기술 지표입니다. 지정된 기간 동안의 True Range 평균을 계산합니다. True Range는 다음 중 가장 큰 값입니다: 현재 고가에서 현재 저가까지의 거리, 이전 종가에서 현재 고가까지의 거리, 또는 이전 종가에서 현재 저가까지의 거리. ATR은 가격 방향을 나타내지 않습니다 — 오직 변동성만 측정합니다. ATR이 상승하면 변동성 증가를 나타내고, ATR이 하락하면 변동성 감소를 신호합니다. 트레이더들은 ATR을 사용하여 시장 상황을 평가하고, 동적 손절매
FREE
Cycle Projection Pro is a cyclical analysis indicator for MetaTrader 5, designed for the Daily timeframe. It identifies and projects recurring price cycles forward in time, helping you estimate when — not how much — the market may be approaching a turning point. How it works The indicator sums six harmonic cycles with explicit periods — Weekly, Biweekly, Monthly, Quarterly, Semiannual, Annual — each independently adjustable and can be turned on or off. Their combination produces a composite wav
Auto Support and Resistances
Flavio Javier Jarabeck
4.56 (71)
Are you tired of drawing Support & Resistance levels for your Quotes? Are you learning how to spot Support & Resistances? No matter what is your case, Auto Support & Resistances will draw those levels for you! AND, it can draw them from other timeframes, right into you current chart, no matter what timeframe you are using... You can also Agglutinate regions/zones that are too much closer to each other and turning them into one single Support & Resistance Level. All configurable. SETTINGS Timefr
FREE
MarketX Dashboard
Alexandre Vincent Traber
4 (1)
Overview MarketX Dashboard는 MetaTrader 5용 강력한 올인원 시장 분석 인디케이터입니다. 단 하나의 거래를 진입하기 전에 모든 종목의 구조, 레짐, 통계적 특성을 이해하고자 하는 트레이더를 위해 설계되었습니다. 차트 위 깔끔한 탭 인터페이스에서 모든 것을 확인할 수 있습니다. 복잡하지 않습니다. 노이즈도 없습니다. 오직 시장만 있을 뿐입니다. 대부분의 인디케이터는 진입 지점을 찾는 데 사용됩니다. MarketX Dashboard는 거래 전에 정말 중요한 질문에 답합니다: 이 시장은 지금 추세인가요, 레인지인가요, 아니면 돌파 중인가요? 이 종목에서 통계적으로 가장 가능성 높은 되돌림 수준은 어디인가요? 시장 구조는 강세인가요, 약세인가요? 어느 세션에서 이 종목의 움직임이 가장 큰가요? 4개 모듈, 4개 탭, 하나의 창. 모든 종목과 모든 시간대에서 작동합니다. How it works REGIME (레짐) 추세추종, 평균회귀, 돌파, 스캘핑 4가지 전략
FREE
Title:FX-AIEA Supply and Demand Zone Indicator (MT5) — Technical Overview Version: 2.51 | Platform: MetaTrader 5 Introduction Supply and demand zones are considered a core manifestation of institutional order flow, providing a more direct reflection of buying and selling pressure than traditional support/resistance levels. This indicator attempts to automate the identification of high-probability supply and demand zones using an adaptive ZigZag algorithm, reducing the subjectivity and time asso
NeckLine Sentinel
Alex Amuyunzu Raymond
NeckLine Sentinel — AI-Scored Multi-Timeframe Head & Shoulders Scanner NeckLine Sentinel is a professional-grade pattern recognition engine built for traders who rely on classic chart formations but are tired of manually scanning charts for hours. Instead of watching one timeframe at a time, NeckLine Sentinel simultaneously monitors M15, M30, H1, H4, and D1 for both Head & Shoulders (bearish reversal) and Inverse Head & Shoulders (bullish reversal) patterns — and does it with a scoring system th
CV Support & Resistance is a professional support and resistance indicator for MetaTrader 5, designed to accurately identify key market and price zones. The indicator helps traders detect potential entry, exit, and reaction areas within the market at an early stage. Features: Automatic support and resistance zone detection Dynamic market structure analysis Professional visualization of key price areas Suitable for scalping, day trading, and swing trading Optimized for multiple symbols and timefr
WanaScalper
Isaac Wanasolo
1 (1)
A scalping indicator based on mathematical patterns, which on average gives signals with relatively small SL, and also occasionally helps to catch big moves in the markets (more information in the video) This indicator has three main types of notifications: The first type warns of a possible/upcoming signal on the next bar The second type indicates the presence of a ready signal to enter the market/open a position The third type is for SL and TP levels - you will be notified every time price re
BTC Trend Scalper MT5 Trend Capture Edition — BTCUSD를 위한 정밀 모멘텀 트레이딩 안녕하세요, 트레이더 여러분! 저는   BTC Trend Scalper MT5   — 규율 있는 리스크 관리로 모멘텀 움직임을 포착하도록 설계된 지능형 비트코인 트레이딩 전문가 자문(EA)입니다. 저는   마틴게일이 아닙니다 . 저는   그리드 시스템이 아닙니다 . 저는   도박 로봇이 아닙니다 . 저는   추세 추종 스캘퍼 입니다. 모든 캔들을 쫓는 것보다 자본을 보호하는 것이 더 중요하다는 것을 이해하는 트레이더들을 위해 특별히 제작되었습니다. 제 전문 분야는? 비트코인 (BTCUSD) 제 임무는? 높은 확률의 방향성 움직임을 포착하면서 리스크를 엄격하게 통제하는 것입니다. 왜 "추세 포착(Trend Capture)"인가? 많은 비트코인 EA가 고점과 저점을 예측하려고 합니다. 많은 스캘퍼가 모든 시장 변동을 과도하게 거래합니다. 저는 다른
Liquidity Oscillator
Paolo Scopazzo
3 (2)
A powerful oscillator that provide Buy and Sell signals by calculating the investor liquidity. The more liquidity the more buy possibilities. The less liquidity the more sell possibilities. Please download the demo and run a backtest! HOW IT WORKS: The oscillator will put buy and sell arrow on the chart in runtime only . Top value is 95 to 100 -> Investors are ready to buy and you should follow. Bottom value is 5 to 0 -> Investors are ready to sell and you should follow. Alert + sound will appe
BosMaster
Evgenii Savinov
제목: BOS MASTER MT5 설명: BOS MASTER는 **스마트 머니 컨셉 (SMC)**을 기반으로 한 전문적인 분석 도구입니다. 이 지표는 **구조 돌파 (BOS)**를 자동으로 감지하고 표시하여, 트레이더가 시장 방향의 변화와 추세 전환을 높은 정밀도로 식별할 수 있도록 돕습니다. 주요 특징: 자동 BOS 감지: 차트에서 주요 고점과 저점을 스캔하여 구조가 돌파되는 정확한 순간을 강조합니다. 대화형 필터 버튼: 차트에서 직접 '몸통 돌파(보수적)' 모드와 '꼬리 돌파(공격적)' 모드 사이를 전환할 수 있습니다. 시각적 레벨 표시: 돌파된 구조는 세련된 점선으로 표시됩니다 (상승은 파란색, 하락은 오렌지 레드). 신호 화살표: 현재 캔들에서 구조 돌파가 확인되면 차트에 명확한 화살표를 표시합니다. 즉각적인 알림: 내장된 사운드 알림 기능으로 거래 기회를 놓치지 마세요.
Heiken_Ashi_Bars - MT5용 고급 추세 시각화 도구 개요 Heiken_Ashi_Bars 는 시장의 노이즈를 필터링하고 진정한 기본 추세를 강조하도록 설계된 강력하고 시각적으로 직관적인 사용자 지정 지표입니다. 기존의 캔들스틱 차트는 불규칙하여 거짓 신호와 섣불린 청산을 유발할 수 있습니다. 이 지표는 가격 데이터를 평균화하여 가격 움직임을 부드럽게 만들어 추세 지속, 반전 및 수익성 있는 진입 구간을 훨씬 쉽게 파악할 수 있도록 해줍니다. 주요 기능 및 장점 강력한 노이즈 감소: 사소한 가격 급등 및 횡보 노이즈를 필터링합니다. 명확한 시각적 신호: 색상으로 구분된 막대를 통해 강세 및 약세 모멘텀을 한눈에 파악할 수 있습니다. 리페인트 없음 (No Repaint): 막대가 마감되면 신호가 고정됩니다. 과거 막대를 다시 계산하지 않습니다. 고도로 최적화됨: 터미널 지연이 없도록 깔끔하게 코딩되었습니다. 다양한 활용: 모든 금융 상품(외환, 지수, 금속, 암호화폐)에서
ATrend
Zaha Feiz
4.63 (19)
ATREND: 작동 방식 및 사용 방법 ### 작동 방식 MT5 플랫폼을 위한 "ATREND" 지표는 기술 분석 방법론의 조합을 활용하여 트레이더에게 강력한 매수 및 매도 신호를 제공하도록 설계되었습니다. 이 지표는 주로 변동성 측정을 위해 평균 진폭 범위(ATR)를 활용하며, 잠재적인 시장 움직임을 식별하기 위한 트렌드 탐지 알고리즘과 함께 사용됩니다. 구매 후 메시지를 남기면 특별 보너스 선물을 받게 됩니다. ### 주요 특징: - 동적 트렌드 탐지: 이 지표는 시장 트렌드를 평가하고 신호를 조정하여 트레이더가 현재 시장 상황에 맞춰 전략을 조정할 수 있도록 돕습니다. - 변동성 측정: ATR을 사용하여 시장의 변동성을 측정하며, 이는 최적의 손절매(SL) 및 이익 실현(TP) 수준을 결정하는 데 중요합니다. - 신호 시각화: 이 지표는 차트에 매수 및 매도 신호를 시각적으로 표시하여 트레이더의 의사 결정을 향상시킵니다. ### 운영 단계 #### 입력 및 설정 - TimeFr
Aurus Core
Dmitriq Evgenoeviz Ko
AURUS CORE: Multi-AI Consensus Architecture Aurus Core is more than just an advisor; it's a next-generation trading ecosystem built on the principle of multi-layered artificial intelligence consensus . The system is based on an architecture of four specialized AI agents, each responsible for a specific stage of trade filtering. AI Quartet (4-Layer Filter) Aurus Core opens a trade only when all four independent algorithms give an "APPROVED" signal: GEMINI Layer (Global Market Context): Analyzes
이 제품의 구매자들이 또한 구매함
Boba Analysis Suite
Trade Ready Solutions LLC
5 (1)
Boba Analysis Suite Boba Analysis Suite는 MetaTrader 5용 분석 지표입니다. 시장 구조, 주요 가격 영역, 전반적인 시장 상황을 하나의 차트 화면에 통합하여 표시합니다. 트레이더이자 트레이딩 코치로서의 실무 경험을 바탕으로 개발되었으며, 시장 방향 평가, 주요 가격 수준 식별, 여러 시간대의 종합적인 분석 등 체계적인 분석 과정을 지원합니다. 시장 맥락을 고려한 분석 개별 신호의 의미는 시장 상황에 따라 달라집니다. Boba Analysis Suite는 현재 차트 상황을 더 넓은 시장 구조와 연결하고, 사전에 정한 규칙에 따라 매매 아이디어를 검토할 수 있도록 돕습니다. 주요 분석 기능은 다음과 같습니다. 추세 및 시장 구조: 시장 방향과 관련 구조적 맥락을 평가합니다. 주요 가격 영역 및 수준: 추가 분석이 필요한 중요한 영역을 차트에 시각적으로 표시합니다. 여러 시간대: 서로 다른 시간대의 정보를 통합하여 전반적인 시장 상황을 평가합니다.
Neuro Poseidon MT5
Daria Rezueva
4.75 (52)
Neuro Poseidon is a new indicator by Daria Rezueva. It combines precise trading signals with adaptive TP/SL levels - creating best possible trades as a result! Message me and get  Neuro Poseidon Assistant  as a gift to automize your trading process! What makes it stand out? 1. Proven profitability on all assets and timeframes 2. Only confirmed BUY and SELL signals present on the chart 3. Adaptive TP & SL levels generated by the software for each trade 4. Easy to understand - suitable for al
ARIPoint
Temirlan Kdyrkhan
1 (4)
ARIPoint is a powerful trading companion designed to generate high-probability entry signals with dynamic TP/SL/DP levels based on volatility. Built-in performance tracking shows win/loss stats, PP1/PP2 hits, and success rates all updated live. Key Features: Buy/Sell signals with adaptive volatility bands Real-time TP/SL/DP levels based on ATR Built-in MA Filter with optional ATR/StdDev volatility Performance stats panel (Success, Profit/Loss, PP1/PP2) Alerts via popup, sound, push, or email Cu
Volatility Master for MetaTrader is a real-time dashboard tool that scans up to  50 symbols  to identify high-volatility , trending markets instantly. With bullish/bearish signals, customizable alerts, and a user-friendly interface, it helps you avoid range-bound conditions and focus on high-probability trades. Clarity leads to confidence. Trade confidently and protect your capital effectively with this powerful dashboard. We don't offer free or bonus indicators in exchange of reviews from you.
안녕하세요, 트레이더 여러분! 많은 개인 투자자들이 느린 웹 스크립트에 의존하고 있습니다. 수익성 있는 거래를 위해서는 체계적인 프레임워크가 필수적입니다. Astro AI 지표는 단순한 차트 오버레이가 아닙니다. 터미널에서 직접 실행되는 두 개의 에이전트로 구성된 정교한 신경망입니다. 시스템 기술 상세 설명: 1. 에이전트 1: 분석가 (그래픽 신경망 – GNN) 시장은 개별 가격 막대로 이루어진 것이 아니라 상호 연결된 데이터 네트워크입니다. 기능: 에이전트 1은 그래픽 신경망을 사용하여 이러한 복잡하고 비선형적인 관계를 파악합니다. 장점: 기존 지표는 과거 이동 평균만을 고려하는 반면, 저희 GNN은 시장의 심층적인 구조적 관계를 실시간으로 처리하여 개별 트레이더의 거래량이 시장에 큰 영향을 미치기 전에 숨겨진 상관관계를 찾아냅니다. 2. 에이전트 2: 실행기 (근접 전략 최적화 – PPO) 패턴 인식은 절반의 성공일 뿐입니다. 현재 시장 변동에 기반하여 올바른
차세대 외환 거래 도구. Dynamic Forex28 Navigator 는 오랫동안 인기를 끌어온 저희 인디케이터의 진화형으로, 세 가지 제품의 강력한 기능을 하나로 통합했습니다: Advanced Currency Strength28 Indicator (700개 리뷰) Advanced Currency IMPULSE with ALERT (530개 리뷰) CS28 Combo Signals (최근 보너스) 이제 MetaTrader 5 용으로 완전히 재구축되었습니다 – 더 빠르고, 더 부드러우며, MT5의 네이티브 멀티 심볼 아키텍처를 활용하도록 설계되었습니다. 사용자 매뉴얼: https://www.mql5.com/en/blogs/post/758844 MT4 버전을 찾으시나요? 여기를 클릭하세요: https://www.mql5.com/en/market/product/122172 차세대 강도 인디케이터가 제공하는 것 원본에서 사랑받았던 모든 기능이 새로운 기능과 더 높은 정밀도로 강화되었습니다
Ace Trend
Mikhail Sergeev
5 (3)
우리는 당신에게 트렌드 거래의 세계에서 게임의 규칙을 변경하는 혁신적인 지표를 제시한다. 이 표시기는 성능을 재고하고 거래 경험을 전례없는 높이로 높이도록 설계되었습니다. 우리의 표시기는 경쟁 업체와 차별화 된 고급 기능의 고유 한 조합을 자랑합니다. "실제 가격 요인"의 첨단 기술은 가장 어렵고 휘발성 시장 상황에서도 탁월한 안정성을 보장합니다. 불안정한 패턴,깨진 지표 및 의식적이고 통제 된 거래에 작별 인사를하십시오. 표시기는 단지 아름다운 그림이 아닙니다! 지표는 거래자의 편으로 확률을 이동시켜 이익을 얻어야 합니다. 표시 신호(완전 자동 모드)에 따라 거래 결과에 익숙해: https://www.mql5.com/ko/signals/2339244 표시기는 형성된 막대에 다시 그리지 않습니다. 막대가 형성된 경우 표시기 판독 값은 변경되지 않습니다. 이 표시기는 모든 시간대에 작동합니다. 표준은 시간대입니다. 귀하의 의견은 매우 중요합니다! 당신은 어떤 질문,제안이,또는 당신의
RelicusRoad Pro MT5
Relicus LLC
4.96 (25)
거래를 더 이상 감으로 하지 마세요. 언제 진입할지, 어디서 청산할지, 시장이 어느 쪽으로 기울어 있는지를 한 차트에서 확인하세요. RelicusRoad Pro는 20개 가까운 도구를 인디케이터 하나에 담았고, 내 매매 방식에 맞는 도구만 켜서 쓰면 됩니다. 명확한 진입. 명확한 청산. 차트마다 확실한 계획. 이런 경험, 익숙하지 않으신가요? 매수하면 1분 뒤 가격이 반대로 돌아섭니다. 너무 일찍 청산하고, 그다음 움직임이 나 없이 이어지는 것을 지켜봅니다. 지표를 5개 띄우면 답도 5가지가 나옵니다. 손절(스톱로스)은 그냥 감입니다. 우리가 이걸 만든 이유 우리는 18년 동안 외환 거래를 해 왔습니다. RelicusRoad는 처음에 우리끼리 쓰려고, 전문 트레이더 모임을 위해 비공개로 만들었습니다. 이유는 개인적이었습니다. 같은 선을 손으로 계속 그리는 일에 지쳤고, 스스로 정한 규칙을 어기고, 차트에서 정말 중요한 한 가지를 놓치곤 했습니다. 우리에게 통한 것은 일관성입니다. 매
UZFX {SSS} 스캘핑 스마트 시그널 v5.0 MT5는 급변하는 시장에서 정확한 실시간 시그널을 필요로 하는 스캘퍼, 데이 트레이더, 스윙 트레이더를 위해 설계된 리페인팅이 없는 고성능 트레이딩 지표입니다. (UZFX-LABS)에서 개발한 이 지표는 가격 움직임 분석, 추세 확인 및 스마트 필터링을 결합하여 모든 통화 쌍과 시간대에서 높은 확률의 매수 및 매도 신호, 경고 신호, 추세 지속 기회를 생성합니다. 거래에 대한 망설임을 멈추고, 명확성, 정밀성, 그리고 규율 있는 시장 실행을 원하는 트레이더를 위해 설계된 체계적인 신호 시스템을 따르기 시작하세요. 제 말을 믿으세요. 이 지표는 MQL5에서 구할 수 있는 최고의 지표 중 하나입니다. 그러니 절대 놓치지 마세요!! “현명한 트레이더를 위한 스마트 신호” 지금 최신 버전 5.0이 출시되었으며, 사전 공지 없이 가격이 최대 $499.99까지 인상될 수 있으니 기회를 놓치기 전에 서둘러 구매하세요!! 최종 구매 전! 무료 체
Mahra Pro Indicator MT5
Mahra Said Mohammed Al Kaabi
Mahra Pro Indicator MT5 Overview Mahra Pro is a MetaTrader 5 chart indicator designed to support structured analysis of XAUUSD (Gold). It combines trend, momentum, volatility and price-structure conditions to identify potential buy and sell setups and display them directly on the chart. The indicator does not open, modify or close trades. All trading decisions and order execution remain under the user's control. Main features • Buy and sell signal arrows on the chart. • Fast and slow EMA lines w
CGE Trading Suite
Carl Gustav Johan Ekstrom
5 (2)
Institutional-Grade Analytics for MT5 The full analytical edge of a professional trading desk, built into your MT5 chart. Standard retail platforms lack the depth required for professional market analysis. The CGE Trading Suite bridges this gap, transforming MetaTrader 5 into a comprehensive workspace. By integrating 22 proprietary modules into a single, unified chart interface, the suite eliminates fragmented analysis. It provides definitive clarity across market structure, timing, momentum,
The Oracle Pro
Ottaviano De Cicco
5 (1)
The Oracle Pro: Synthetic Multi-Timeframe Bias Engine for MT5 ️ Summer Launch Offer — Get The Oracle Pro for USD 199 (early buyers). Price rises with traction; final price USD 399. The Oracle Pro is a premium multi-timeframe bias engine for MetaTrader 5, built for demanding and professional traders. It answers one question with discipline: what is the directional bias on each timeframe right now, how strong is it, and how much do the timeframes agree? Everything is computed on closed bars only
IQ FX Gann Levels a precision trading indicator based on W.D. Gann’s square root methods . It plots real-time, non-repainting support and resistance levels to help traders confidently spot intraday and scalping opportunities with high accuracy. William Delbert Gann (W.D. Gann) was an exceptional market analyst, whose trading technique was based on a complex blend of mathematics, geometry, astrology, and ancient mathematics which proved to be extremely accurate. We don't offer free or bonus indic
Quant Direction MT5
Georgios Kalomoiropoulos
Quant Direction 은 3D 시장 분석 도구입니다. 다양한 매개변수에 걸쳐 정확한 백분율 편차를 계산하면서 완벽하게 객관적인 알고리즘 기반 시장 분석을 제공합니다. 첨단 AI 기반 모델링 도구와 엄격한 테스트를 거쳐 개발된 이 알고리즘은 타의 추종을 불허하는 정확도로 시장을 분석합니다. 플랫폼에서 모든 통화쌍 또는 금융 상품을 분석할 수 있습니다. 단기 거래, 데이 트레이딩, 스윙 트레이딩 등 어떤 유형의 거래를 하든 Quant Direction은 최적의 선택입니다. 운영자가 되는 것의 진정한 이점 퀀트 디렉션의 진정한 장점은 감정, 눈의 피로, 과도한 분석을 완전히 배제한다는 점입니다. 더 이상 수십 개의 차트를 일일이 살펴보며 방향을 찾거나 자신의 판단에 끊임없이 의문을 품을 필요가 없습니다. 이 시스템은 8개의 시간 간격(5개월에서 수개월까지)을 밀리초 단위로 처리합니다. 특정 시점의 주요 시장 참여자를 정확하게 식별하여 항상 성공 확률이 가장 높은 방향으로 거래할
Azimuth Pro
Ottaviano De Cicco
5 (7)
Azimuth Pro V2: Synthetic Fractal Structure and Confirmed Entries for MT5 Overview Azimuth Pro is a multi-level swing structure indicator by Merkava Labs . Four nested swing layers, swing-anchored VWAP, ABC pattern detection, three-timeframe structural filtering, and closed-bar confirmed entries — one chart, one workflow from micro-swings to macro-cycles. This is not a blind signal product. It is a structure-first workflow for traders who care about location, context, and timing. ️ Summer Sale
First time on MetaTrader, introducing IQ Star Lines, an original Vedic Astrology Based Intraday Trading Indicator. We don't offer free or bonus indicators in exchange of reviews from you. You won't need any free products with this indicator to make it work. ;) Enjoy! Welcome to the new and updated  IQ Star Lines , the ultimate fusion of ancient planetary cycles and modern quantitative trading, published for the first time on Metatrader. This is an indicator built by the developer, who has spent
푸시 스캘핑 - MetaTrader 5용 지표 푸시(Push)는 MetaTrader 5에서 매수/매도 신호를 식별하는 데 도움을 주는 지표로, 반전 조건과 푸시 신호 세트를 결합합니다. 신호는 시스템이 마감된 캔들을 확인했을 때만 나타나며 가격 차트에 직접 표시됩니다. 개요 푸시 스캘핑은 모멘텀, 구조 및 푸시 필터의 일치를 통해 단기 반전 설정을 관찰하는 데 도움을 주기 위해 설계되었습니다. 푸시 스캘핑은 XAUUSD를 사용하여 개발되었습니다. 이 지표는 차트에 연결된 심볼 및 시간 프레임의 데이터를 사용합니다. 각 시장 및 시간 프레임에서의 효과는 개별적으로 테스트해야 합니다. 푸시 스캘핑은 M1, M5 또는 M15 시간 프레임에서 XAUUSD를 사용한 스캘핑을 위해 개발되었습니다. 각 시장 및 더 높은 시간 프레임에서의 효과는 개별적으로 테스트해야 합니다. 마감된 캔들에 대한 확인: 이 지표는 진행 중인 캔들에 대해서는 신호를 발생시키지 않습니다. 캔들 형성이 완료된
Spike Fakeout Detector
Brighton Mufaro Mudzingwa
PainX 400 FAKEOUT DETECTOR MT5 Custom Indicator  ·  Sell-Side Bias  ·  Scalping  ·  RSI(6) Filtered   OVERVIEW   The Spike Fakeout Detector is a non repaint precision technical indicator built exclusively for Crash / PainX synthetic indices on the platform. It is engineered around one of the most consistent and exploitable patterns on this instrument — the false breakout above resistance followed by a sharp price drop. Crash/PainX is a growing index that produces a significant price drop appr
ARICoins
Temirlan Kdyrkhan
ARICoin is a powerful trading companion designed to generate high-probability entry signals with dynamic TP/SL/DP levels based on volatility. Built-in performance tracking shows win/loss stats, PP1/PP2 hits, and success rates all updated live. Key Features: Buy/Sell signals with adaptive volatility bands Real-time TP/SL/DP levels based on ATR Built-in MA Filter with optional ATR/StdDev volatility Performance stats panel (Success, Profit/Loss, PP1/PP2) Alerts via popup, sound, push, or email Cust
Gold Beaver Signals
Arnold Bobrinskii
Gold Beaver Signals 는 프로 브레이크아웃 로봇이 금 시장 어디에서 진입할지를 — 실제로 일어나기 전에 — 차트 위에 바로 보여줍니다. 라이브 증명 약속이 아닙니다. 동일한 전략이 언제든 확인할 수 있는 실제 공개 라이브 시그널에서 운영되고 있습니다: https://www.mql5.com/en/signals/2375536 무엇을 하는지, 쉽게 설명하면 이 인디케이터는 저희 트레이딩 로봇과 똑같은 방식으로 금을 관찰합니다. 중요한 레벨 아래에서 가격 압력이 쌓이면 차트에 브레이크아웃 라인 을 그립니다: 가격 위의 녹색 라인 — 가격이 이 레벨을 돌파하면 로봇은 매수합니다 가격 아래의 빨간 라인 — 가격이 이 레벨을 돌파하면 로봇은 매도합니다 모든 라인에 목표가(T1, T2, T3) 가 표시되어 거래의 목표를 항상 알 수 있습니다 여러 전략이 같은 레벨에서 일치하면 라인이 굵어집니다(x2, x3) — 더 강한 신호입니다 라인은 절대 리페인트되거나 다시 그려지지 않습니다.
Presenting one-of-a-kind Gann Indicator for XAUUSD IQ Gold Gann Levels is a non-repainting, precision tool designed exclusively for XAUUSD intraday trading. It uses W.D. Gann’s square root method to plot real-time support and resistance levels, helping traders spot high-probability entries with confidence and clarity. William Delbert Gann (W.D. Gann) was an exceptional market analyst whose trading technique was based on a complex blend of mathematics, geometry, astrology, and ancient calculation
GE Scalping Sniper
Jaturakoop Saoloek
• G signals are counter-move entries taken after an extended move. • E signals are entries in the direction of the prevailing trend. • Signals appear only after the candle has closed. A signal that is displayed will not disappear or move. 1. Entering a Trade Wait for the signal candle to close. Enter at the open of the next candle, or at the close of the signal candle if your platform allows it. Take only the signal types you have chosen to trade. Treat G and E as separate strategies with sepa
Gem SIGNAL
Shengzu Zhong
5 (1)
GEM Signal Pro GEM Signal Pro는 MetaTrader 5용 추세추종형 지표로, 차트에서 더 명확한 신호, 더 구조적인 트레이드 설정, 그리고 더 실용적인 리스크 관리를 원하는 트레이더를 위해 설계되었습니다. 단순한 화살표만 표시하는 것이 아니라, GEM Signal Pro는 전체 트레이드 아이디어를 더 깔끔하고 읽기 쉬운 방식으로 보여줍니다. 조건이 확인되면 진입가, 손절가, 목표가를 차트에 표시하여 트레이더가 설정을 더 효율적으로 검토할 수 있도록 도와줍니다. 작동 방식 이 지표는 먼저 내부 로직에 따라 유효한 초기 신호를 식별합니다. 확인 조건이 충족되면, GEM Signal Pro는 차트에 전체 설정을 표시합니다. 이를 통해 트레이더는 거래 구조를 더 명확하게 보고, 수동 분석 작업을 줄일 수 있습니다. 차트에 표시되는 거래 레벨 확인된 신호에 대해, GEM Signal Pro는 다음을 표시할 수 있습니다. 진입가 손절가 목표가 1 목표가 2 목표가 3 손
Chimera Volume
Marko Milenkovic
MetaTrader 5용 Chimera Volume 고급 거래량 분석 및 시장 활동 시각화 Chimera Volume은 MetaTrader 5 전용 사용자 정의 지표로, 정규화된 거래량 활동을 분석하고 역동적인 시각적 프레임워크를 통해 시장 참여도의 변화를 보여주도록 설계되었습니다. 이 지표는 적응형 정규화 알고리즘을 사용하여 틱 거래량 데이터를 처리하며, 다양한 시장 상황 속에서 거래량의 강도, 매집 단계, 활동 변화를 구조화된 형태로 생성합니다. 원시 거래량 값을 표시하는 일반 거래량 지표와 달리, Chimera Volume은 추가 계산을 적용하여 시장 활동의 상대적 변화를 강조하고 차트의 가독성을 향상시킵니다. 주요 기능 루트 인텐트 히스토그램 (Root Intent Histogram): 정규화된 거래량 강도와 시장 참여도를 시각화하는 동적 히스토그램입니다. 적응형 색상 전환을 사용하여 활동 증가 시기와 참여 감소 시기를 명확하게 구분합니다. 관성 라인 (Inertia Line
Meravith Scanner
Ivan Stefanov
5 (3)
MERAVITH SCANNER는 MetaTrader 5용 전문 금융 시장 지표로, 여러 분석 도구를 하나의 통합 시스템으로 결합합니다. 독점적인 거래량 가중 평균 가격(VWAP) 방법론을 사용하여 모든 계산을 자동으로 수행하며, 주관적인 해석을 완전히 배제합니다. 이 지표는 모든 자산 클래스(Forex, 주식, 지수, 상품, 암호화폐)와 M1부터 월간 차트까지 모든 시간 프레임에서 작동합니다. 기본 원리는 “가격은 거래량을 따른다”입니다. MERAVITH는 기관 거래량이 집중되는 위치를 식별하고, 그 집중에서 수학적으로 정확한 가격 수준을 도출합니다. 예측이나 투기를 하지 않으며, 계산만 수행합니다. MERAVITH SCANNER를 사용하면 28개의 주요 Forex 통화쌍을 모든 시간 프레임에서 단 2~3분 만에 스캔할 수 있습니다. 또한 원하는 시장을 스캔할 수도 있으며, 예를 들어 약 100개의 주식을 약 10분 안에 스캔할 수 있습니다. 지표는 소진 레벨, 균형선, 편차, 통계
The Louis SMC & Liquidity Master is a complete, institutional-grade market structure and liquidity mapping system built for MetaTrader 5. Designed for serious Smart Money Concepts (SMC) traders, this tool dynamically tracks multi-timeframe trends, supply and demand zones, and critical liquidity sweeps without cluttering your chart. Whether you trade major Forex currency pairs or highly volatile synthetic indices like Boom and Crash, the indicator automatically adapts to price action, filtering
TrendMaestro5
Stefano Frisetti
note: this indicator is for METATRADER4, if you want the version for METATRADER5 this is the link:  https://www.mql5.com/it/market/product/108106 TRENDMAESTRO ver 2.5 TRENDMAESTRO recognizes a new TREND from the start, he never makes mistakes. The certainty of identifying a new TREND is priceless. DESCRIPTION TRENDMAESTRO identifies a new TREND in the bud, this indicator examines the volatility, volumes and momentum to identify the moment in which there is an explosion of one or more of these da
Meravith MT5
Ivan Stefanov
5 (3)
MERAVITH는 MetaTrader 5용 멀티 타임프레임 거래량·유동성 지표로, 모든 타임프레임에서 추세, 지지와 저항 구간, 진입, 목표, 손절을 보여줍니다. 시장의 완전한 유동성 지도, 헤지펀드 스타일의 유동성 도구를 제공하며, 자체 거래량 가중 평균 가격 방식으로 모든 계산을 자동으로 수행하므로 주관적인 해석이 없습니다. 외환, 금(XAUUSD), 지수, 암호화폐에서 작동하며, 모든 타임프레임에서 사용할 수 있습니다. 구매 후 보너스: MERAVITH로 거래하는 방법에 대한 동영상 강의 모음. 구매 후 저에게 메시지를 보내주세요. MERAVITH의 기능 모든 타임프레임을 분석하고 각 타임프레임에서 현재 유효한 추세를 보여줍니다. 유동성 구간(Volume Equilibrium)을 표시합니다. 상승 거래량과 하락 거래량이 같아지는 지점입니다. 모든 타임프레임의 유동성 레벨을 차트에 직접 표시합니다. 참고용으로 시장의 텍스트 분석을 작성합니다. 현재 추세를 기준으로 진입, 목표,
Cycles Plotter
Edoardo Centorame
Cycles Plotter 이동 평균과 시작 날짜가 있는 사용자 지정 가능 사이클 지표 Cycles Plotter는 사용자의 입력에 의해서만 완전히 사용자 지정 가능한 두 개의 사인파 사이클을 그리는 고급 기술 지표입니다. 사이클을 자동으로 생성하지 않습니다. 모든 사이클은 사용자가 설정한 매개변수에만 기반하여 계산되며, 자동 신호나 예측을 생성하지 않고 가격 진동과 잠재적인 추세 변화를 연구하기 위한 시각적 도구를 트레이더에게 제공합니다. 핵심 사항: 사용자 정의 사이클: 사이클 1 P1 및 2 P2는 사용자가 완전히 구성할 수 있습니다. 사이클 길이, 진폭, 이동 평균, 정확한 시작 날짜와 시간을 설정할 수 있습니다. 사용자가 매개변수를 입력하지 않으면 어떤 사이클도 그려지지 않습니다. 진폭 제어: 각 사이클은 다른 진폭을 가질 수 있어 기준 이동 평균에 대한 진동의 높이를 조정할 수 있습니다. 추세 감지: 빠른 이동 평균과 느린 이동 평균은 사이클의 방향을 나타냅니다: Fast
AriX
Temirlan Kdyrkhan
1 (4)
AriX Indicator for MT5 A powerful trend-following and signal-evaluation tool AriX is a custom MT5 indicator that combines Moving Averages and ATR-based risk/reward logic to generate clear buy/sell signals. It visualizes dynamic SL/TP levels, evaluates past trade outcomes, and displays win/loss statistics in a clean on-chart panel. Key features include: Buy/Sell signals based on MA crossovers ATR-based SL/TP1/TP2/TP3 levels with visual lines and labels Signal outcome tracking with real-time stat
제작자의 제품 더 보기
Market Maker Reversal Scanner MT4
Siyasanga Stephen Mabokela
Market Maker Reversal Scanner — Multi-Symbol Daily Reversal Dashboard for MT4 By the time you've clicked through forty charts looking for a first red day at a monthly high, the setup you wanted has already closed. Market Maker Reversal Scanner reads your Market Watch, finds a fixed set of reversal and exhaustion patterns, scores each one on a transparent 10-point scale, and puts the results in a single sortable panel on one chart. You stop hunting. You start choosing. New in v12.1: a DAYS / SESS
Market Maker Signal Days MT4
Siyasanga Stephen Mabokela
Market Maker Signal Days v5.0: On-Chart Companion Indicator "Always think of your entry point as last night's close." – Paul Tudor Jones Introduction Attention: The Market Maker Reversal Scanner tells you which instruments to look at. Signal Days tells you what you're looking at once you get there. Version 5.0 now draws daily signals, liquidity levels and consolidation zones on the same chart, on a rebuilt engine. Interest: Attach it to any chart. It reads the daily timeframe, applies the same
TradeManager Pro MT4
Siyasanga Stephen Mabokela
Introduction Managing a trade by hand often means an order ticket, a lot calculator, a stop-loss to edit and a set of personal rules to keep in mind. Trade Manager Pro puts these tasks in one panel on your chart. It is a manual trade manager, not an automated strategy. You decide when to enter. The panel handles order entry, position sizing, stop management and the risk limits you set for yourself. Two design choices set it apart. First, it has a Real mode and a Virtual mode. Virtual mode is
Market Maker Signal Days MT5
Siyasanga Stephen Mabokela
Market Maker Signal Days v5.0: On-Chart Companion Indicator "Always think of your entry point as last night's close." – Paul Tudor Jones Introduction Attention: The Market Maker Reversal Scanner tells you which instruments to look at. Signal Days tells you what you're looking at once you get there. Version 5.0 now draws daily signals, liquidity levels and consolidation zones on the same chart, on a rebuilt engine. Interest: Attach it to any chart. It reads the daily timeframe, applies the same
Trade Manger PRO
Siyasanga Stephen Mabokela
Introduction Managing a trade by hand often means an order ticket, a lot calculator, a stop-loss to edit and a set of personal rules to keep in mind. Trade Manager Pro puts these tasks in one panel on your chart. It is a manual trade manager, not an automated strategy. You decide when to enter. The panel handles order entry, position sizing, stop management and the risk limits you set for yourself. Two design choices set it apart. First, it has a Real mode and a Virtual mode. Virtual mode is
필터:
리뷰 없음
리뷰 답변