Initial Balance Breakout

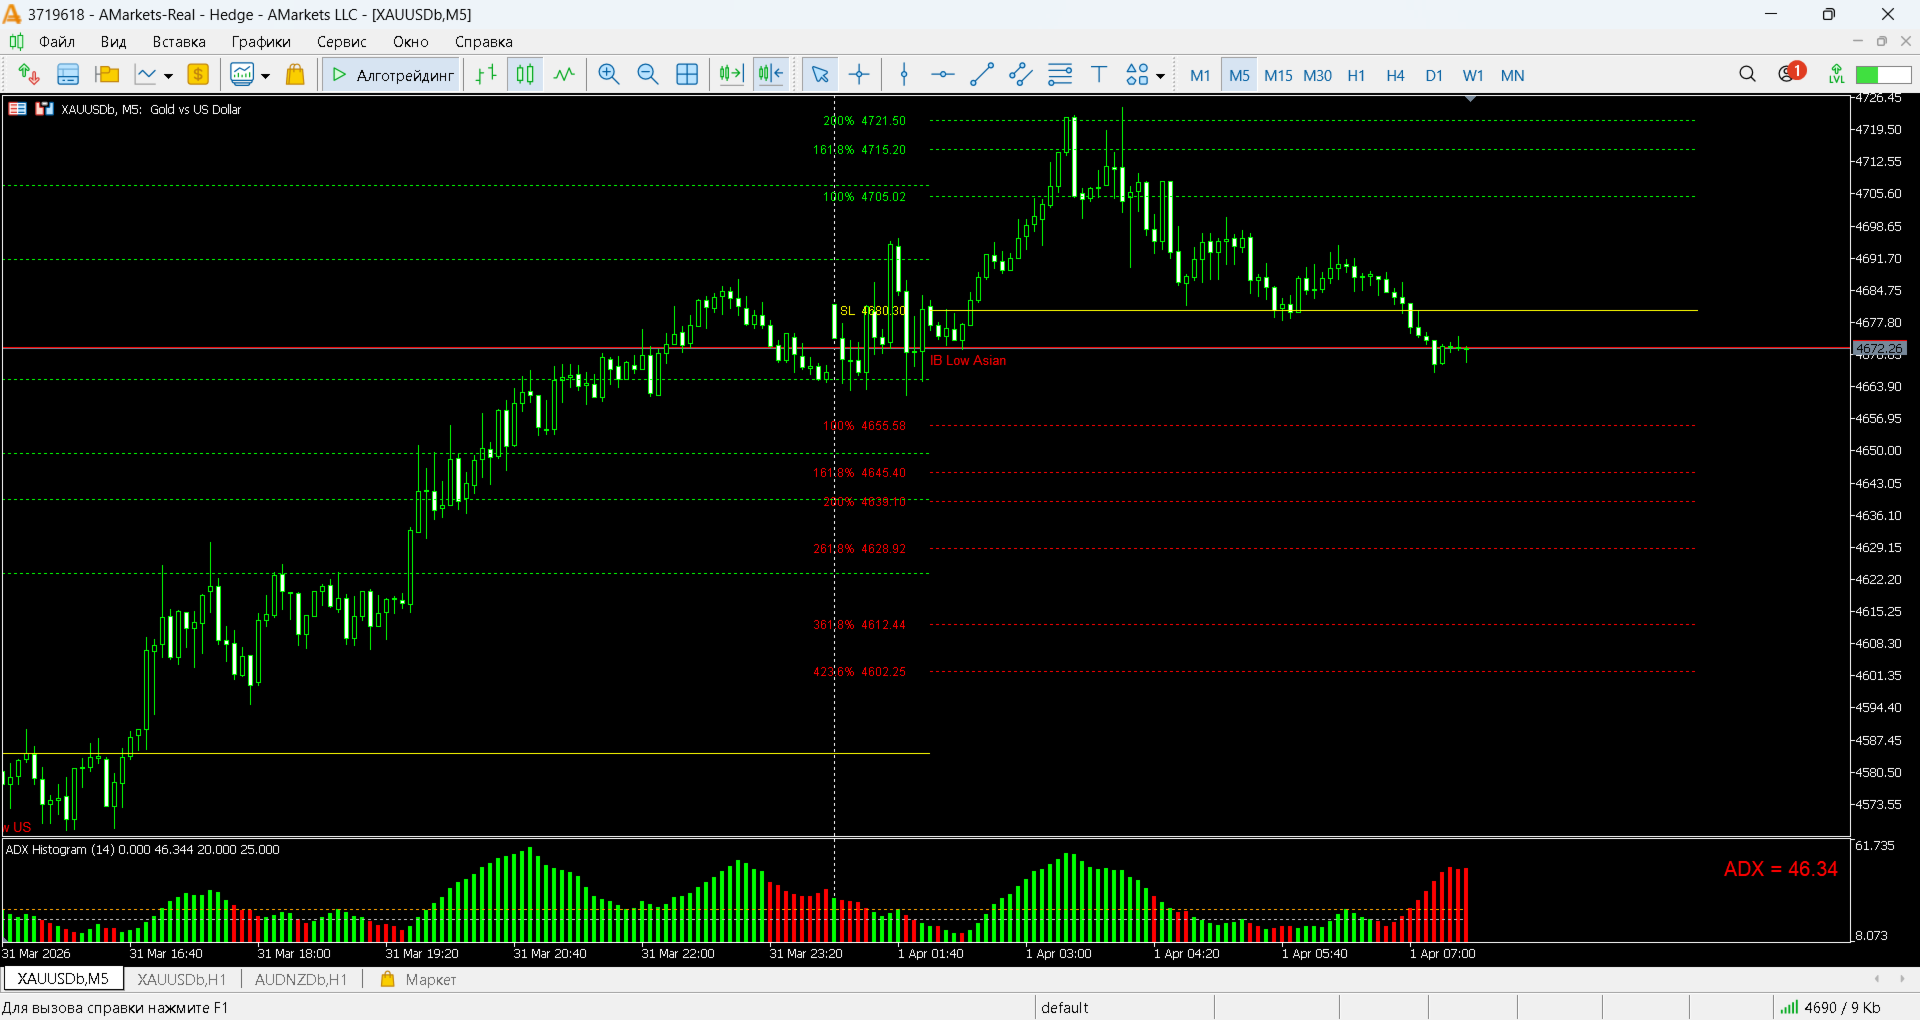
**Initial Balance Breakout** Professional indicator for displaying Initial Balance (IB) zones of the three major trading sessions: Asian, London, and US. The indicator automatically draws: - Initial Balance High and Low for each session - Optional filled IB zone - Session extension lines (up to the start of the next session) - Fibonacci extension levels (100%, 161.8%, 200%, 261.8%, 361.8%, 423.6%) - 50% level of the IB range (often used as Stop Loss) **Key Features:** - Clear visualization of Asian, London, and US Initial Balance ranges - Automatic server time offset detection (works with both summer and winter time) - Fibonacci extensions with 100% and 361.8% levels included - Customizable colors and display options - Clean and professional look suitable for any chart background - Supports any currency pairs, indices, and commodities **Advantages:** - Helps identify high-probability breakout zones - Shows potential take-profit and stop-loss levels using Fibonacci - Excellent tool for intraday and swing traders - Reduces chart clutter by displaying only relevant session information - Works on any timeframe (best results on M1–M15) **Parameters:** === Main Settings === - DaysToShow: Number of days to display IB (1-30) - UseSummerTime: Summer/Winter time adjustment (kept for compatibility) === Asian Session === - ShowAsian, AsianStart, AsianIBMinutes, AsianExtend === London Session === - ShowLondon, LondonStart, LondonIBMinutes, LondonExtend === US Session === - ShowUS, USStart, USIBMinutes, USExtend === Display Settings === - ShowIBZone, ShowLabels, ShowPriceLabels, ShowFib50 === Colors === - Customizable colors for IB zones, highs, lows, extensions and Fibonacci levels


추천 제품
DYJ BoS
Daying Cao
DYJ BoS 지표는 다음을 포함하여 시장 구조 변화의 필수 요소를 자동으로 식별하고 표시합니다. 구조 돌파(BoS): 가격이 크게 움직여 이전 구조 지점을 돌파할 때 감지됩니다. 상승 추세선과 하락 추세선(UP & DN, 즉 연속적인 신고가와 신저가)을 표시하고, 가격이 이러한 선을 돌파하면 빨간색(BEAR)과 초록색(BULL) 화살표를 표시합니다. BoS는 일반적으로 가격이 이전 가격 움직임에 의해 확립된 스윙 저점이나 스윙 고점을 확실히 통과할 때 발생합니다. 가격이 스윙 하이보다 높거나 스윙 로우보다 낮게 움직일 경우, 이는 단순히 이전에 형성된 시장 구조를 깨는 것이므로 "브레이크아웃" 구조라고 합니다. 이는 종종 시장 심리와 추세 방향의 변화를 나타내며, 기존 추세가 지속되거나 새로운 추세가 시작됨을 알립니다. 일반적으로 마감 정확도를 높이기 위해 손절매와 이익실현을 설정하지 않는 것이 좋습니다. 최종 포지션은 일반적으로 같은 방향의 다음 돌파점에서 마감되거나 반
LT Support Resistance - 지지와 저항을 100% 자동으로 식별 수동으로 지지와 저항선을 그리느라 귀중한 시간을 낭비하는 데 지치셨나요? 아니면 매번 중요한 레벨을 놓쳐서 답답하셨나요? LT Support Resistance는 이러한 번거로운 작업을 없애기 위해 개발되었습니다. 여러 타임프레임(시간족)을 동시에 분석하여, 거래 중인 자산의 가장 중요한 구역을 자동으로 식별하고 차트에 표시해 줍니다. == 중요 레벨의 스마트 자동화 == 주관적이고 시간이 오래 걸리는 수동 라인 작도 대신, 본 지표는 과거 가격 데이터를 분석하여 유의미한 반전 포인트를 식별하고, 가격이 '실제'로 신뢰하고 반응하는 지지 및 저항선을 그려줍니다. 그 결과 데이터에 기반한 객관적이고 신속한 분석이 가능해집니다. == 주요 특징 == 100% 자동 감지: 수동 분석 없이도 지지/저항 레벨 식별 멀티 타임프레임(MTF): M5 차트에서 H1, H4, D1, W1 레벨을 동시에 시각화 스마트 알
SMC Venom Model BPR 지표는 Smart Money(SMC) 개념 내에서 일하는 트레이더를 위한 전문 도구입니다. 가격 차트에서 두 가지 주요 패턴을 자동으로 식별합니다. FVG (공정 가치 갭)는 3개의 캔들의 조합으로, 첫 번째와 세 번째 캔들 사이에 갭이 있습니다. 이는 볼륨 지원이 없는 레벨 사이에 구역을 형성하여 종종 가격 수정으로 이어집니다. BPR (균형 가격 범위)은 두 개의 FVG 패턴의 조합으로, "브리지"를 형성합니다. 이는 가격이 낮은 볼륨 활동으로 움직일 때 브레이크아웃과 레벨로의 복귀 구역으로, 캔들 사이에 갭을 생성합니다. 이러한 패턴은 거래자가 차트에서 거래량과 가격 역학을 분석하여 주요 지지/저항 수준, 돌파 구역 및 진입 지점을 식별하는 데 도움이 되며, 여기서 대형 시장 참여자와 일반 참여자 간의 상호 작용이 발생합니다. 이 지표는 사각형과 화살표 형태로 패턴을 시각화하며 유연한 경고 설정도 지원합니다. 주요 특징: 패턴 표시 모드
우리의   Basic Support and Resistance   표시기는 기술 분석을 향상시키는 데 필요한 솔루션입니다.이 표시기는 차트/ MT4 버전 특징 피보나치 수준의 통합 : 지원 및 저항 수준과 함께 피보나치 수준을 표시하는 옵션과 함께, 우리의 지표는 시장 행동과 가능한 역전 영역에 대한 더 깊은 통찰력을 제공합니다. 성능 최적화 : 각 막대의 개구부에서만 확장 라인을 업데이트하는 옵션을 사용하여, 우리의 지표는 지원 및 저항 수준의 정확도를 희생하지 않고 최적의 성능을 보장합니다. 입력 주요 설정 Timeframe:  이 입력을 통해 차트에 더 높은 기간의 지지선과 저항선을 표시하도록 선택할 수 있습니다. Support/Resistance Strength [Number of Bars]:   이 입력을 사용하면 지지대와 저항의 강도를 결정할 수 있습니다.숫자가 높을수록지지/저항이 더 강해집니다. Price mode:  이 매개 변수를 사용하면 지원 및 저항 수준을
Harmonic Pattern Hunter
Shingidzano Lesetedi
Harmonic Pattern Hunter Harmonic Pattern Hunter is a technical indicator for MetaTrader 5 that automatically identifies and draws high-probability harmonic patterns directly on the chart. It is designed to assist traders who use harmonic analysis as part of their trading methodology. How It Works The indicator scans historical and live price data for completed XABCD harmonic structures using Fibonacci ratio validation. When a valid pattern is detected, it draws the full pattern geometry, marks t
Trade smarter, not harder: Empower your trading with Harmonacci Patterns This is arguably the most complete harmonic price formation auto-recognition indicator you can find for the MetaTrader Platform. It detects 19 different patterns, takes fibonacci projections as seriously as you do, displays the Potential Reversal Zone (PRZ) and finds suitable stop-loss and take-profit levels. [ Installation Guide | Update Guide | Troubleshooting | FAQ | All Products  ] It detects 19 different harmonic pric
QuickLineAlert
Aleksandr Poluchin
"QuickLineAlert" – Smart and Fast Price Level Indicator (MT5) "QuickLineAlert" is a tool designed for the MetaTrader 5 platform, created to maximize the speed and simplify the marking of price levels. It is perfectly suited for active traders (especially scalpers and day traders) who need to react instantly to market changes without long and tedious setups. You just press a button, place a line, and let the indicator do its job. Main Advantages: Fully Automated (No Need to Choose Direction) U
Max Min Delta Indicator - Market Volume Imbalance Analysis Gain Deeper Insights into Market Volume Imbalance with Delta Analysis What is the Max Min Delta Indicator? The Max Min Delta Indicator is a powerful market volume analysis tool that visually represents maximum and minimum delta values using a histogram. It helps traders identify market strength, weakness, absorption, and aggressive buying/selling activity with precision. Key Features Histogram Visualization: Displays Max Delta (Green) an
SPECIAL LAUNCH OFFER: $30 (1-Month Rent) Limited time offer to build our community and gather feedback! AmbM GOLD Institutional Scalper A high-precision M5 algorithm for XAUUSD (Gold) , engineered to trade exclusively at Institutional Liquidity Levels ($5/$10 psychological marks). PERFORMANCE DATA (BUY ONLY) • Win Rate: 87.09%. • Safe Growth: +$4,113 profit on $10k (13.75% Max Drawdown). • Extreme Stress Test: Successfully generated +$22,997 in a 5-year stress test (2020-2026), proving
Smart Daily Fibonacci MT5
Thushara Dissanayake
Smart Daily Fibonacci   is a   Daily Fibonacci Indicator for MT4 and MT5   that automatically draws   Fibonacci Retracement   and   Fibonacci Extension   levels using the previous trading day's high and low. Designed for   Forex traders ,   gold traders ,   index traders ,   cryptocurrency traders ,   scalpers ,   day traders ,   swing traders , and   prop firm traders , it helps create a structured daily trading framework without the need to manually draw Fibonacci tools every session. By trans
All Harmonics 26
Alexey Isavnin
3.5 (4)
Harmonic patterns are characteristic series of price movements with respect to Fibonacci levels, which statistically precede price reversals. This indicator searches for harmonic patterns. It is capable of recognising 26 classical and non-classical harmonic patterns : Classical Gartley Butterfly Alternate Butterfly Bat Alternate Bat Crab Deep Crab Three Drives Non-classical Shark Alternate Shark Cypher 5-0 Anti Gartley Anti Butterfly Anti Alternate Butterfly Anti Bat Anti Alternate Bat Anti Crab
Account flip mt5 bos choch
Presley Annais Tatenda Meck
Account flip mt5 bos choch  Account flip mt5 bos choch is a professional Smart Money Concept (SMC) structure indicator designed to help traders identify high-probability reversal opportunities using Break of Structure (BoS) and Change of Character (ChoCH) logic. The indicator automatically analyzes market structure, detects liquidity zones, and highlights potential trend reversals after liquidity build-up and structural shifts . It is built for traders who use price action, institutional order f
Welcome to the Ultimate Harmonic Patterns recognition indicator that is focused to detect advanced patterns. The Gartley pattern, Bat pattern, and Cypher pattern  are popular technical analysis tools used by traders to identify potential reversal points in the market. Our Ultimate Harmonic Patterns recognition Indicator is a powerful tool that uses advanced algorithms to scan the markets and identify these patterns in real-time. With our Ultimate Harmonic Patterns recognition Indicator, you ca
Auto Fractal Support And Resistance is a powerful multi-timeframe indicator designed for traders who want to trade lower timeframes with higher timeframe accuracy. When your mouse cursor is on a line you can easily see fractal describtion and index of fractal candle  and timeframe of that fractal candle.  This indicator automatically detects H1 and D1 fractal levels and draws clean horizontal support and resistance lines on any lower timeframe chart (M1, M5, M15, M30). Now you can see where the
M & W Pattern Pro is an advanced scanner for M and W patters , it uses extra filters to ensure scanned patterns are profitable. The indicator can be used with all symbols and time frames. The indicator is a non repaint indicator with accurate statistics calculations. To use , simply scan the most profitable pair using the statistics dashboard accuracy , then enter trades on signal arrow and exit at the TP and SL levels. STATISTICS : Accuracy 1 : This is the percentage of the times price hits TP
Awesome Oscillator by Bill Williams with the ability to fine-tune and replace the averaging algorithms of the indicator, which significantly expands the possibilities of using this oscillator in algorithmic trading and brings it closer in its properties to such an indicator as the MACD. To reduce price noise, the final indicator is processed with an additional Smooth averaging. The indicator has the ability to give alerts, send mail messages and push signals when the direction of movement of th
MySNR - Precision Support & Resistance Line Indicator Discounted   Price   $50  !!     Secure your lifetime access   now   before it switches to   subscription-only ! Tired of drawing levels manually or guessing where the price will react inside a thick, messy zone? Now you can save time and trade with absolute confidence using the MySNR Indicator . Unlike traditional tools that plot broad and ambiguous zones, MySNR is engineered to automatically plot exact, pinpoint Support and Resistance lines
Your Trend Friend
Luigi Nunes Labigalini
5 (1)
The trend is your friend! Look at the color of the indicator and trade on that direction. It does not  repaint. After each candle is closed, that's the color of the trend. You can focus on shorter faster trends or major trends, just test what's most suitable for the symbol and timeframe you trade. Simply change the "Length" parameter and the indicator will automatically adapt. You can also change the color, thickness and style of the lines. Download and give it a try! There are big movements w
Support & Resistance indicator is a modification of the standard Bill Williams' Fractals indicator. The indicator works on any timeframes. It displays support and resistance levels on the chart and allows setting stop loss and take profit levels (you can check the exact value by putting the mouse cursor over the level). Blue dashed lines are support level. Red dashed lines are resistance levels. If you want, you can change the style and color of these lines. If the price approaches a support lev
여러 심볼과 시간 프레임에서 수렴 쐐기 패턴을 자동으로 감지하세요 울프 파동은 기술적 분석에서 가장 강력하고 독특한 구조를 가진 패턴 중 하나입니다. 피보나치 비율에 의존하는 하모닉 패턴과 달리,   울프 파동은 순수한 기하학을 사용합니다   — 수렴하는 추세선이 가격이 어디로 갈지뿐만 아니라 언제 도달할지도 예측합니다. 이 내장된 가격과 시간 예측이 울프 파동을 트레이더가 사용할 수 있는 다른 어떤 패턴과도 다르게 만듭니다. 유효한 울프 파동을 수동으로 찾으려면 다섯 개의 피봇 포인트를 정확하게 식별하고 라인 1-3과 2-4가 진정으로 수렴하는지 신중하게 확인해야 합니다. 이 대시보드는 9개의 시간 프레임에서 최대 20개의 종목을 자동으로 스캔하고, 다섯 개의 피봇 포인트를 모두 감지하며, 완전한 패턴 기하학을 그리고, 유효한 울프 파동이 확인되는 순간 알림을 보내 그 수동 작업을 없애줍니다. 울프 파동이 독특한 이유 대부분의 패턴 기반 거래 도구는 외부 계산이나 피보나치 확장을
Support & Resistance Zone Indicator This indicator dynamically identifies and draws support and resistance zones based on recent price action and fractal patterns. By analyzing ZigZag pivot points and tracking price reactions (touches, bounces, and breaks), the indicator determines the strength and validity of each zone. Key Features: Multi-Timeframe Support: Can work across different timeframes. Fractal-Based Detection: Utilizes both fast and slow fractal detection to find significant swing po
MT5용 Crypto_Forex 지표 PINBAR 패턴, 재도색 및 지연 없음. - "PINBAR 패턴" 지표는 가격 변동 거래에 매우 강력한 지표입니다. - 이 지표는 차트에서 다음과 같은 핀바를 감지합니다. - 상승 핀바 - 차트에 파란색 화살표 신호(그림 참조). - 하락 핀바 - 차트에 빨간색 화살표 신호(그림 참조). -   PC 및 모바일 알림 기능 포함. - "PINBAR 패턴" 지표는 지지/저항 레벨과 결합하기 매우 좋습니다. ................................................................................ 여기를 클릭하여 고품질 트레이딩 로봇과 지표를 확인하세요! MQL5 웹사이트에서만 제공되는 오리지널 상품입니다.
이것은 가격 레이블이 있는 Advanced ZigZag Dynamic   및/또는   Extended Fractals   표시기 극값을 기반으로 하는 지원 및 저항 수준의 MTF 표시기입니다(비활성화 가능). MTF 모드에 대해 더 높은 TF를 선택할 수 있습니다. 기본적으로 레벨은 지그재그 표시 점을 기반으로 생성됩니다. 프랙탈 표시 점은 지그재그와 함께 또는 대신 사용할 수도 있습니다. 사용을 단순화하고 CPU 시간을 절약하기 위해 열릴 때 각 막대당 한 번씩 계산이 수행됩니다. 매개변수: ForcedTF - 레벨 계산을 위한 차트 타임프레임(현재와 같거나 초과할 수 있음) MinPipsLevelWidth - 포인트 단위의 최소 레벨 너비(매우 좁은 레벨에 사용) Use ZigZag Extremums points - 지그재그 피크를 사용하여 지원/저항 수준 계산을 활성화/비활성화합니다. Fixed pips range - 지그재그 표시기를 계산하기 위한 최소값과 최대값 사이의 거리
CosmiCLab FIBO
Kirils Subins
CosmiCLab SMC FIBO CosmiCLab SMC FIBO is a professional trading indicator designed for traders who use Smart Money Concepts (SMC), market structure analysis and Fibonacci retracement levels. The indicator automatically detects market swings and builds Fibonacci levels based on the latest impulse movement. It also identifies market structure changes such as BOS (Break of Structure) and CHOCH (Change of Character), helping traders understand the current market direction. CosmiCLab SMC FIBO also pr
Little useful tool - you manually select range on chart by dragging vertical blue lines and indicator shows support and resistance zones for this range and extends them outside of selected range.  Useful for: * Range trading * Range breakout * Range breakout & retest * Good entry during pullback in trend phase when previous high is retested * Good for scalping on short timeframes * Good for trades on longer timeframes around selected important zones like daily high or low
FREE
BlueDigitsFx 공식 생태계 액세스 인프라 업데이트, 트레이딩 리소스, 제품 출시 정보 및 BlueDigitsFx 공식 생태계에 대한 액세스를 받아보세요. Telegram 생태계 웹사이트 MT4 버전 BlueDigitsFx Spike And Strike Reversal MT5 — 시장 반전 및 모멘텀 분석을 위한 복합 오실레이터 BlueDigitsFx Spike And Strike Reversal 은 여러 지표 신호를 결합한 복합 오실레이터로, 트레이더가 잠재적인 시장 반전, 모멘텀 변화 및 추세 소진 상태를 식별할 수 있도록 돕습니다. 이 지표는 오실레이터 기반 확인 기능을 포함한 여러 분석 요소를 통합하며, 차트에 직접 시각적 신호를 표시하여 구조적인 반전 분석을 지원합니다. Spike And Strike는 다양한 시장 환경에서 반전, 되돌림 및 모멘텀 전환 구간에서 추가적인 확인을 원하는 트레이더를 위해 설계되었습니다. 주요 기능 오실레이터 기반의 시각적 반전
Market Shift Levels This indicator detects trend shifts and visualizes key market structure turning points using Hull Moving Average logic. It highlights potential areas of support and resistance where price is likely to react, empowering traders to spot early trend transitions. Market Shift Levels   are horizontal zones that mark the moment of a directional change in market behavior. These shifts are based on crossovers between two smoothed Hull Moving Averages (HMA), allowing the indicator
Double HMA MTF for MT5
Pavel Zamoshnikov
4 (4)
This is an advanced multi-timeframe version of the popular Hull Moving Average (HMA) Features Two lines of the Hull indicator of different timeframes on the same chart. The HMA line of the higher timeframe defines the trend, and the HMA line of the current timeframe defines the short-term price movements. A graphical panel with HMA indicator data from all timeframes at the same time . If the HMA switched its direction on any timeframe, the panel displays a question or exclamation mark with a tex
Pips ZigZag MT5
Stanislav Aksenov
The well-known ZigZag indicator that draws rays based on the "significant movement" specified by the pips parameter. If a ray appears, it will not disappear (the indicator is not redrawn), only its extremum will be updated until the opposite ray appears. You also can display text labels on each rays describing the width of the ray in bars and the length of the ray in points.
이 제품의 구매자들이 또한 구매함
Neuro Poseidon MT5
Daria Rezueva
4.98 (40)
Neuro Poseidon is a new indicator by Daria Rezueva. It combines precise trading signals with adaptive TP/SL levels - creating best possible trades as a result! Message me and get  Neuro Poseidon Assistant  as a gift to automize your trading process! What makes it stand out? 1. Proven profitability on all assets and timeframes 2. Only confirmed BUY and SELL signals present on the chart 3. Adaptive TP & SL levels generated by the software for each trade 4. Easy to understand - suitable for al
SuperScalp Pro
Van Minh Nguyen
4.67 (27)
SuperScalp Pro – 고급 멀티 필터 스캘핑 지표 시스템 SuperScalp Pro는 클래식 Supertrend와 여러 지능형 확인 필터를 결합한 고급 스캘핑 지표로, 거래 기회를 식별하는 데 도움을 줍니다. M1부터 H4까지 다양한 시간대에서 효율적으로 작동하며, XAUUSD, BTCUSD 및 주요 Forex 통화쌍에 최적화되어 있습니다. 이 지표는 명확한 매수 및 매도 신호를 제공하며, ATR 기반으로 진입가, 손절가, 익절가를 자동 계산하여 보다 효과적인 리스크 관리를 지원합니다. Fibonacci Take Profit 기능은 중요한 가격 구간에서 더 빠르게 포지션을 청산할 수 있도록 하며, 해당 수준 도달 시 알림을 전송합니다. 기본 설정은 Fibonacci Take Profit이 활성화된 상태로 최적화되어 있으며, 보다 안정적이고 일관된 거래 경험에 중점을 둡니다. 차트에 적용하는 것만으로 즉시 사용할 수 있습니다. 고급 사용자를 위해 모든 파라미터는 자유롭게 사용
SMC Intraday Formula
Kareem Abbas
5 (15)
먼저 솔직하게 말하겠습니다. 어떤 인디케이터도 단독으로 당신을 수익성 있게 만들어주지 않습니다. 누군가 그렇게 말한다면, 그는 당신에게 꿈을 파는 것입니다. 완벽한 매수/매도 화살표를 보여주는 모든 인디케이터는 완벽하게 보이도록 만들 수 있습니다 — 단지 올바른 과거 구간을 확대하고 승리한 거래만 캡처하면 됩니다. 우리는 그렇게 하지 않습니다.  SMC Intraday Formula는 도구입니다. 시장 구조를 읽고, 가장 높은 확률의 가격 구간을 표시하며, 현재 스마트 머니의 흐름이 어떻게 보이는지 아주 단순한 언어로 보여줍니다. 최종 결정은 여전히 당신이 합니다. 실행도 당신이 합니다. 하지만 이제는 희망이 아니라 정확성으로 거래하게 됩니다. 우리는 이 인디케이터를 지난 약 3년 동안 골드(XAUUSD) 및 주요 외환 통화쌍의 데이 트레이딩 스캘핑에 사용해 왔습니다. M1, M5, M15, M30에서 우리의 핵심 도구입니다. 이 도구는 미래를 예측하려 하지 않습니다 — 지금 형성
이 제품은 2026년 시장에 맞게 업데이트되었으며 최신 MT5 빌드에 최적화되었습니다. 가격 업데이트 안내: Smart Trend Trading System은 현재 $99 에 제공됩니다. 다음 30회 구매 후 가격은 $199 로 인상됩니다. 특별 혜택: Smart Trend Trading System 구매 후 저에게 개인 메시지를 보내시면 Smart Universal EA를 무료 로 받을 수 있으며, Smart Trend 신호를 자동 거래로 전환할 수 있습니다. Smart Trend Trading System은 리페인트 없음, 재그리기 없음, 지연 없음의 완전한 트레이딩 시스템으로, 더 깨끗한 신호, 더 나은 추세 방향, 그리고 더 체계적인 시장 거래 방식을 원하는 트레이더를 위해 제작되었습니다. Online course , manual and download presets . 이 시스템은 추세 감지, 반전 구간, Smart Cloud, 트레일링 스톱 로직, 지지와 저항, 캔들 색
Divergence Bomber
Ihor Otkydach
4.9 (90)
이 지표를 구매하신 분께는 다음과 같은 혜택이 무료로 제공됩니다: 각 거래를 자동으로 관리하고, 손절/익절 수준을 설정하며, 전략 규칙에 따라 거래를 종료하는 전용 도우미 툴 "Bomber Utility" 다양한 자산에 맞게 지표를 설정할 수 있는 셋업 파일(Set Files) "최소 위험", "균형 잡힌 위험", "관망 전략" 모드로 설정 가능한 Bomber Utility의 셋업 파일 이 전략을 빠르게 설치, 설정, 시작할 수 있도록 돕는 단계별 영상 매뉴얼 주의: 위의 모든 보너스를 받기 위해서는 MQL5 개인 메시지 시스템을 통해 판매자에게 연락해 주세요. 독창적인 커스텀 지표인 “Divergence Bomber(다이버전스 봄버)”를 소개합니다. 이 지표는 MACD 다이버전스(괴리) 전략을 기반으로 한 올인원(All-in-One) 거래 시스템입니다. 이 기술 지표의 주요 목적은 가격과 MACD 지표 간의 다이버전스를 감지하고, **향후 가격이 어느 방향으로 움직일지를 알려주는
Entry In The Zone and SMC Multi Timeframe is a real-time 2-in-1 market analysis tool that combines market structure analysis and a No Repaint BUY / SELL signal system into a single indicator, built on Smart Money Concepts (SMC) — a widely adopted framework used by professional traders to understand market structure. This indicator helps you see the market more clearly, make decisions based on structure rather than guesswork, and focus on high-probability zones where price is more likely to react
Quantum TrendPulse
Bogdan Ion Puscasu
5 (25)
SuperTrend   ,   RSI   ,   Stochastic   의 힘을 하나의 포괄적인 지표로 결합하여 트레이딩 잠재력을 극대화하는 궁극의 트레이딩 도구   인 Quantum TrendPulse를   소개합니다. 정밀성과 효율성을 추구하는 트레이더를 위해 설계된 이 지표는 시장 추세, 모멘텀 변화, 최적의 진입 및 종료 지점을 자신 있게 식별하는 데 도움이 됩니다. 주요 특징: SuperTrend 통합:   주요 시장 추세를 쉽게 따라가고 수익성의 물결을 타세요. RSI 정밀도:   매수 과다 및 매도 과다 수준을 감지하여 시장 반전 시점을 파악하는 데 적합하며 SuperTrend 필터로 사용 가능 확률적 정확도:   변동성이 큰 시장에서 숨겨진 기회를 찾기 위해 확률적 진동   을 활용하고 SuperTrend의 필터로 사용 다중 시간대 분석:   M5부터 H1 또는 H4까지 다양한 시간대에 걸쳐 시장을 최신 상태로 유지하세요. 맞춤형 알림:   맞춤형 거래 조건이 충족되면
Trend Catcher ind mt5
Ramil Minniakhmetov
5 (5)
트렌드 캐처 인디케이터 트렌드 캐처 인디케이터는 개발자가 자체 개발한 맞춤형 적응형 트렌드 분석 지표들을 조합하여 시장 가격 움직임을 분석합니다. 단기적인 노이즈를 제거하고 근본적인 모멘텀 강도, 변동성 확대, 가격 구조 움직임에 집중하여 진정한 시장 방향을 파악합니다. 또한 이동 평균, RSI, 변동성 필터와 같은 맞춤형 지표들을 활용하여 가격을 평활화하고 트렌드를 필터링합니다. 실제 운영 모니터링 및 기타 제품은 다음 링크에서 확인하실 수 있습니다:   https://www.mql5.com/en/users/mechanic/seller 텔레그램에서는 EA나 설정 파일을 판매하지 않습니다. 사기이니 주의하세요. 모든 설정 파일은 블로그에서 무료로 제공됩니다. 중요! 구매 후 즉시 연락 주시면 사용 방법 및 보너스를 드립니다!
M1 Quantum MT5
Hamed Dehgani
5 (3)
개발자 공지: 129달러 가격의 라이선스가 1개만 남아 있습니다. 해당 라이선스가 판매되면 가격은 149달러 로 인상됩니다. M1 Quantum 은 M1 전용 전문 트레이딩 시스템으로, 손절(Stop Loss), 익절(Take Profit), 그리고 스마트 자금 관리 기능이 내장된 빠르고 정확한 거래 신호를 제공합니다. M1 Quantum 은 연속 수익 거래 에 집중하여 계좌를 빠르게 성장시키도록 설계된 전문 자금 관리 시스템을 포함하고 있습니다. M1 Quantum 인디케이터 의 주요 기능 M1 타임프레임 및 모든 주요 통화쌍 용으로 설계됨 모든 거래에 손절과 익절 적용 자금 관리 시스템 이 포함되어 트레이더가 쉽게 거래할 수 있도록 안내 높은 승률 및 높은 연속 수익률 리페인트 없음, 지연 없음 모든 트레이더가 쉽게 이해 가능 M1 Quantum 을 사용하려면 M1 Quantum Assistant 가 필요합니다. 이 강력한 도구는 모든 M1 Quantum 구매자에게 무료로 제공
PrimeScalping
Temirlan Kdyrkhan
PrimeScalping is a powerful trading companion designed to generate high-probability entry signals with dynamic TP/SL/DP levels based on volatility. Built-in performance tracking shows win/loss stats, PP1/PP2 hits, and success rates — all updated live. Key Features: Buy/Sell signals with adaptive volatility bands Real-time TP/SL/DP levels based on ATR Built-in MA Filter with optional ATR/StdDev volatility Performance stats panel (Success, Profit/Loss, PP1/PP2) Alerts via popup, sound, push, or e
FX Trend MT5 NG
Daniel Stein
5 (6)
FX Trend NG: 차세대 멀티 마켓 트렌드 인텔리전스 개요 FX Trend NG 는 다중 시간 프레임 기반의 전문 트렌드 분석 및 시장 모니터링 도구입니다. 몇 초 만에 전체 시장 구조를 파악할 수 있도록 설계되었습니다. 여러 차트를 일일이 전환할 필요 없이, 어떤 종목이 추세에 있는지, 어디에서 모멘텀이 약화되고 있는지, 그리고 어떤 시간 프레임이 서로 정렬되어 있는지 즉시 확인할 수 있습니다. 출시 기념 특별 혜택 – FX Trend NG 를 $30 (6개월) 또는 $80 평생 라이선스 로 이용할 수 있습니다. 이미 Stein Investments 고객이신가요? -> 메시지를 보내 전용 고객 그룹에 참여하세요. 설정이나 사용 방법이 필요하신가요? -> Stein Investments 공식 페이지 를 방문하세요. 1. FX Trend NG가 특별한 이유 3단계 추세 로직 – 단순한 Buy / Sell이 아닙니다 • 대부분의 지표는 Buy 또는 Sell 두 가지 상태만 제
Power Candles MT5
Daniel Stein
5 (8)
Power Candles V3 - 자체 최적화 강도 지표 파워 캔들 V3는 적용된 모든 차트에서 통화 및 상품의 강세를 실행 가능한 거래 계획으로 전환합니다. 단순히 캔들에 색상을 입히는 대신, 백그라운드에서 실시간 자동 최적화를 수행하여 현재 보고 있는 종목에 대한 최적의 손절매, 익절 및 신호 임계값을 제공합니다. 한 번의 클릭으로 실시간 거래에 적용할 수 있으며, 진입점, 손절매 및 익절 선이 정확한 가격에 맞춰 차트에 표시되고, 방향과 함께 알림이 발령됩니다. 이 도구는 Stein Investments 에코시스템의 일부입니다. 18개 이상의 도구와 함께 당신의 1대1 AI 트레이딩 멘토 Max.  항상 대기 중, 모든 인디케이터를 깊이 있게 이해, 무언가를 차근차근 생각해보고 싶은 순간에 도움을 줍니다.  https://stein.investments 에서 만나보세요 매 종가 바마다 3,000회 이상의 트레이딩 시뮬레이션. 9가지 강도 상태. 2가지 전략을 병렬로 테스트.
Gann Made Easy MT5
Oleg Rodin
5 (6)
Gann Made Easy 는 mr.의 이론을 사용하여 최고의 거래 원칙을 기반으로 하는 전문적이고 사용하기 쉬운 Forex 거래 시스템입니다. W.D. 간. 이 표시기는 Stop Loss 및 Take Profit Levels를 포함하여 정확한 BUY 및 SELL 신호를 제공합니다. PUSH 알림을 사용하여 이동 중에도 거래할 수 있습니다. 구매 후 거래 방법 안내 및 유용한 추가 지표를 무료로 받으시려면 저에게 연락주세요! 아마도 Gann 거래 방법에 대해 이미 여러 번 들었을 것입니다. 일반적으로 Gann의 이론은 초보자 거래자뿐만 아니라 이미 거래 경험이 있는 사람들에게도 매우 복잡한 것입니다. Gann의 거래 방식은 이론적으로 적용하기 쉽지 않기 때문입니다. 나는 그 지식을 연마하고 Forex 지표에 최고의 원칙을 적용하기 위해 몇 년을 보냈습니다. 표시기는 적용하기가 매우 쉽습니다. 차트에 첨부하고 간단한 거래 권장 사항을 따르기만 하면 됩니다. 지표는 지속적으로 시장 분석
SignalTech is an unique fully rule based trading system delivers an Institutional approach for both Independent Traders and Prop Firm Challengers. Never Repaint. Push Notification available. No over-optimization. All the winning trades with chart setups are published on the comments page. 2026-05 4107 Pips (Until 05-29 NY Closed) 2026-04 2243 Pips 2026-03 2165 Pips 2026-02 2937 Pips 2026-01 2624 Pips 2025-12 1174 Pips It can generate signals with Buy/Sell Arrows, Push Notification (To Mobile) an
GoldenX Entry MT5
Kareem Abbas
5 (12)
GoldenX Entry는 MT5용 인디케이터로, 적응형 Smart Entry Trend 알고리즘, 신호 스코어링 시스템, 시장 레짐 감지 기능, 그리고 변동성 필터를 포함합니다. 각 신호에는 계산된 진입 레벨, 3개의 익절(TP1, TP2, TP3) 레벨, 그리고 손절(Stop-Loss) 레벨이 포함됩니다. 이 인디케이터는 다양한 시장 환경에 적응하도록 설계된 다중 분석 레이어 구조 위에 구축되어 있으며, 내장 최적화기와 통계 추적 시스템을 결합합니다. 또한 Risk-to-Reward(RR) 지표와 과거 거래 행동 기반의 정량 분석을 제공합니다. 시작은 간단합니다 — 선택한 타임프레임에서 최적화기를 실행한 뒤 차트에서 바로 인디케이터를 사용하면 됩니다. 핵심 기능 GoldenX Entry는 하나의 차트에서 신호 엔진, 트레이드 관리 기능, 그리고 과거 통계 추적을 통합합니다: - 내장 최적화기: 최적화기는 차트에서 원클릭으로 실행됩니다. 200개의 파라미터 조합을 두 단계 탐색
Atomic Analyst MT5
Issam Kassas
4.26 (35)
이 제품은 2026년 시장에 맞게 업데이트되었으며 최신 MT5 빌드에 최적화되었습니다. 가격 업데이트 안내: Atomic Analyst는 현재 $99 에 제공됩니다. 다음 30회 구매 후 가격은 $199 로 인상됩니다. 특별 혜택: Atomic Analyst 구매 후 저에게 개인 메시지를 보내시면 Smart Universal EA를 무료 로 받을 수 있으며, Atomic Analyst 신호를 자동 거래로 전환할 수 있습니다. Atomic Analyst는 리페인트 없음, 재그리기 없음, 지연 없음의 Price Action 거래 인디케이터로, 수동 거래, 신호 명확성, EA 자동화를 위해 설계되었습니다. User manual: settings, inputs and strategy. 가격 움직임, 강도, 모멘텀, 다중 시간대 방향 및 고급 필터를 분석하여 트레이더가 노이즈를 줄이고 약한 세팅을 피하며 더 체계적인 거래 결정을 내릴 수 있도록 돕습니다. 이 인디케이터는 복잡한 시장 계산
이 제품은 2026년 시장에 맞게 업데이트되었으며 최신 MT5 빌드에 최적화되었습니다. 가격 업데이트 안내: Smart Price Action Concepts는 현재 $200 에 제공됩니다. 다음 30회 구매 후 가격은 $299 로 인상됩니다. 특별 혜택: 구매 후 저에게 개인 메시지를 보내시면 무료 보너스 + 선물 을 받을 수 있습니다. 먼저, 이 트레이딩 도구는 리페인트 없음, 재그리기 없음, 지연 없음의 인디케이터이므로 전문적인 트레이딩에 적합하다는 점을 강조하고 싶습니다. Online course , and manual Smart Price Action Concepts Indicator는 초보자와 경험 많은 트레이더 모두에게 매우 강력한 도구입니다. 20개 이상의 유용한 인디케이터를 하나로 결합하고, Inner Circle Trader Analysis와 Smart Money Concepts Trading Strategies 같은 고급 트레이딩 아이디어를 통합합니다. 이 인디
Gem SIGNAL
Shengzu Zhong
5 (1)
GEM Signal Pro GEM Signal Pro는 MetaTrader 5용 추세추종형 지표로, 차트에서 더 명확한 신호, 더 구조적인 트레이드 설정, 그리고 더 실용적인 리스크 관리를 원하는 트레이더를 위해 설계되었습니다. 단순한 화살표만 표시하는 것이 아니라, GEM Signal Pro는 전체 트레이드 아이디어를 더 깔끔하고 읽기 쉬운 방식으로 보여줍니다. 조건이 확인되면 진입가, 손절가, 목표가를 차트에 표시하여 트레이더가 설정을 더 효율적으로 검토할 수 있도록 도와줍니다. 작동 방식 이 지표는 먼저 내부 로직에 따라 유효한 초기 신호를 식별합니다. 확인 조건이 충족되면, GEM Signal Pro는 차트에 전체 설정을 표시합니다. 이를 통해 트레이더는 거래 구조를 더 명확하게 보고, 수동 분석 작업을 줄일 수 있습니다. 차트에 표시되는 거래 레벨 확인된 신호에 대해, GEM Signal Pro는 다음을 표시할 수 있습니다. 진입가 손절가 목표가 1 목표가 2 목표가 3 손
UZFX {SSS} 스캘핑 스마트 시그널 MT5는 급변하는 시장에서 정확한 실시간 시그널을 필요로 하는 스캘퍼, 데이 트레이더, 스윙 트레이더를 위해 설계된 리페인팅 없는 고성능 트레이딩 지표입니다. (UZFX-LABS)에서 개발한 이 지표는 가격 움직임 분석, 추세 확인, 스마트 필터링 기능을 결합하여 모든 통화 쌍과 시간대에서 확률이 높은 매수 및 매도 시그널을 생성합니다. 추천* 최적 시간대: 15분 이상. {1시간}이 제가 가장 선호하는 시간대입니다. 그리고 그 결과는 정말 놀라울 정도입니다...! 참고: { LTL 164343 } 지표와 함께 사용하면 신호 적중률을 높일 수 있습니다. LTL 신호를 통해 추세를 파악하고, SSS 신호를 진입 신호로 활용하세요. 이 접근 방식은 승률을 극대화하고 오신호를 방지하는 데 도움이 됩니다. 주요 기능 스마트 신호 감지 – 강력한 추세 반전 및 지속 패턴을 정밀하게 식별합니다. 다중 시간대 스캘핑 – 모든 시간대에서 완벽하게 작동
ARIPoint
Temirlan Kdyrkhan
1 (1)
ARIPoint is a powerful trading companion designed to generate high-probability entry signals with dynamic TP/SL/DP levels based on volatility. Built-in performance tracking shows win/loss stats, PP1/PP2 hits, and success rates all updated live. Key Features: Buy/Sell signals with adaptive volatility bands Real-time TP/SL/DP levels based on ATR Built-in MA Filter with optional ATR/StdDev volatility Performance stats panel (Success, Profit/Loss, PP1/PP2) Alerts via popup, sound, push, or email Cu
Crystal Heikin Ashi Signals
Muhammad Jawad Shabir
5 (2)
Crystal Heikin Ashi Signals - Professional Trend & Signal Detection Indicator Advanced Heikin Ashi Visualization with Intelligent Signal System for Manual & Automated Trading Final Price: $149 ---------> Price goes up $10 after every 10 sales . Limited slots available — act fast . Overview Crystal Heikin Ashi Signals is a professional-grade MetaTrader 5 indicator that combines pure Heikin Ashi candle visualization with an advanced momentum-shift detection system. Designed for both manual traders
Azimuth Pro
Ottaviano De Cicco
5 (7)
Azimuth Pro V2: Synthetic Fractal Structure and Confirmed Entries for MT5 Overview Azimuth Pro is a multi-level swing structure indicator by Merkava Labs . Four nested swing layers, swing-anchored VWAP, ABC pattern detection, three-timeframe structural filtering, and closed-bar confirmed entries — one chart, one workflow from micro-swings to macro-cycles. This is not a blind signal product. It is a structure-first workflow for traders who care about location, context, and timing. V2 Launch Offe
KURAMA GOLD SIGNAL PRO (MT5) — 7중 필터 · 자동 TP/SL · 품질 점수 · 시그널 기록 저장 | XAUUSD 완전 트레이딩 시스템 실시간 리페인트 없음. 시그널이 나타나는 순간 화살표, 진입, TP, SL이 그 자리에 고정되어 이후 절대 움직이지 않습니다. 여러분이 거래하는 것은 바로 이 실시간 시그널입니다. 그리고 v7.20에서는 실제로 발신된 모든 시그널이 자동 저장되어 재시작 후에도 정확히 복원됩니다. 구매자 전용 보너스 평생 라이선스를 구매하시면 AI Zone Radar($59 상당) + 완전 PDF 매뉴얼을 무료로 드립니다. 제품 가격에 더해 $59 상당의 보너스가 따라옵니다. 구매 후 MQL5로 메시지를 보내주세요. AI Zone Radar: https://www.mql5.com/en/market/product/175834 골드 트레이더 커뮤니티에서 실제로 사용되며 정확성과
Quant Direction MT5
Georgios Kalomoiropoulos
Quant Direction 은 3D 시장 분석 도구입니다. 다양한 매개변수에 걸쳐 정확한 백분율 편차를 계산하면서 완벽하게 객관적인 알고리즘 기반 시장 분석을 제공합니다. 첨단 AI 기반 모델링 도구와 엄격한 테스트를 거쳐 개발된 이 알고리즘은 타의 추종을 불허하는 정확도로 시장을 분석합니다. 플랫폼에서 모든 통화쌍 또는 금융 상품을 분석할 수 있습니다. 단기 거래, 데이 트레이딩, 스윙 트레이딩 등 어떤 유형의 거래를 하든 Quant Direction은 최적의 선택입니다. 운영자가 되는 것의 진정한 이점 퀀트 디렉션의 진정한 장점은 감정, 눈의 피로, 과도한 분석을 완전히 배제한다는 점입니다. 더 이상 수십 개의 차트를 일일이 살펴보며 방향을 찾거나 자신의 판단에 끊임없이 의문을 품을 필요가 없습니다. 이 시스템은 8개의 시간 간격(5개월에서 수개월까지)을 밀리초 단위로 처리합니다. 특정 시점의 주요 시장 참여자를 정확하게 식별하여 항상 성공 확률이 가장 높은 방향으로 거래할
Market Structure Order Block Dashboard MT5는 시장 구조와 주요 가격 반응 구역을 차트에서 직접 읽고자 하는 트레이더를 위해 설계된 MT5 지표입니다. BOS, ChoCH, 오더 블록, Fair Value Gap (FVG), 유동성, Kill Zones, Volume Profile 그리고 빠른 분석을 위한 콤팩트한 대시보드를 결합합니다. 이 지표는 시장 구조, ICT 및 Smart Money 개념을 의사결정 프레임워크로 사용하는 트레이더를 대상으로 합니다. 추세 지속, 가능한 반전, 가격 불균형, 유동성 타겟 및 관심 구역을 보다 체계적으로 식별하는 데 도움을 줄 수 있습니다. 구매자를 위한 포함 리소스 구매 후 MQL5 개인 메시지로 요청하시면 완전한 PDF 사용 설명서와 파라미터 설정 팁을 제공해 드립니다. MQL5 개인 메시지를 통한 직접 기술 지원. 1.20 버전은 두 가지 주요 추가 기능을 제공합니다: Pending BOS / Pending
Meridian Pro
Ottaviano De Cicco
5 (2)
Meridian Pro 2.00: Professional Multi-Timeframe Trend Matrix for MT5 Meridian Pro 2.00 is a professional adaptive trend matrix for MetaTrader 5. It combines the original Meridian trend engine, a clean chart ribbon, closed-bar signal arrows, an 8-timeframe dashboard, Fuel momentum, weighted consensus, synthetic HTF processing and chart-native higher-timeframe context lines. The goal is simple: read current trend, multi-timeframe structure, strength, momentum and EA-ready state from one discipline
FX Volume MT5
Daniel Stein
4.79 (24)
FX Volume: 브로커 시각에서 바라보는 진짜 시장 심리 간단 요약 트레이딩 접근 방식을 한층 더 향상시키고 싶으신가요? FX Volume 는 소매 트레이더와 브로커의 포지션을 실시간으로 파악할 수 있게 해 줍니다. 이는 COT 같은 지연된 보고서보다 훨씬 빠릅니다. 꾸준한 수익을 추구하는 분이든, 시장에서 더 깊은 우위를 원하시는 분이든, FX Volume 을 통해 대규모 불균형을 찾아내고, 돌파 여부를 확인하며 리스크 관리를 정교화할 수 있습니다. 지금 시작해 보세요! 실제 거래량 데이터가 의사결정을 어떻게 혁신할 수 있는지 직접 경험해 보시기 바랍니다. 1. 트레이더에게 FX Volume이 매우 유익한 이유 탁월한 정확도를 지닌 조기 경보 신호 • 다른 사람들보다 훨씬 앞서, 각 통화쌍을 매수·매도하는 트레이더 수를 거의 실시간으로 파악할 수 있습니다. • FX Volume 은 여러 리테일 브로커에서 추출한 실제 거래량 데이터를 종합해 명확하고 편리한 형태로 제공하는
Grabber System MT5
Ihor Otkydach
4.83 (24)
탁월한 기술적 지표인 Grabber를 소개합니다. 이 도구는 즉시 사용 가능한 “올인원(All-Inclusive)” 트레이딩 전략으로 작동합니다. 하나의 코드 안에 강력한 시장 기술 분석 도구, 매매 신호(화살표), 알림 기능, 푸시 알림이 통합되어 있습니다. 이 인디케이터를 구매하신 모든 분들께는 다음의 항목이 무료로 제공됩니다: Grabber 유틸리티: 오픈 포지션을 자동으로 관리하는 도구 단계별 영상 매뉴얼: 설치, 설정, 그리고 실제 거래 방법을 안내 맞춤형 세트 파일: 인디케이터를 빠르게 자동 설정하여 최고의 성과를 낼 수 있도록 도와줍니다 다른 전략은 이제 잊어버리세요! Grabber만이 여러분을 새로운 트레이딩의 정점으로 이끌어 줄 수 있습니다. Grabber 전략의 주요 특징: 거래 시간 프레임: M5부터 H4까지 거래 가능한 자산: 어떤 자산이든 사용 가능하지만, 제가 직접 테스트한 종목들을 추천드립니다 (GBPUSD, GBPCAD, GBPCHF, AUDCAD, AU
소개       Quantum Breakout PRO   , 브레이크아웃 존 거래 방식을 변화시키는 획기적인 MQL5 지표! 13년 이상의 거래 경험을 가진 숙련된 트레이더 팀이 개발한       퀀텀 브레이크아웃 PRO       혁신적이고 역동적인 브레이크아웃 존 전략으로 거래 여정을 새로운 차원으로 끌어올리도록 설계되었습니다. Quantum Breakout Indicator는 5개의 이익 목표 영역이 있는 브레이크아웃 영역의 신호 화살표와 브레이크아웃 상자를 기반으로 한 손절 제안을 제공합니다. 초보자 거래자와 전문 거래자 모두에게 적합합니다. Quantum EA 채널:       여기를 클릭하세요 중요한! 구매 후 설치 매뉴얼을 받으려면 개인 메시지를 보내주십시오. 추천: 기간: M15 통화쌍: GBPJPY, EURJPY, USDJPY,NZDUSD, XAUUSD 계정 유형: 스프레드가 매우 낮은 ECN, Raw 또는 Razor 브로커 시간: GMT +3 중개인 :
SmartScalping
Temirlan Kdyrkhan
SmartScalping is a powerful trading companion designed to generate high-probability entry signals with dynamic TP/SL/DP levels based on volatility. Built-in performance tracking shows win/loss stats, PP1/PP2 hits, and success rates — all updated live. Key Features: Buy/Sell signals with adaptive volatility bands Real-time TP/SL/DP levels based on ATR Built-in MA Filter with optional ATR/StdDev volatility Performance stats panel (Success, Profit/Loss, PP1/PP2) Alerts via popup, sound, push, or e
제작자의 제품 더 보기
MACD + ADX Confluence Indicator (Short English description)Purpose Highlights strong trending candles where MACD and ADX give a confluence signal. Colors candles and places arrows only when both conditions are met.Main logic & signalsBullish signal (blue candle + blue ↑ arrow) MACD main line > 0 and ADX > selected level Bearish signal (red candle + red ↓ arrow) MACD main line < 0 **and** ADX > selected level Neutral candles When confluence is absent → candles keep default chart colors (no overl
ADX Histogram Trend Alert Colorful ADX Histogram + Alert on Strong Trend Description: A modern and clear visual indicator based on the classic ADX (Average Directional Index) that shows trend strength and direction in a completely new, easy-to-read format. Key Features: • Wide colored histogram instead of a regular ADX line → Green bars = bullish/uptrend (+DI > -DI) → Red bars = bearish/downtrend (-DI > +DI) • Current ADX value is always displayed in the top-right corner of the indicator window
MultiTF ADX RSI MACD Panel Multi-timeframe dashboard for instant trend and momentum analysis This indicator displays the current readings of three classic technical tools (ADX, RSI, MACD) simultaneously across eight timeframes from M5 to MN1 in one compact table. The main goal is to quickly identify strong, aligned market moves when the majority of timeframes show signals in the same direction. What the panel shows for each timeframe: • TF — timeframe • ADX — ADX value (green > 25 — strong tren
MTF OpenClose Levels Pro is a professional multi-timeframe indicator of support and resistance levels based on Open and Close prices of previous bars from higher timeframes. Key advantage: automatic detection of strong clusters (confluence zones) where levels from multiple timeframes (H1, H4, D1, W1, MN) are located very close to each other. Main features: • Displays Open and Close levels of previous bars (adjustable lookback — default 3 bars) • Highlights strong clusters (minimum 3 coinciding
<p><strong>ATR Trailing EA v1.05</strong></p> <p>Professional Expert Advisor based on the Average True Range (ATR). Especially well optimized for <strong>XAUUSD (Gold)</strong> — one of the most popular and volatile instruments.</p> <p>The EA automatically calculates ATR-based Stop Loss and Take Profit, moves the trade to breakeven and applies a dynamic ATR Trailing Stop to protect profits.</p> <h3>Key Advantages:</h3> <ul> <li><strong>Excellent performance on Gold (XAUUSD)</strong></li> <li>Sm
Gold ATR Pro EA — Professional Volatility-Based Expert Advisor for Gold (XAUUSD) Gold ATR Pro is a clean and powerful MT5 Expert Advisor specially designed for trading XAUUSD. The EA places all pending orders (Buy Stop, Buy Limit, Sell Stop, Sell Limit) exactly at a distance of 1 ATR from the current price and uses dynamic ATR-based risk management. ### Advantages • Precise pending orders at 1 ATR distance • ATR-based Stop Loss and Take Profit with adjustable multipliers • Convenient draggable c
Daily ATR Range + Percent + Daily Open Professional indicator that displays dynamic price levels based on Daily Average True Range (ATR) calculated from the Daily Open price. Key Features: • Automatic Daily ATR calculation with optional outlier filter • Key percentage levels: 25%, 50%, 75%, 100%, 150% of Daily ATR • Daily Open line with customizable style and color • Clear labels positioned on the left side of each level • Informative panel showing ATR value, expected move, distance to levels a
**MultiTF Confluence Dashboard v1.34** Professional multi-timeframe dashboard with intelligent weighted signal system. The indicator analyzes ADX, RSI and MACD simultaneously on 8 timeframes and provides ready trading signals taking into account the strength of each component. **Key Advantages:** - Smart weighting system — higher timeframes have more influence - Colored signal background (green for BUY, red for SELL) - Confidence percentage displayed with every signal - One-time alerts only — n
Monthly Atr Range
Shavkat Ilxomov
Displays monthly expected price ranges based on ATR with percentage levels (+25% to +200%) from the current monthly open. Includes a clean information panel with key statistics. Monthly ATR Range + Percent + Monthly Open v1.1 This powerful monthly indicator helps traders visually see the expected price movement for the current month based on the Average True Range (ATR). Key Features: • Shows percentage-based levels from the Monthly Open: +25%, +50%, +80%, +100%, +150%, +200% (upper) and corres
Weekly Atr Range
Shavkat Ilxomov
Displays weekly expected price ranges based on ATR with percentage levels (+25% to +200%) from the current weekly open. Includes a clean information panel with key statistics. Weekly ATR Range + Percent + Weekly Open v1.1 Powerful weekly indicator that helps traders visually see the expected price movement for the current week based on the Average True Range (ATR). Key Features: • Shows percentage-based levels from the Weekly Open: +25%, +50%, +80%, +100%, +150%, +200% (upper) and corresponding
필터:
리뷰 없음
리뷰 답변