SR Breakout Trend Detector
- 지표
-
Paolo Ruffini
 저는 외환(Forex) 및 원자재 시장에서 15년 이상의 실전 경험을 보유한 트레이더로, 특히 유동성의 동적 구조, 거래량 기반 시장 압력, 그리고 가격의 방향성 구조 분석에 중점을 두고 있습니다.
수년간 저는 재량적 분석을 자체 개발한 정량적 도구와 점진적으로 통합해 왔으며, 실제 시장 참여도를 측정하는 데 초점을 맞춘 지표를 개발해 왔습니다. - 버전: 1.20
SR Breakout Trend Detector is a technical indicator for MetaTrader 5 that combines confirmed support and resistance levels with filtered breakout signals. It helps traders assess market structure, identify breaks beyond established levels, and evaluate those breaks against candle strength, volatility and trend direction.
The indicator is designed for chart analysis and decision support. It does not open, manage or close trades.
SUPPORT AND RESISTANCE STRUCTURE
The indicator identifies local highs and lows using configurable pivot confirmation settings. Levels can be calculated from candle wicks or candle bodies.
A pivot is confirmed only after the selected number of right-hand bars has closed. This introduces a deliberate confirmation delay: the indicator waits for the structure to develop before recognizing a new pivot.
Nearby pivots can be merged into the current support or resistance level using an ATR-based tolerance. Additional settings control the minimum number of touches and the minimum and maximum level age required for breakout eligibility.
BREAKOUT SIGNALS ON CLOSED CANDLES
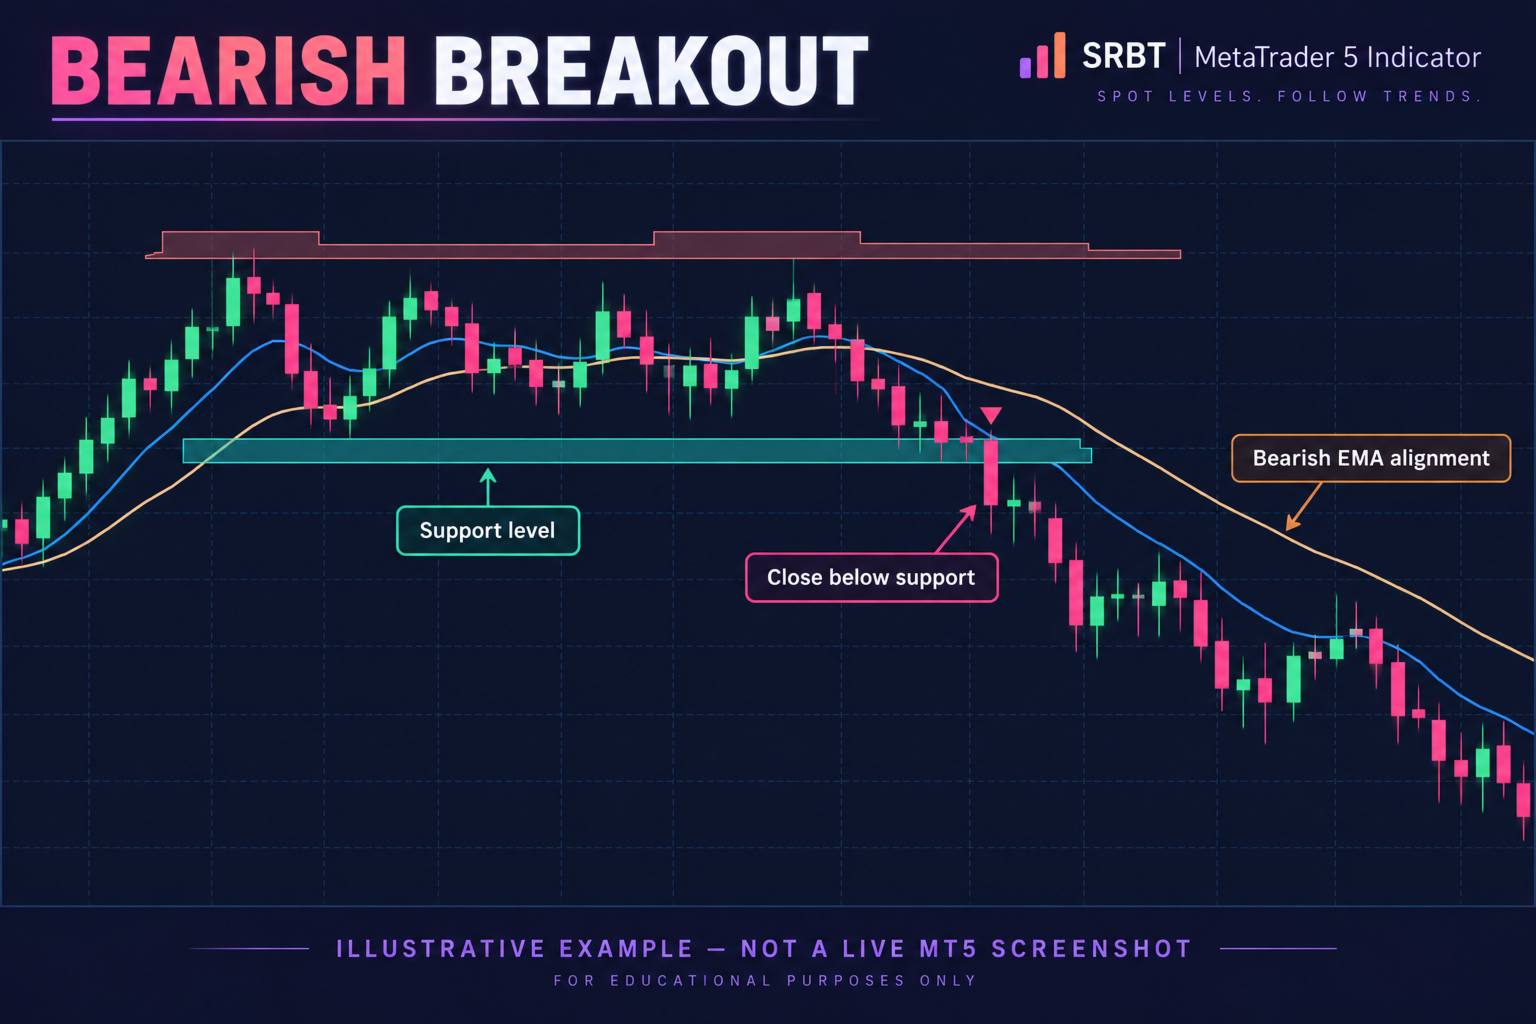
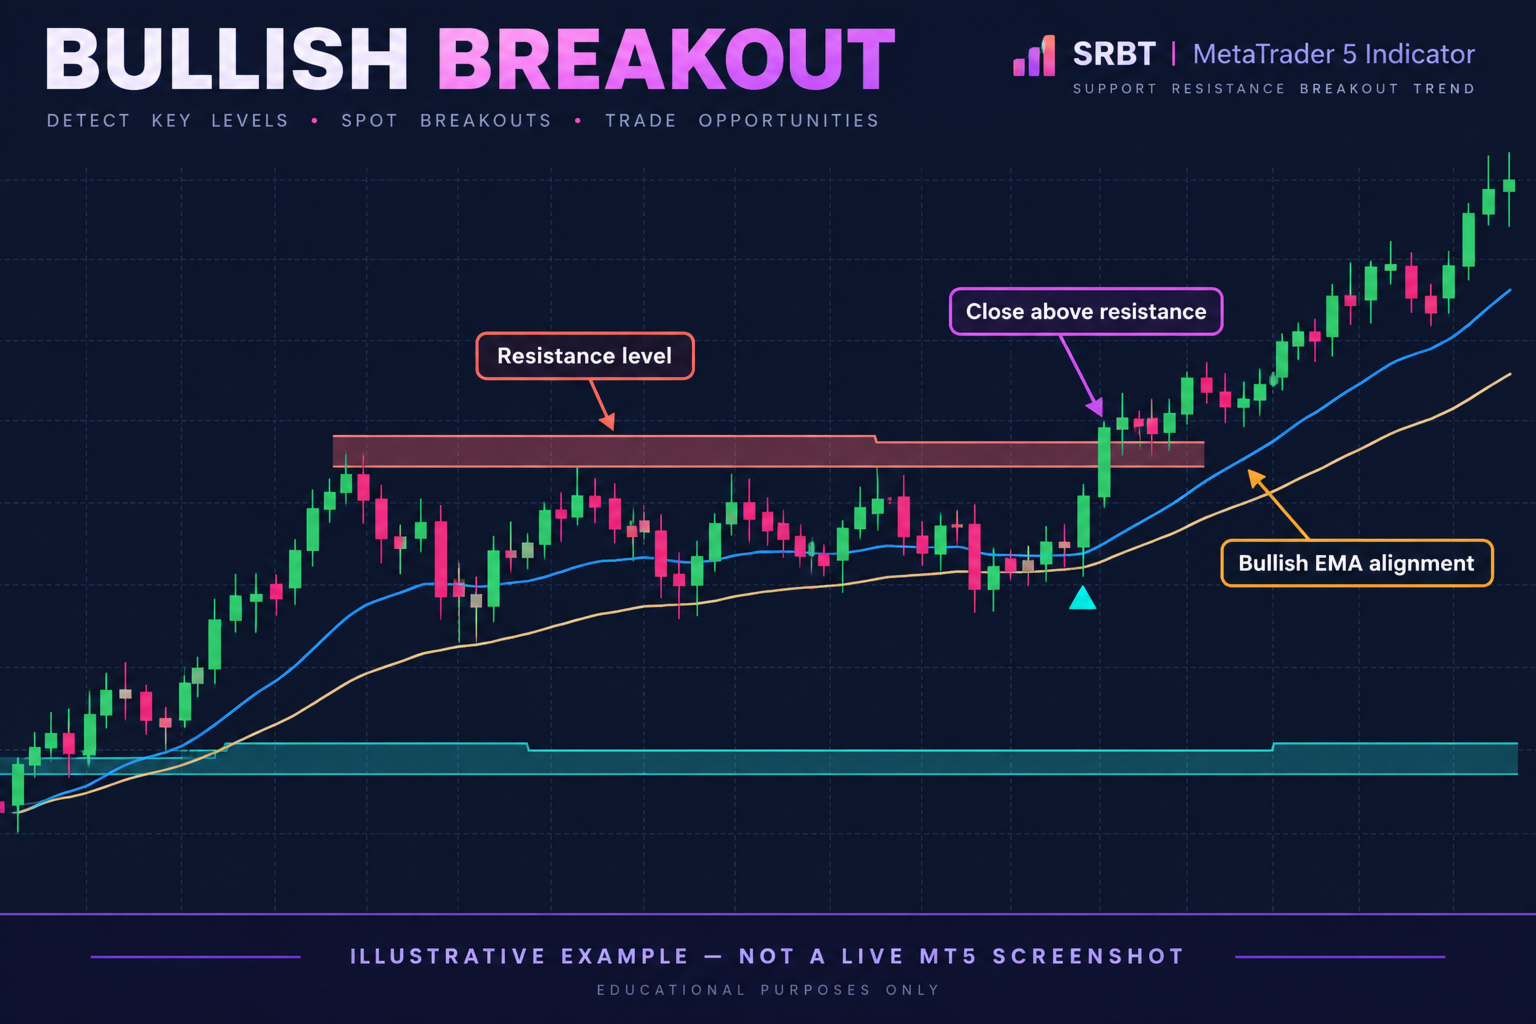
A bullish breakout requires a candle to close above resistance plus a confirmation buffer. A bearish breakout requires a close below support minus that buffer.
The buffer combines an ATR-based distance with a minimum distance expressed in the symbol’s price ticks. This allows the threshold to reflect both market volatility and the instrument’s minimum price increment.
Signals are evaluated on closed candles. A price movement beyond a level during an unfinished candle does not, by itself, produce a confirmed signal.
Separate cooldown tracking for bullish and bearish signals helps control repeated signals in the same direction.
CONFIGURABLE BREAKOUT FILTERS
Candle quality
Evaluate the candle’s direction, body-to-range ratio and closing position within its range.
Volatility impulse
Require the breakout candle’s true range to meet a configurable threshold relative to ATR.
Tick volume
Optionally require tick volume to exceed its moving average by a selected multiplier. Tick volume represents quotation activity supplied by the broker, rather than centralized traded volume.
EMA trend alignment
For bullish signals, optionally require price above the fast EMA and the fast EMA above the slow EMA. For bearish signals, require the opposite alignment.
Higher-timeframe confirmation
Optionally compare a confirmed higher-timeframe close with its EMA. When enabled, the selected confirmation timeframe must be higher than the chart timeframe.
These filters can be configured independently to suit different approaches to breakout analysis.
CLEAR CHART DISPLAY
The indicator displays:
• Support and resistance lines.
• ATR-based zones around those levels.
• Fast and slow exponential moving averages.
• Bullish and bearish breakout arrows.
• A dashboard summarizing the latest closed-bar conditions.
The default palette uses coral resistance levels, teal support levels and subdued zone fills. Zone intensity, level thickness, EMA colors and signal colors are adjustable.
Zone colors blend with the chart background to keep price action readable. Levels, zones, moving averages and the dashboard can be shown or hidden separately.
DASHBOARD INFORMATION
The dashboard shows the chart timeframe, EMA bias, current displayed support and resistance, level touch counts, broken or active status, higher-timeframe filter status and ATR.
Touch counts describe the indicator’s internal structure tracking; they are not confidence percentages.
A level may be marked as broken without a signal arrow appearing. This occurs when the underlying price break is detected but one or more signal filters reject it.
CALCULATION AND RESPONSIVENESS
The optimized version reconstructs market structure when a new chart candle begins, while keeping intrabar EMA updates lightweight.
A configurable historical calculation window controls how much data is reconstructed. The default setting is 3,000 bars, with additional preparation data used internally.
Changing this window may change reconstructed levels, touch counts and historical signals because the calculation begins from a different starting point.
CUSTOMIZATION
Key settings include:
• Left and right pivot confirmation bars.
• Wick-based or body-based levels.
• Nearby-level merging and ATR tolerance.
• Minimum touches and level age limits.
• Zone width and breakout confirmation distance.
• Candle body and closing-position requirements.
• ATR impulse and tick-volume filters.
• Fast and slow EMA periods.
• Higher-timeframe EMA confirmation.
• Signal cooldown.
• Historical calculation window.
• Chart colors, zone intensity and line thickness.
ALERTS
Optional notifications include terminal pop-up alerts, mobile push notifications and sound alerts.
Mobile push notifications require the appropriate MetaTrader 5 notification settings. Alerts are associated with qualifying closed-bar signals.
GETTING STARTED
-
Attach the indicator to your preferred symbol and chart timeframe.
-
Review the pivot, level and breakout settings.
-
Enable the filters relevant to your analysis.
-
If using higher-timeframe confirmation, select a timeframe above the chart timeframe.
-
Adjust zone intensity and display options for your chart theme.
-
Observe how levels and signals develop as candles close.
The indicator can be applied to XAUUSD and other instruments available through your MetaTrader 5 broker. Suitable settings depend on the symbol’s volatility, tick size, trading session and chart timeframe.
IMPORTANT CHARACTERISTICS
Closed-bar signal evaluation does not imply that every historical display value is permanently fixed. The indicator reconstructs a rolling historical window, and changes to settings, available history or the calculation window can alter the displayed results.
Support and resistance zones use ATR in both their display and touch-detection logic. To change only their visual prominence, adjust zone intensity rather than the ATR zone-width parameter.
SR Breakout Trend Detector provides rule-based technical analysis. Its arrows are filtered breakout indications, not probabilities of success or guarantees of future price movement.