Gold MTF
- 지표
-
Paolo Ruffini
 저는 외환(Forex) 및 원자재 시장에서 15년 이상의 실전 경험을 보유한 트레이더로, 특히 유동성의 동적 구조, 거래량 기반 시장 압력, 그리고 가격의 방향성 구조 분석에 중점을 두고 있습니다.
수년간 저는 재량적 분석을 자체 개발한 정량적 도구와 점진적으로 통합해 왔으며, 실제 시장 참여도를 측정하는 데 초점을 맞춘 지표를 개발해 왔습니다. - 버전: 1.10
- 업데이트됨: 16 8월 2026
Gold MTF Market Dashboard
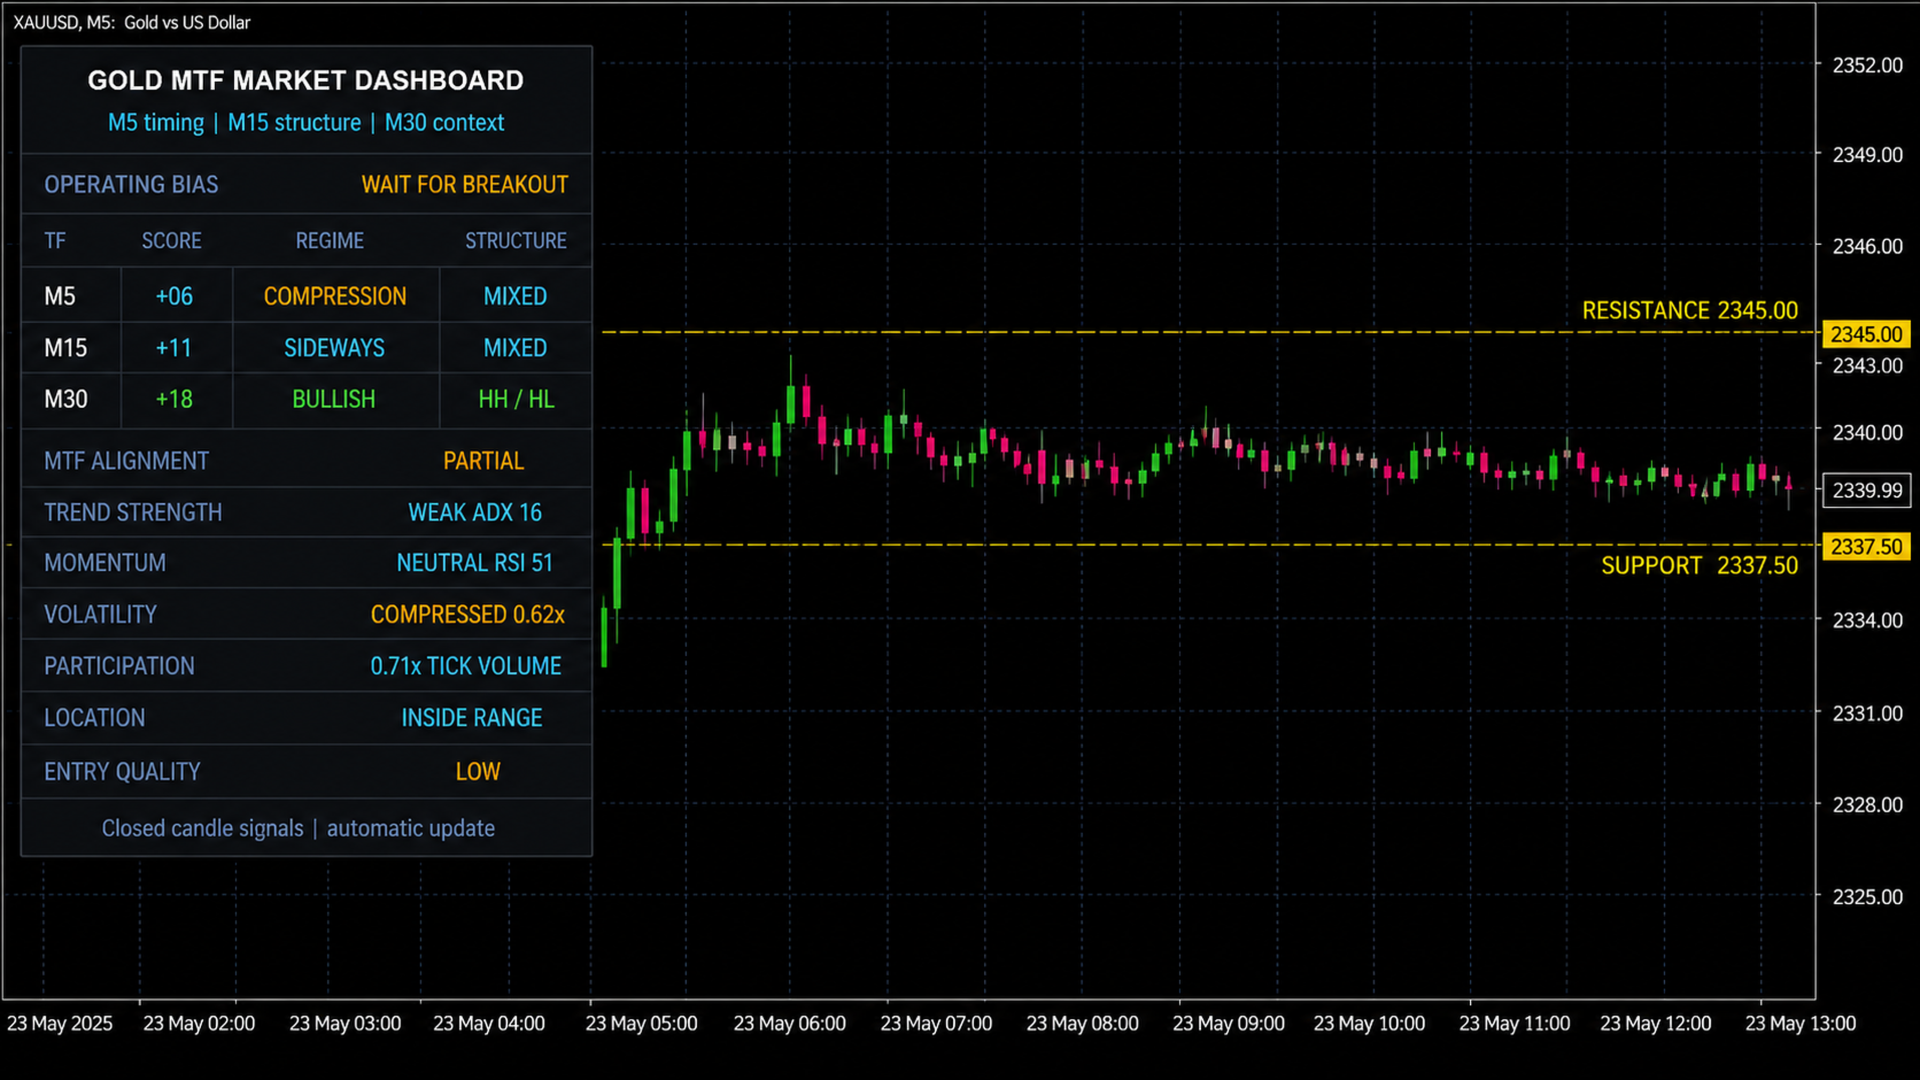
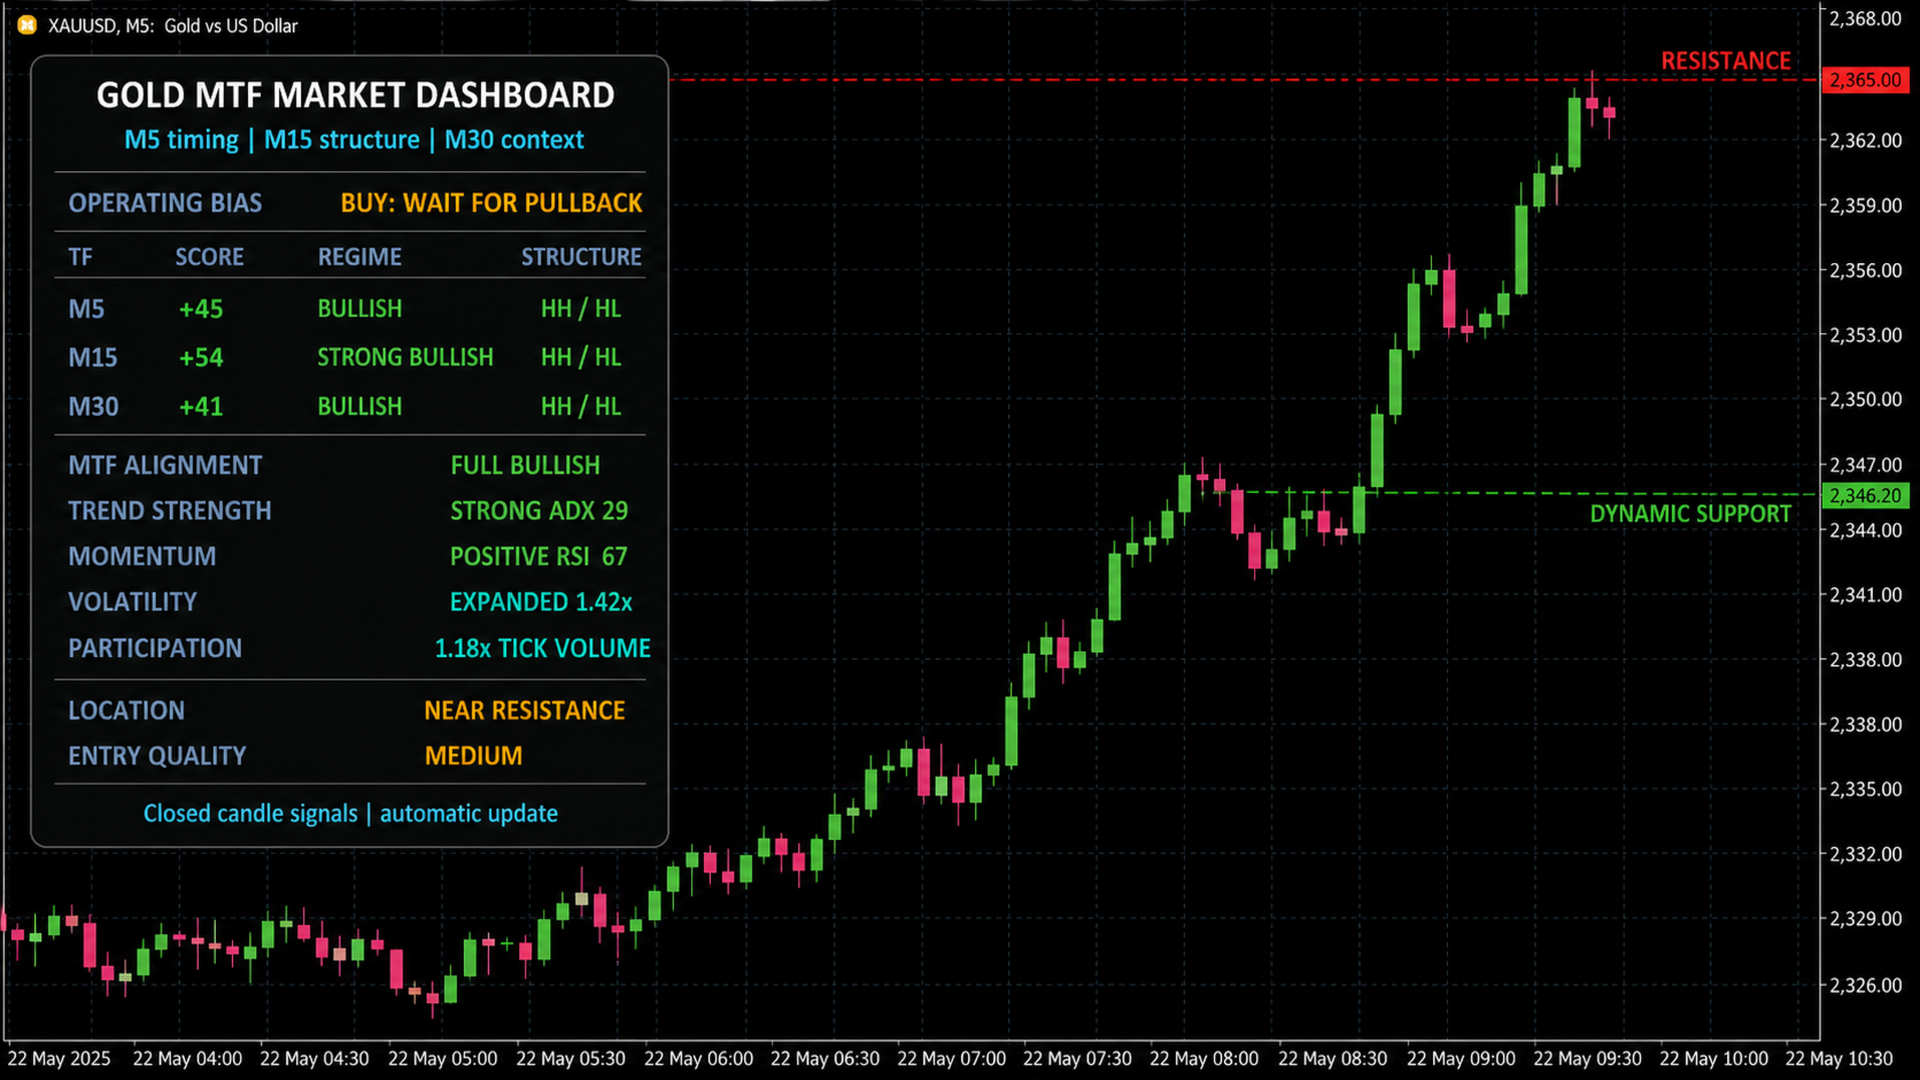
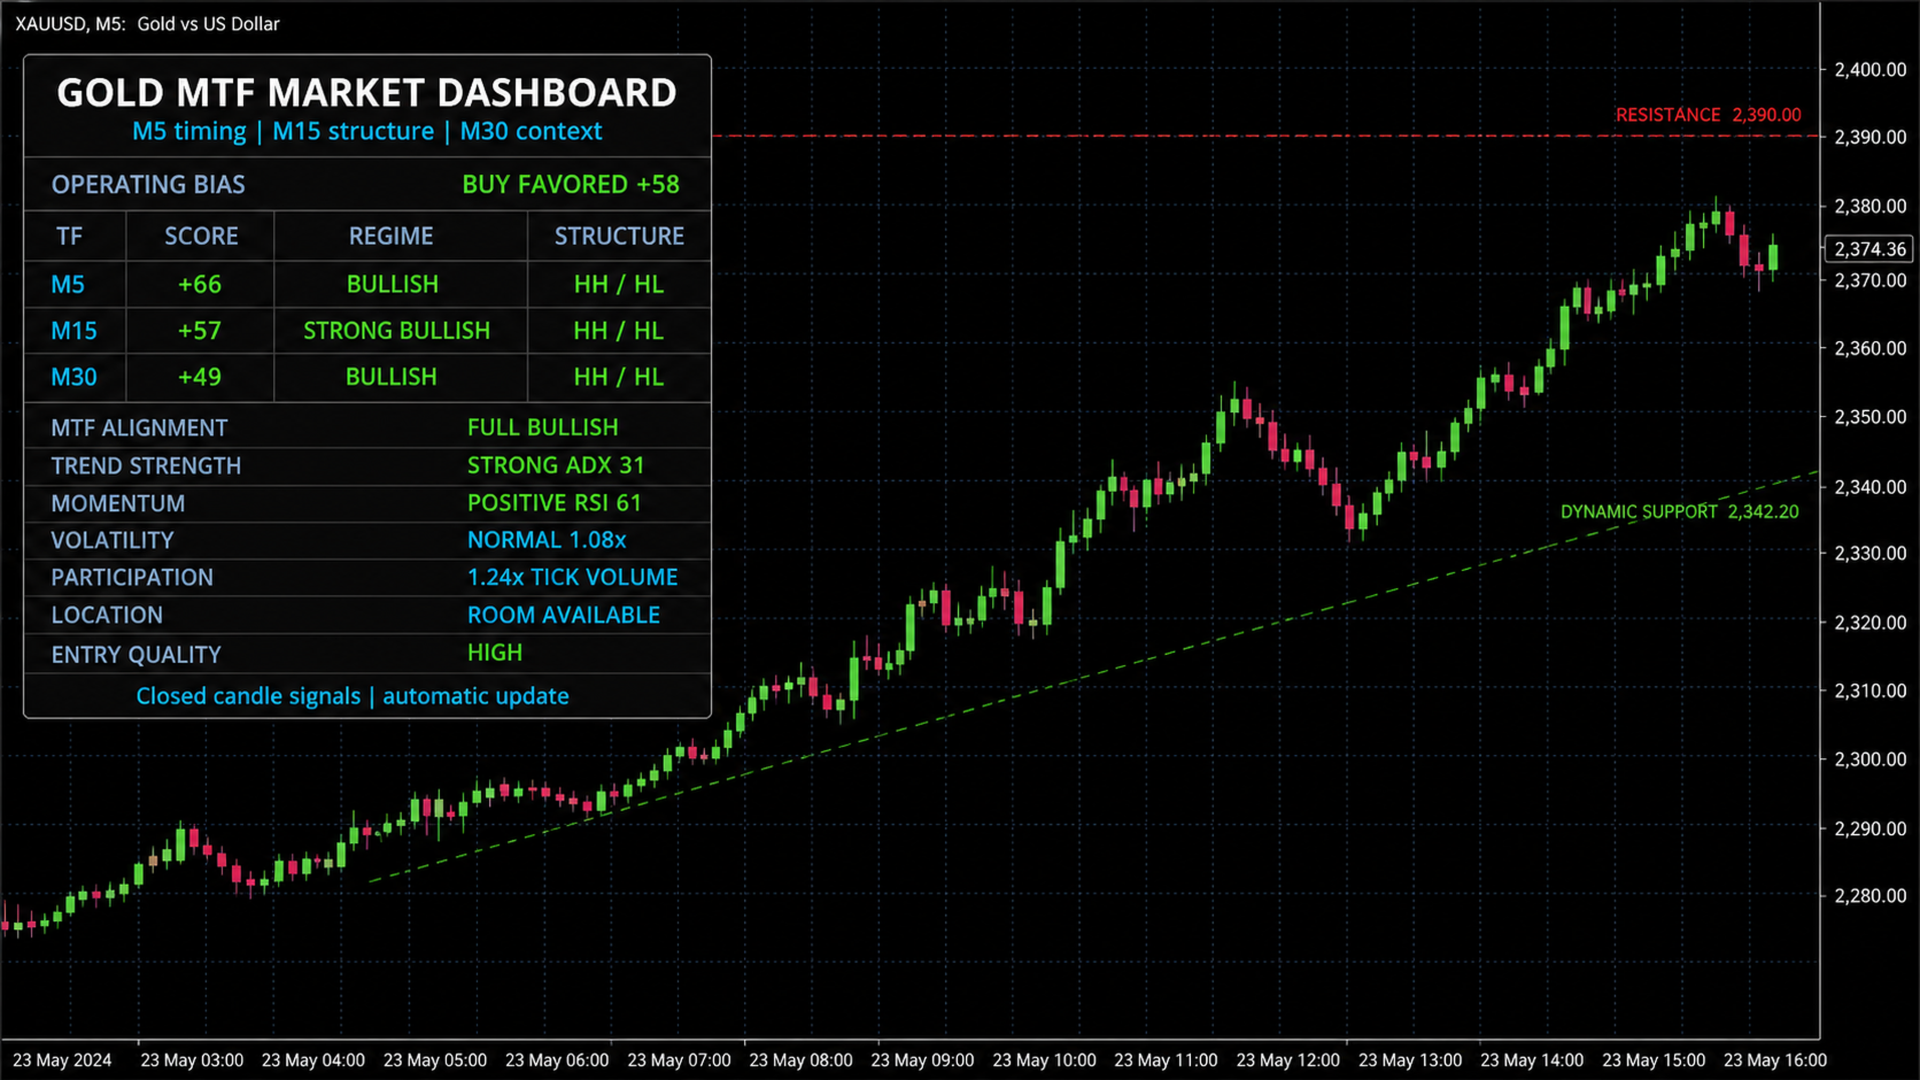
Gold MTF Market Dashboard is a multi-timeframe analytical indicator designed primarily for Gold trading on the M5 chart.
The indicator compares M5, M15 and M30 market conditions in a single compact dashboard:
-
M30 provides the broader market context.
-
M15 evaluates structure and direction.
-
M5 provides short-term timing information.
Main features
-
Multi-timeframe trend analysis
-
M5, M15 and M30 directional scores
-
Bullish HH/HL and bearish LH/LL market structure
-
EMA trend and slope analysis
-
ADX and directional movement analysis
-
RSI momentum evaluation
-
ATR and Bollinger Band volatility analysis
-
Compression and expansion detection
-
Tick volume participation
-
Dynamic M15 support and resistance levels
-
Distance evaluation from relevant price levels
-
Entry quality classification
-
Closed-candle calculation option
Dashboard states
The dashboard can display the following market conditions:
-
Buy Favored
-
Sell Favored
-
Moderate Buy
-
Moderate Sell
-
Wait for Pullback
-
Wait for Breakout
-
Multi-Timeframe Conflict
-
Neutral
Color interpretation
-
Green: bullish condition
-
Red: bearish condition
-
Orange: consolidation, compression, conflict or waiting condition
-
Blue: neutral contextual information
Important information
The indicator does not open, modify or close trades. It is an analytical tool and does not guarantee future market direction or trading results.
The default settings use closed candles to reduce intrabar signal changes. Users should test the indicator on a demo account before using it as part of a trading process.