
Trix Trend
- 지표
- 버전: 1.1
- 업데이트됨: 31 7월 2026

Trix Trend
algoteknik · MetaTrader 5 Indicator Manual
Overview
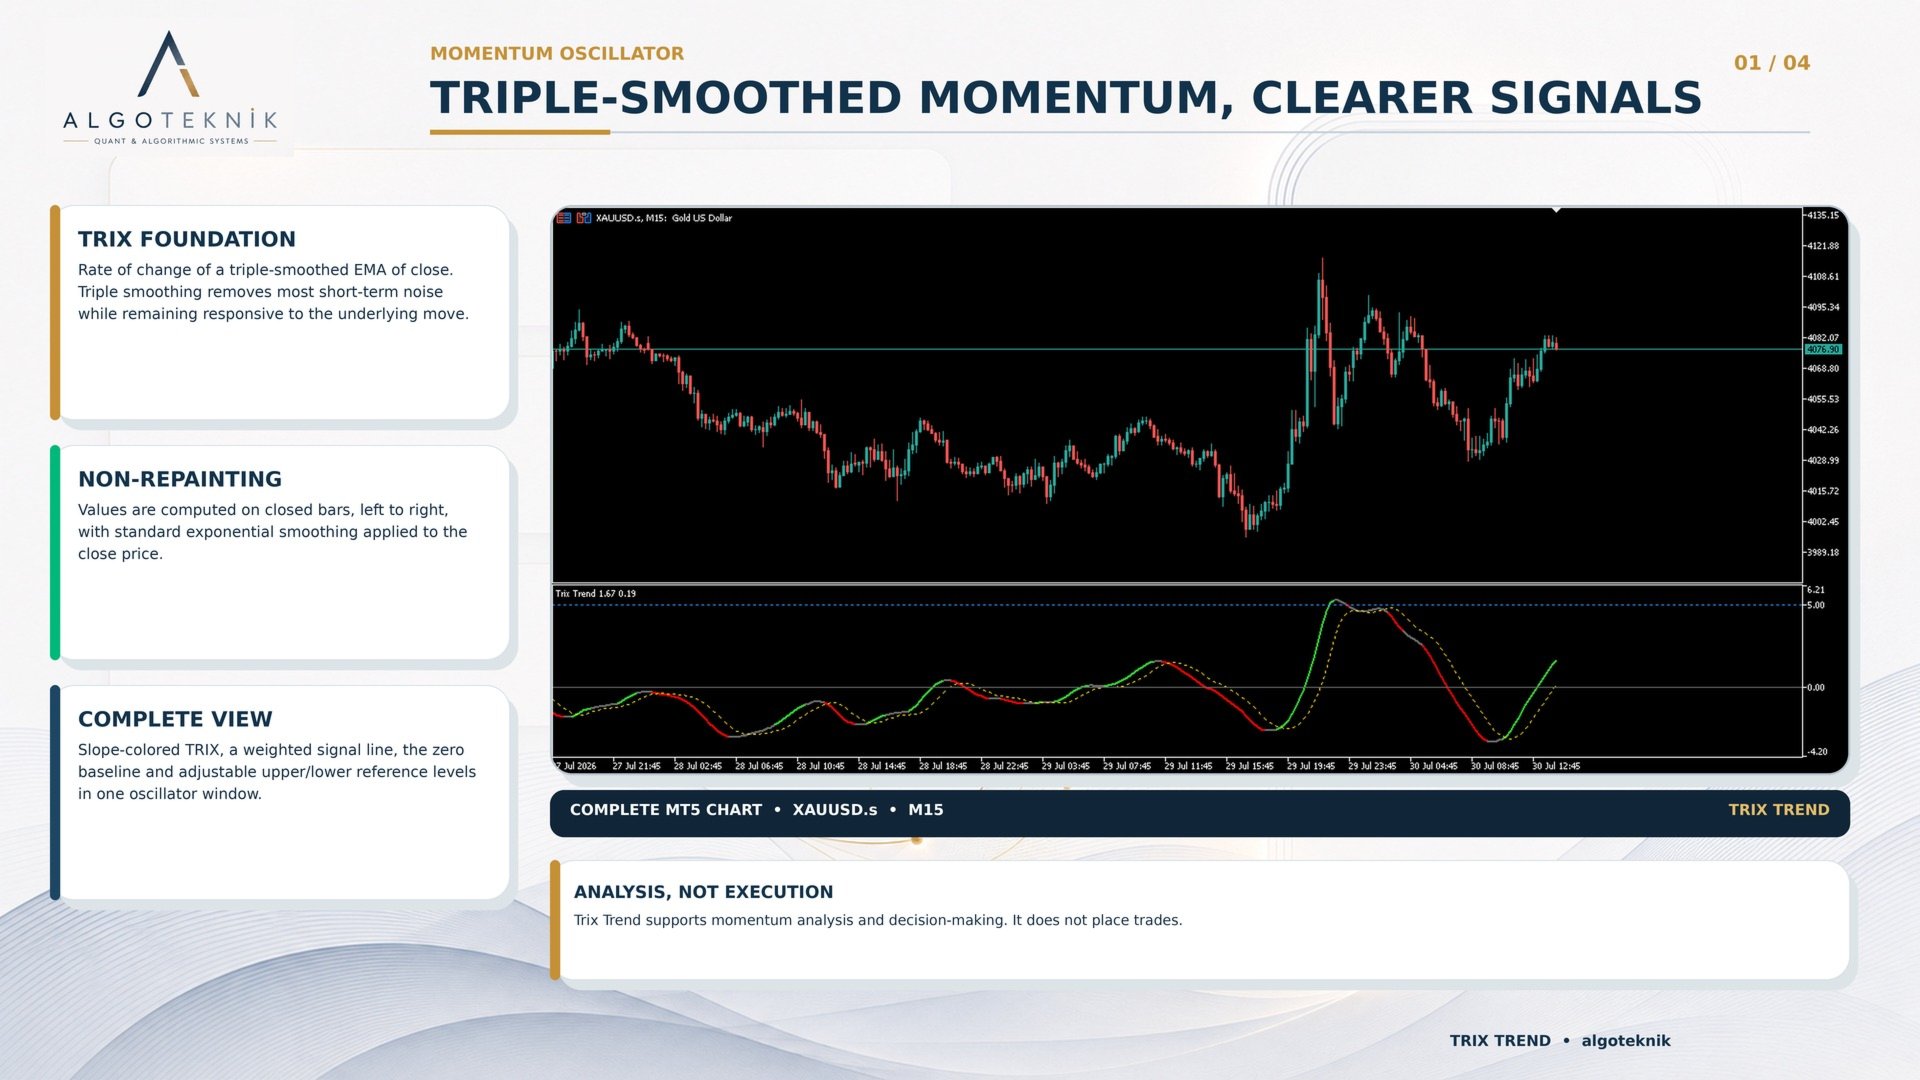
Trix Trend is a momentum oscillator based on TRIX — the rate of change of a triple-smoothed exponential moving average of price. Triple smoothing removes most of the short-term noise, so the oscillator reacts to the underlying momentum of the move rather than to every small wiggle, while staying more responsive than a simple long moving average.
The indicator draws a slope-colored TRIX line, a weighted signal line, a zero line, and two adjustable overbought/oversold levels. The line is colored by the direction and strength of its own slope, using an adaptive threshold that scales with recent volatility — so the coloring stays meaningful on both quiet and fast instruments.
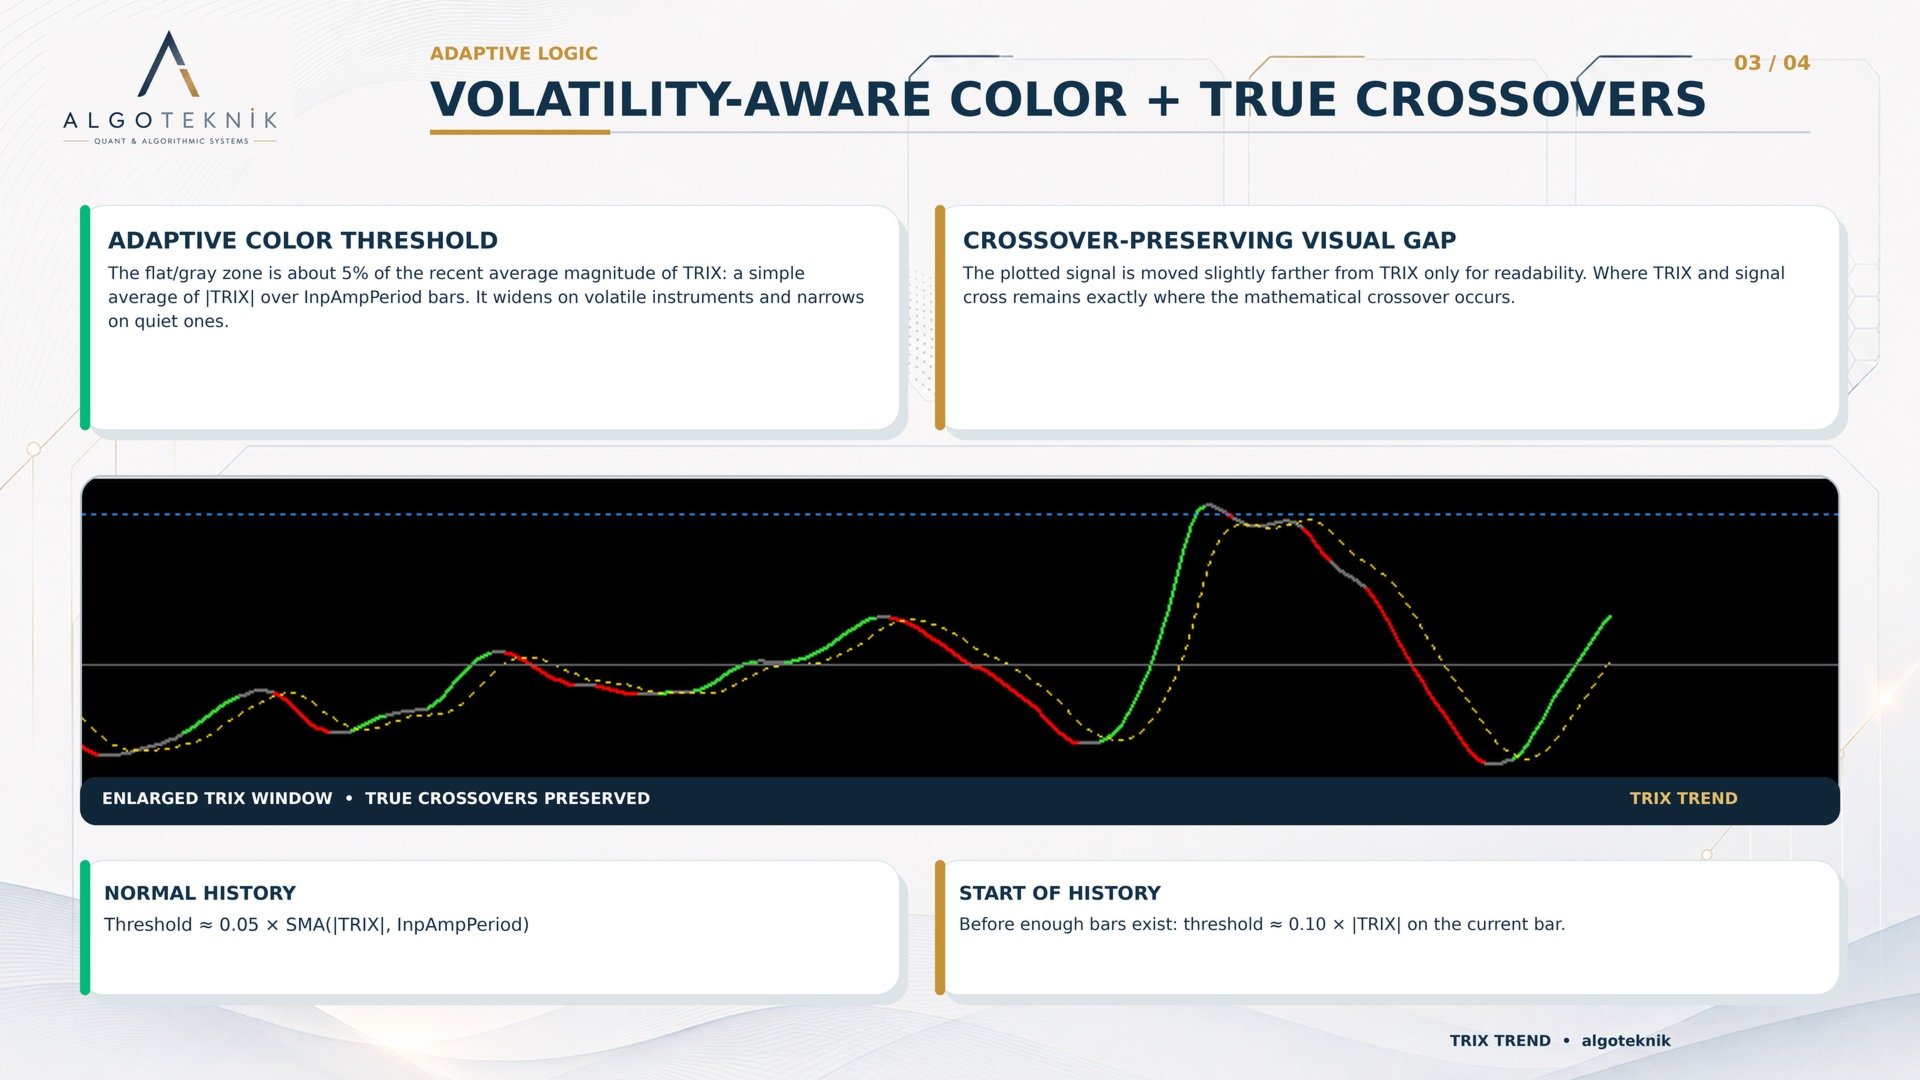
A distinctive feature is the crossover-preserving visual gap: the signal line is drawn with its distance to the TRIX line slightly exaggerated for readability, but in a way that leaves the actual crossover points exactly where they mathematically occur. You get clearer separation between the two lines without any false or shifted crosses.
The indicator is non-repainting: values are computed on closed bars, left to right, with standard exponential smoothing applied to the close price. History is stable.
Release notes, chart examples and new product announcements are posted on the TrendTower channel: https://www.mql5.com/en/channels/trendtower
What You See on the Chart (separate window)
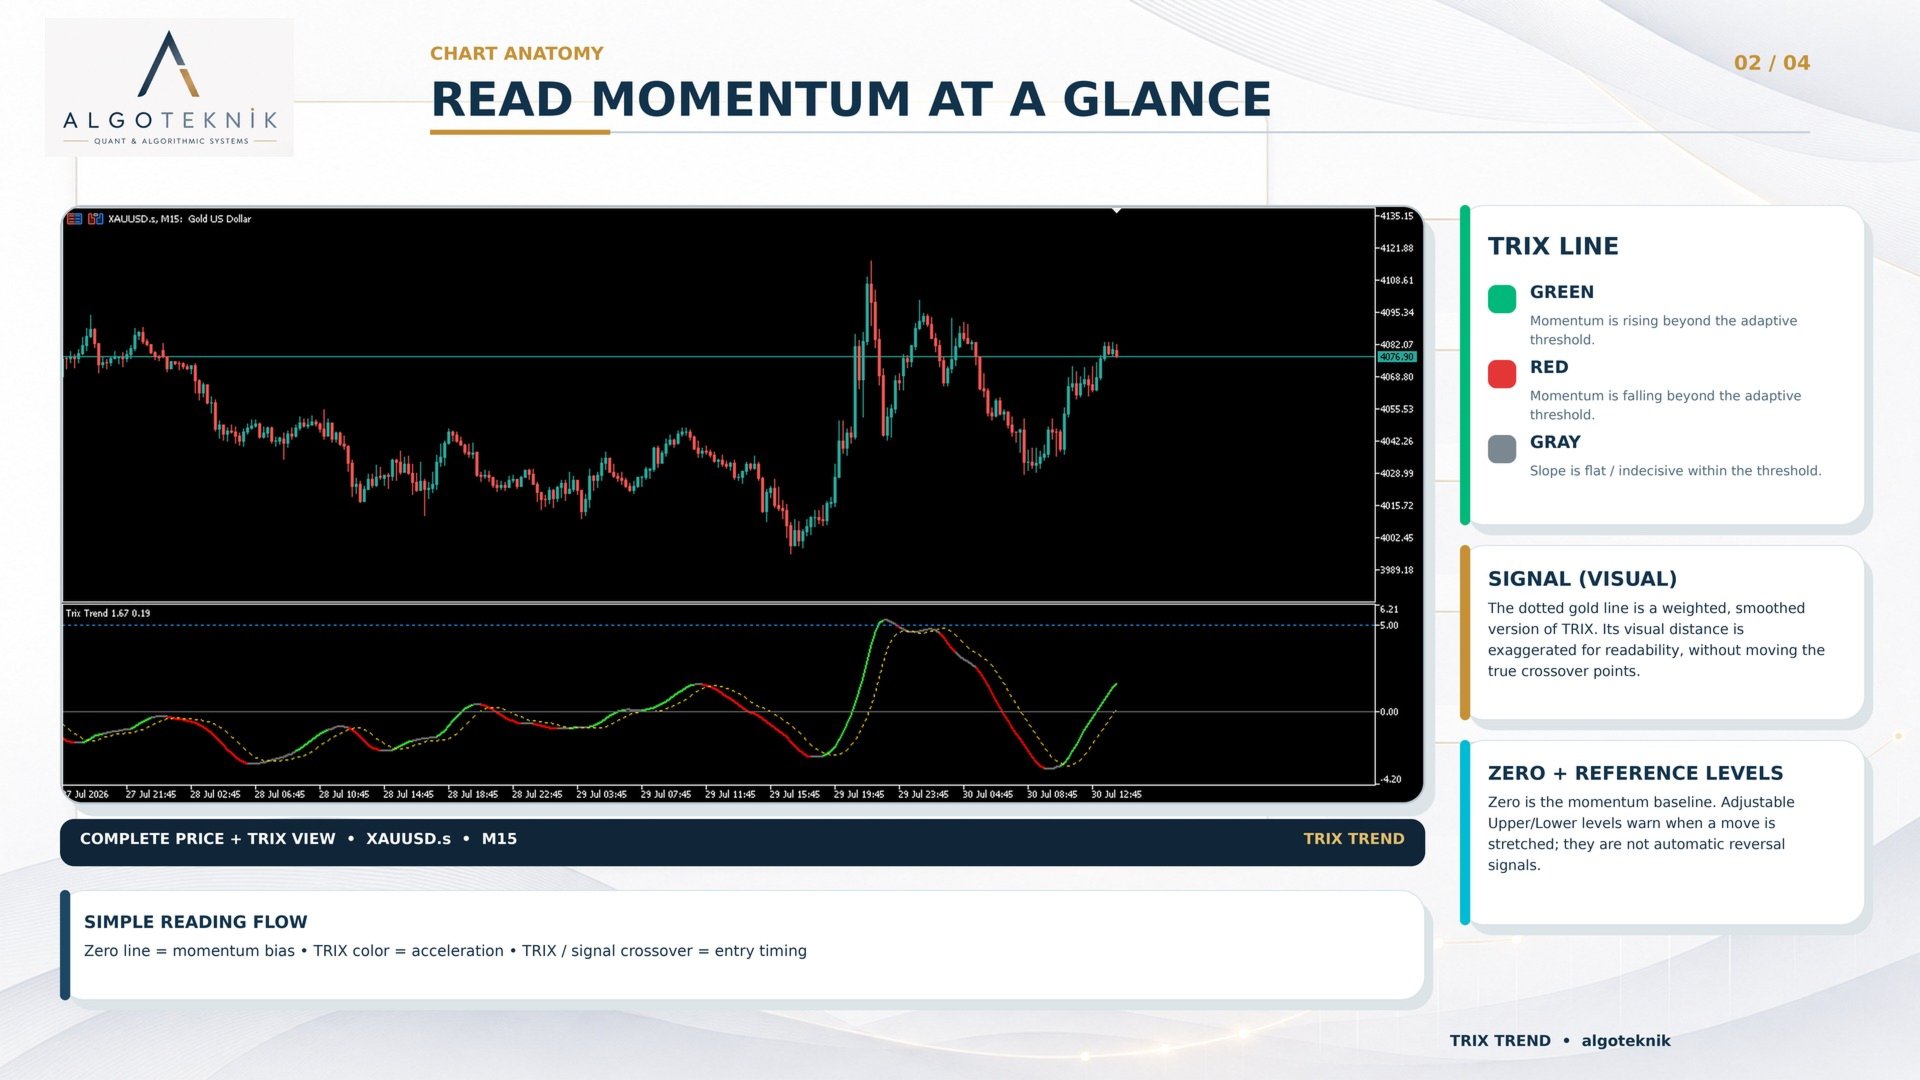
- TRIX Line (main plot, “Trix Trend”) — a colored line:
- Green: momentum is rising (positive slope beyond the adaptive threshold).
- Red: momentum is falling (negative slope beyond the adaptive threshold).
- Gray: momentum is flat / indecisive (slope within the threshold).
- Signal Line (“Signal (visual)”) — a dotted gold line: a weighted, smoothed version of the TRIX line, drawn with its distance to the TRIX line cosmetically exaggerated for readability (see “The Visual Gap” below). The label says “(visual)” because the Data Window value is not the raw signal — see “Automated Trading” below for the true value. Crossovers between the TRIX line and this line are the timing triggers; the exaggeration never moves where a crossover actually happens.
- Zero Line (solid, level 0): the momentum baseline. TRIX above zero = net upward momentum regime; below zero = net downward momentum regime.
- Upper / Lower Levels (dotted): reference lines at InpUpperLevel (blue) and InpLowerLevel (orange). When TRIX reaches these, momentum is stretched (overbought / oversold).
How to Read It
- Regime (zero line): TRIX above 0 favors longs, below 0 favors shorts.
- Acceleration (line color): green = strengthening in the current direction, red = weakening/reversing, gray = losing conviction / consolidation.
- Trigger (crossover): TRIX crossing above its signal line is a bullish momentum trigger; crossing below is bearish. The visual gap makes these crosses easy to see but never moves where they actually happen.
- Exhaustion (levels): TRIX pushing beyond the upper/lower levels warns that the move is stretched and may be due for a pause or pullback.
The Adaptive Color Threshold
Instead of a fixed cutoff, the line color uses a threshold equal to roughly 5% of the recent average magnitude of TRIX (a simple average of |TRIX| over InpAmpPeriod bars). This means the “flat/gray” zone automatically widens on volatile instruments and narrows on quiet ones, so the green/red coloring reflects genuine acceleration rather than noise on any symbol or timeframe. At the very start of history, before enough bars exist to form that average, the threshold temporarily falls back to 10% of the current bar's |TRIX| instead.
The Visual Gap (why the signal line looks separated)
The raw signal is a weighted blend of a fast and a slow EMA of TRIX. For display, the gap between the TRIX line and this signal is multiplied by InpVisualGapMultiplier so the two lines are easier to tell apart when they run close together. At the exact moment of a crossover the TRIX line equals the raw signal, so the multiplier has no effect there — the cross stays precisely at its true location. The exaggeration is purely cosmetic and does not change any signal timing.
Input Parameters
TRIX Math
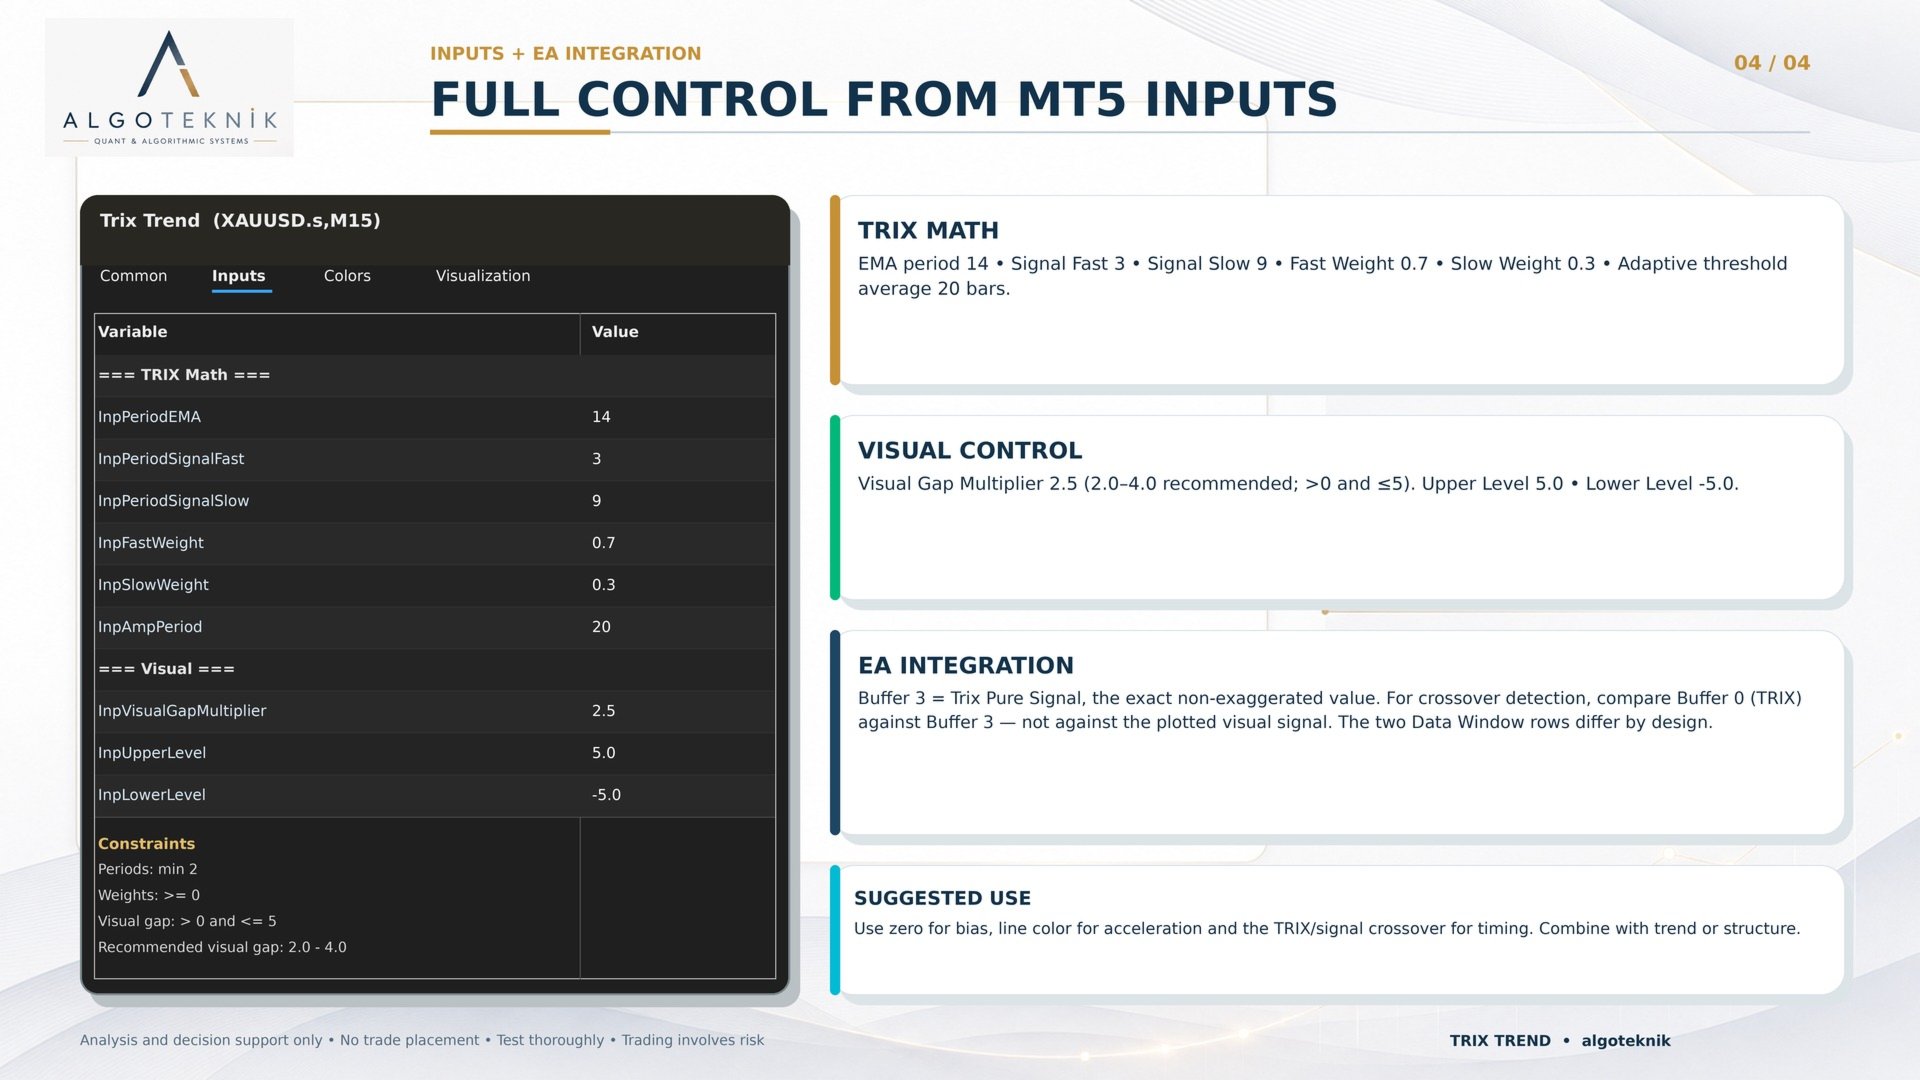
InpPeriodEMA Default 14, minimum 2. Period of each of the three EMAs (triple smoothing). Larger = smoother and slower; smaller = faster. InpPeriodSignalFast Default 3, minimum 2. Fast EMA period used to build the signal line. InpPeriodSignalSlow Default 9, minimum 2. Slow EMA period used to build the signal line. InpFastWeight Default 0.7. Weight of the fast component in the signal blend (must be ≥ 0). InpSlowWeight Default 0.3. Weight of the slow component in the signal blend (must be ≥ 0). InpAutoNormalizeWeights Default true. If true, the two weights are auto-scaled to sum to 1 (so you can enter any non-negative pair). If false, they must already sum to 1. InpAmpPeriod Default 20, minimum 2. Averaging period for the adaptive color threshold (average |TRIX| used to decide green/red/gray).Visual
InpVisualGapMultiplier Default 2.5; must be greater than 0 and at most 5 (2.0–4.0 recommended). Cosmetic separation between the TRIX and signal lines. Cross points are always preserved. InpUpperLevel Default 5.0. Overbought reference level. InpLowerLevel Default -5.0. Oversold reference level.A Note on the Levels
Different instruments and timeframes produce different typical TRIX ranges, so the default +5 / -5 will not fit every market. If TRIX rarely reaches the levels on your chart, narrow them so they mark genuine extremes; if TRIX pushes past them often, widen them. Match the levels to where the oscillator actually spends its time. This only moves the reference lines; it does not change the oscillator itself.
Automated Trading (EA Integration)
The indicator exposes one hidden data buffer specifically for EA developers to read via iCustom / CopyBuffer :
- Buffer 3 (Trix Pure Signal): the exact, non-exaggerated signal value used to detect crossovers. This is not the same as the plotted “Signal (visual)” line, which is cosmetically widened for on-chart readability (see “The Visual Gap” above). An EA that wants the true TRIX/signal crossover must compare the main TRIX buffer (buffer 0) against buffer 3, never against the plotted signal line.
Suggested Use
- Use the zero line for momentum bias, the line color for acceleration, and the TRIX/signal crossover for entry timing.
- Combine with a trend or structure tool for direction, and treat the upper/lower levels as exhaustion warnings rather than automatic reversal signals.
Works on any symbol and timeframe. Applied to the close price.
Questions, bug reports and feature requests are welcome on the TrendTower channel: https://www.mql5.com/en/channels/trendtower
Disclaimer: This is an indicator for analysis and decision support. It does not place trades. Always test thoroughly before using any tool in live trading. Trading involves risk.


































사용자가 평가에 대한 코멘트를 남기지 않았습니다