MACD Multi Timeframe Panel
- 지표
-
Hacene Harrous
 저는 MetaTrader 5를 위한 간결하고 정직한 지표를 만듭니다. 전문 분야는 멀티 타임프레임 대시보드입니다. 하나의 지표(RSI, 추세, MACD, ADX, 스토캐스틱, CCI 또는 일목균형표 전체)를 여러 시간대에서 한눈에 보여 주어 차트를 계속 바꿀 필요가 없습니다. 모든 도구는 가볍고, 알림은 절대 리페인트하지 않으며, 전부 무료입니다. 어떤 도구가 매매에 도움이 되었다면, 짧은 리뷰가 작업에 가장 큰 힘이 됩니다.
 - 버전: 1.1
- 업데이트됨: 27 8월 2026
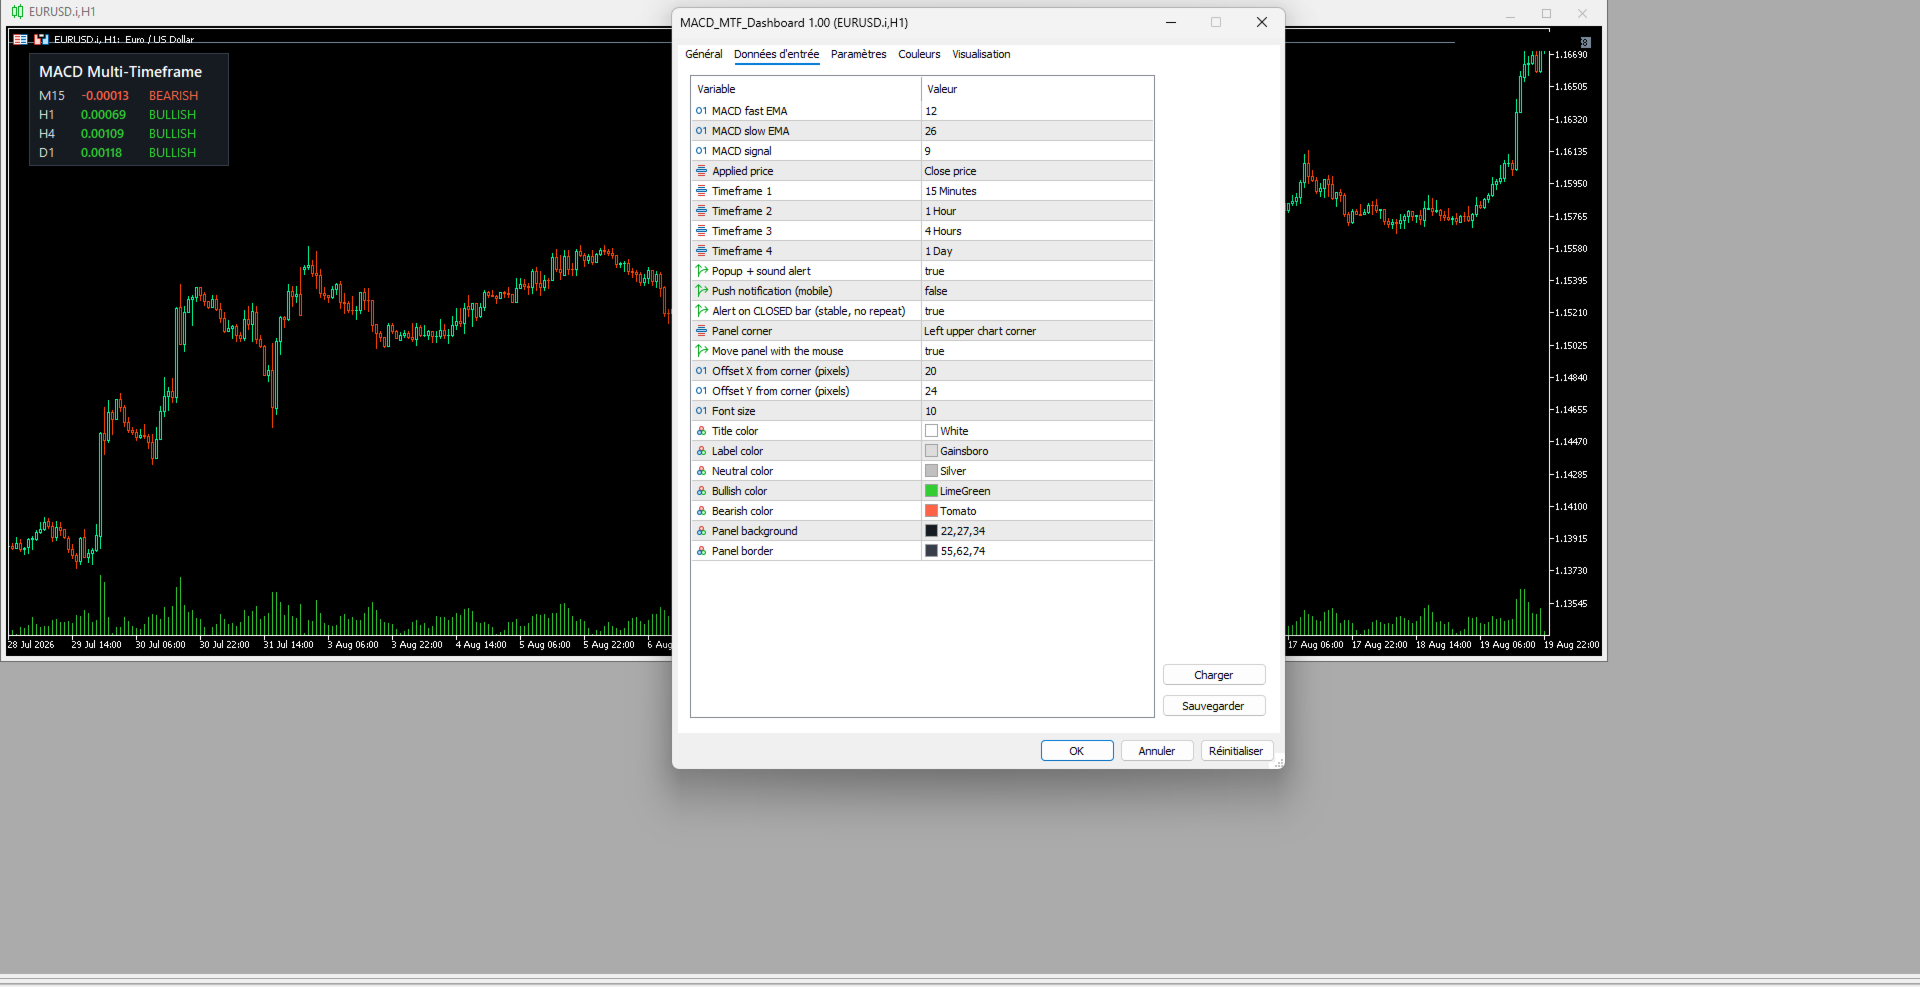
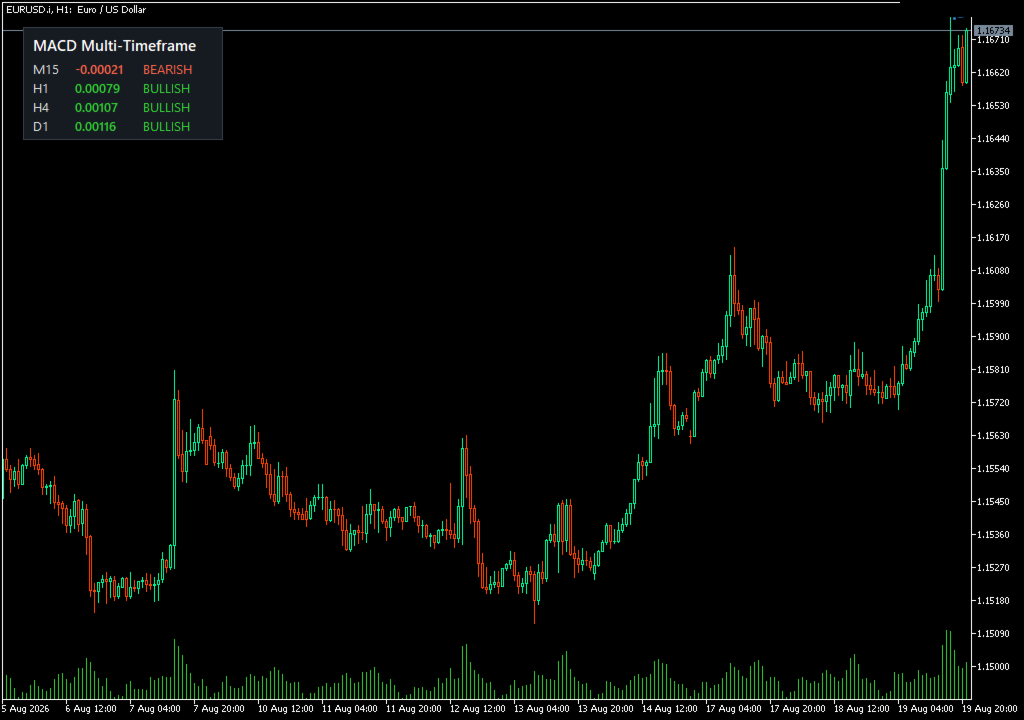
MACD Multi-Timeframe Dashboard shows whether MACD is bullish or bearish on four timeframes at once, by comparing the MACD line to its signal line on each timeframe. You read the direction of momentum across the whole market in a single panel instead of switching charts. By default it covers the M15, H1, H4 and D1 timeframes, and the fast, slow and signal settings are configurable. Each timeframe appears in green when momentum is bullish and red when it is bearish, and the histogram value is shown for context. An alert is available on a bullish or bearish cross, based on the closed bar so it does not repaint. The panel can be anchored to a corner or dragged anywhere with the mouse, and it remembers its place. It works on any symbol and any timeframe. This tool displays momentum and is not a signal system, so trade with your own risk management. It is free to use, and it is part of the laPanthere multi-timeframe suite on my profile.