MACD Color Histogram

5

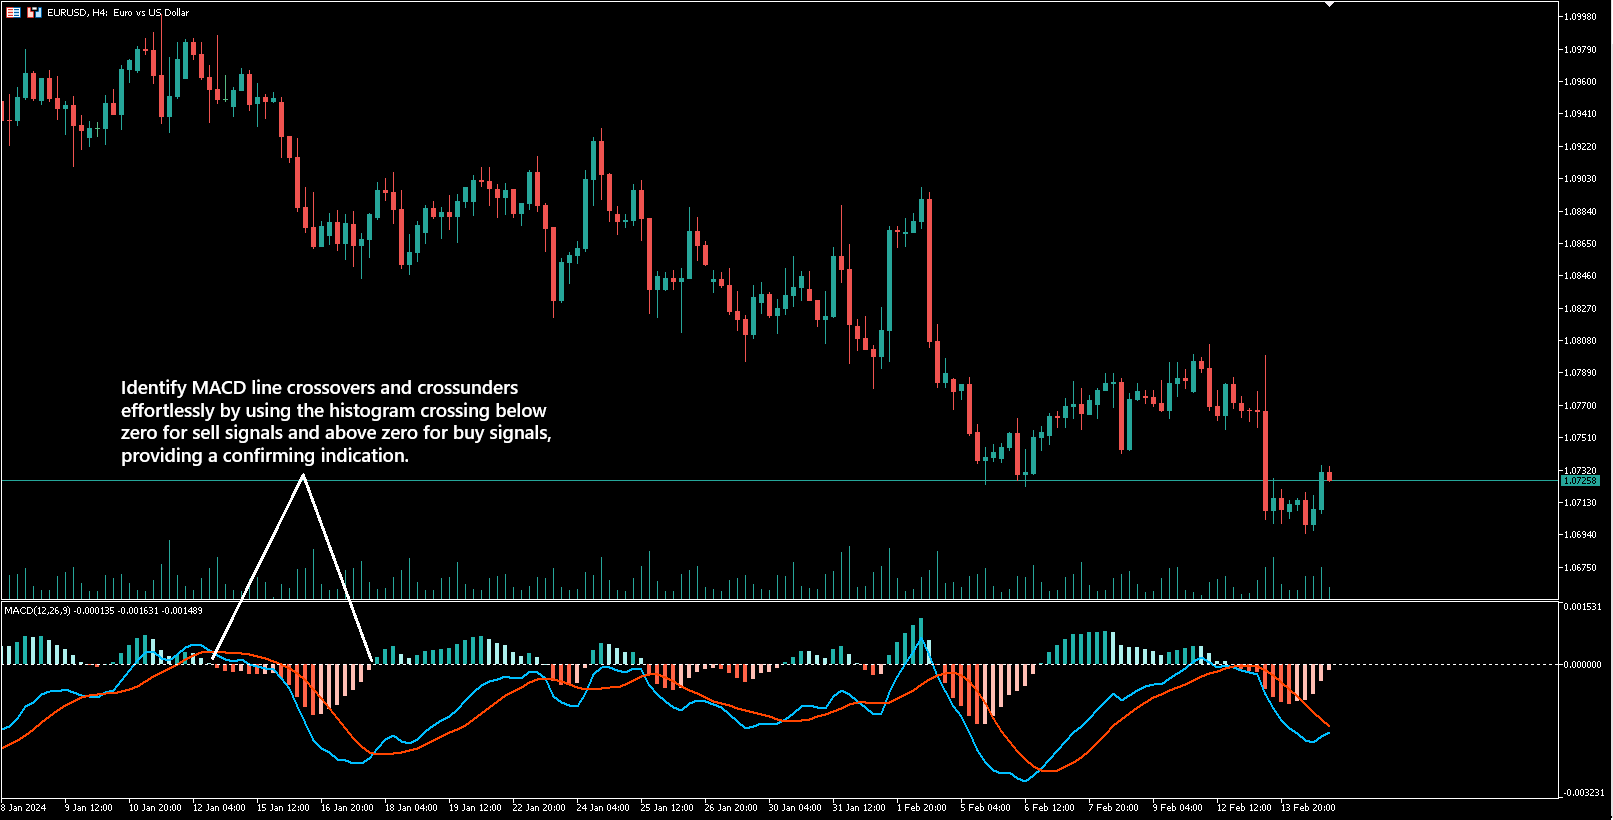
MACD 히스토그램 지표는 트레이더가 시장 동향과 모멘텀 변화를 이해하기 쉽게 하기 위해 설계된 MACD 지표의 업데이트 버전입니다. 원래의 MACD와 달리 이 버전에는 히스토그램이 포함되어 있으며, 이는 MACD 라인과 신호 라인 간의 차이를 보여주는 막대 그래프입니다.

작동 방식은 다음과 같습니다. MACD 라인이 신호 라인 위에 있을 때 강세 시장을 나타내며 히스토그램 막대는 녹색으로 표시됩니다. 반면에 MACD 라인이 신호 라인 아래에 있을 때 약세 시장을 나타내며 히스토그램 막대는 빨간색으로 변합니다.

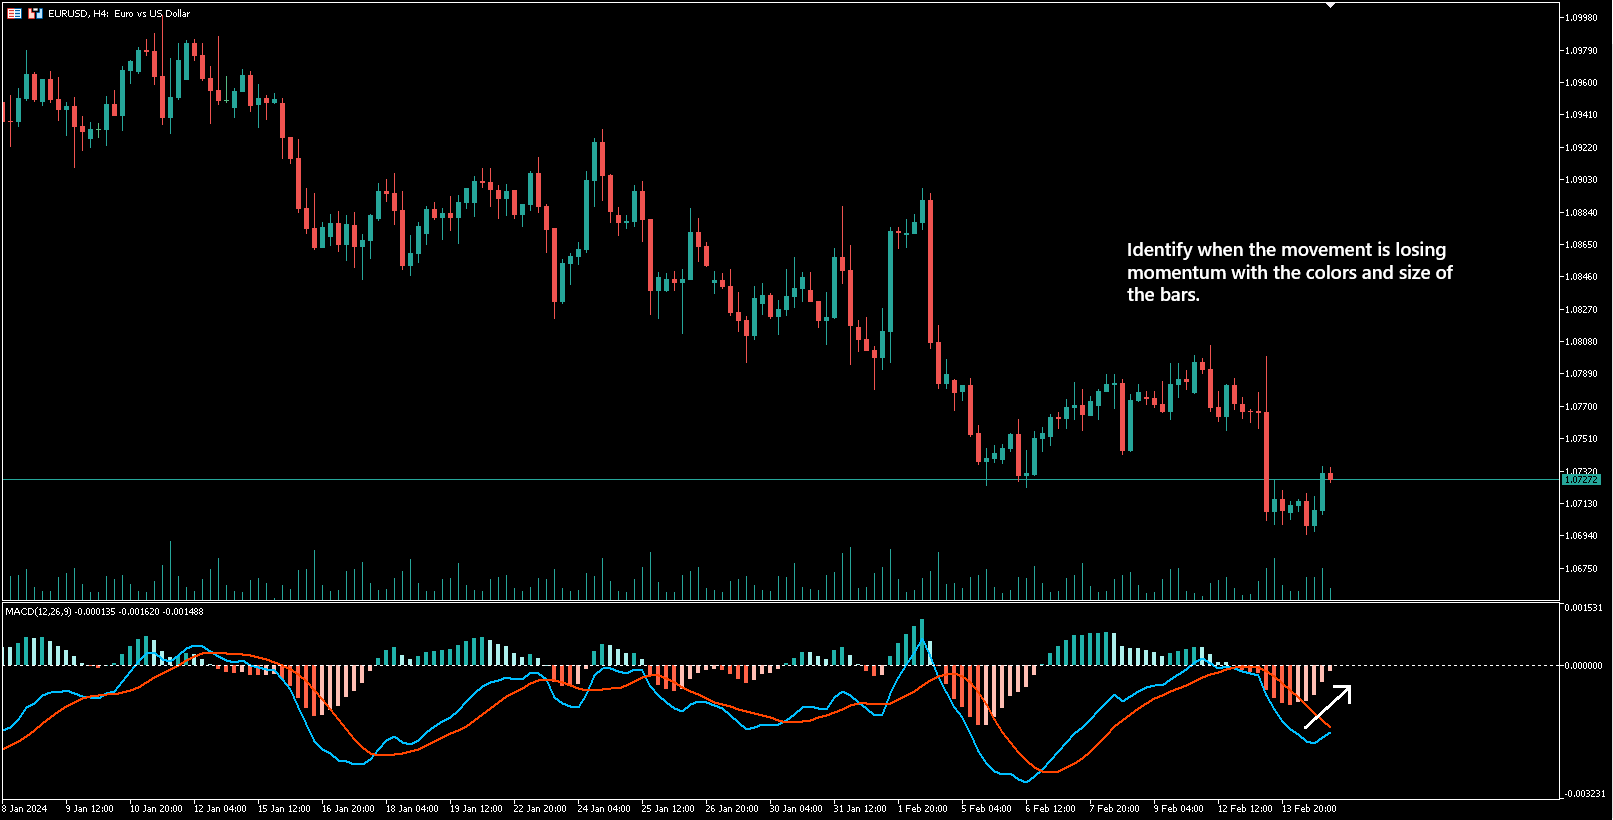
MACD 히스토그램 지표의 흥미로운 점은 시장 모멘텀이 변화함에 따라 막대의 색이 변한다는 것입니다. 따라서 모멘텀이 강세에서 약세로 전환될 때 막대가 녹색에서 빨간색으로 변하고 그 반대의 경우도 마찬가지입니다.

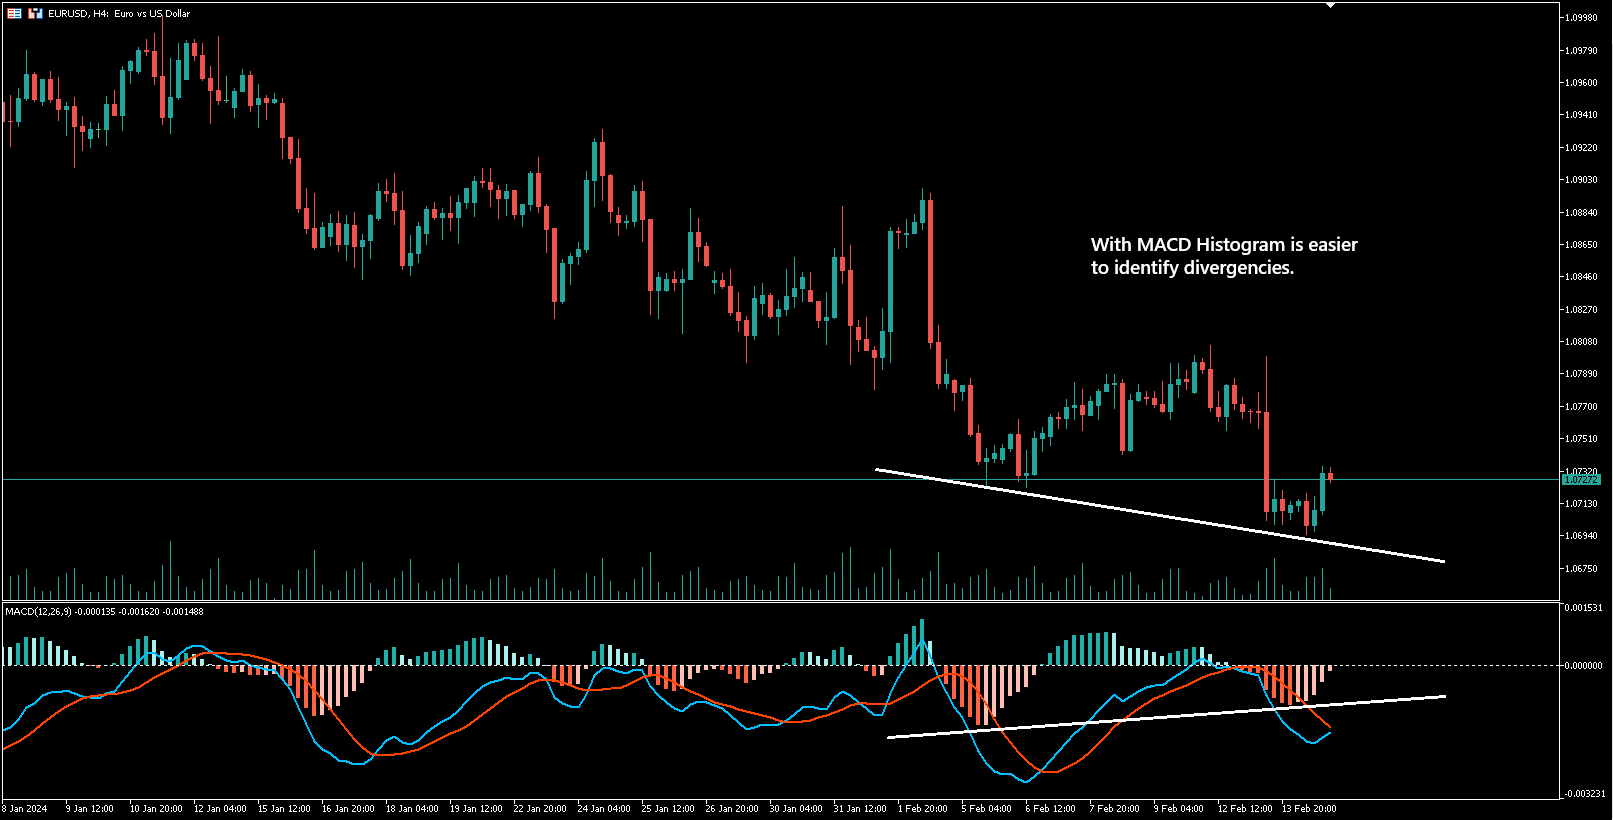
또한 가격 움직임과 MACD 지표 간의 차이를 감지하는 것을 용이하게 하여, 잠재적인 시장 반전을 나타낼 수 있는 쌍의 가능한 다이버전스를 강조하는 데 도움이 되는 유용한 기능이 있습니다.

이 지표는 또한 사용자의 선호에 따라 MACD 라인과 신호 라인, 히스토그램을 숨길 수 있어 지표의 맞춤화 및 유연성을 향상시킵니다.

요약하자면, MACD 히스토그램 지표는 트레이더에게 시장 동향을 분석하는 더 간단한 방법을 제공하며, 명확한 시각적 신호와 색상 변화를 통해 더 현명한 거래 결정을 내리는 데 도움이 됩니다.

리뷰 1
strazzy
197
strazzy 2024.06.02 12:36 
 

excellent indicator

추천 제품
Original MACD
Kirill Paskhin
4.86 (7)
Moving Average Convergence/Divergence — схождение/расхождение скользящих средних — технический индикатор, разработанный Джеральдом Аппелем (Gerald Appel), используемый в техническом анализе для проверки силы и направления тренда, а также определения разворотных точек. Встроенный в MetaTrader 5 индикатор MACD не соответствует задумке автора (Gerald Appel): -линия MACD графически изображена в виде гистограммы, однако гистограммой отражается разница между линией MACD и сигнальной линией;  -сигнальн
FREE
MTF RSI Fusion Basic MTF RSI Fusion은 여러 RSI 계산에서 생성되는 모멘텀 정보를 하나의 구조화된 지표로 통합하기 위해 설계된 멀티 타임프레임 RSI 오실레이터입니다. 이 지표는 단일 RSI 소스에만 의존하지 않고, 서로 다른 타임프레임의 최대 3개의 RSI 스트림을 하나의 “Fusion RSI” 라인으로 결합합니다. 또한 적응형 과매수/과매도 영역, 추세 편향 시각화, 다이버전스 감지, 신호 생성 및 선택형 VWAP 필터와 같은 기능도 동일한 프레임워크 내에서 함께 사용할 수 있습니다. 이 지표는 모멘텀, 추세 및 확인 도구를 하나의 워크플로우로 구성하면서도 차트를 깔끔하게 유지하도록 설계되었습니다. Main Features 멀티 타임프레임 RSI Fusion 엔진 최대 3개의 독립적인 RSI 소스 각 RSI별 개별 타임프레임, 기간 및 가중치 설정 다양한 Fusion 및 Combine 모드 적응형 과매수 및 과매도 영역 ATR 기반 동적 변동성 조정
FREE
Curver Arrows
Francis Dube
3.75 (4)
This indicator is a straight port of a well known MetaTrader 4 indicator that is freely available on the Internet. It does not redraw at all. It implements a type of breakout strategy. The arrows indicate market direction. Use the indicator on M15 charts and higher. The indicator draws two bands near price action and generates signals when the price closes below the lower band and also above the upper band. The indicator uses periodic highs and lows to calculate upper and lower threshold bands.
FREE
Vortex MT5
KEENBASE SOFTWARE SOLUTIONS
The Vortex Indicator was first presented by Douglas Siepman and Etienne Botes in January 2010 edition of Technical Analysis of Stocks & Commodities. Despite its based on a complex implosion phenomenon, the vortex is quite simple to interpret. A bullish signal is generated when +VI line cross above the -VI line and vice versa. The indicator is mostly used as a confirmation for trend trading strategies. The Vortex was inspired by the work of Viktor Schauberger, who studied the flow of water in tur
SMC Order Blocks + FVG — Professional Smart Money Concept Indicator Unlock institutional trading insights with this professional-grade Smart Money Concept indicator. Automatically detect Order Blocks and Fair Value Gaps used by banks and hedge funds. KEY FEATURES: ORDER BLOCKS DETECTION • Automatic bullish and bearish Order Block identification • Based on price action and impulse strength analysis • Real-time mitigation tracking • Customizable imp
Wolfe Wave Scanner MT5
Reza Aghajanpour
5 (7)
**  All Symbols  x  All Timeframes  scan just by pressing scanner button ** *** Contact me  to send you instruction and add you in "Wolfe Wave Scanner group" for sharing or seeing experiences with other users. Introduction: A Wolfe Wave is created with five-wave patterns in price. It shows supply and demand and a fight towards a balance price. T hese waves of price actions can help traders identify the boundaries of   the trend . Also  It helps forecast how the price will move in the near futur
MACD Titanium
Donovan Tjin-a-tak
MACD Titanium은 MetaTrader 5용 Zero-Lag MACD 지표로, 기존 MACD보다 더 빠르고 명확한 모멘텀 신호를 제공합니다. Zero-Lag EMA 계산 방식을 사용하여 신호 지연을 줄이고 시장 모멘텀 변화에 더욱 빠르게 반응하면서도, 전통적인 MACD 구조를 유지합니다. 차별점 • Zero-Lag EMA 사용 • 모멘텀 변화에 빠른 반응 • 교차 지점을 명확히 표시 • 동적 배경 색상으로 현재 방향성 표시 • 모든 시간대와 종목에서 사용 가능 리페인트 없음. 모든 계산은 실시간 수행. 시각적 구조 아쿠아 라인 – MACD 오렌지 라인 – 시그널 녹색 점 – 상승 교차 빨간 점 – 하락 교차 배경 색상 – 현재 모멘텀 방향 녹색 = 상승 우세 빨간색 = 하락 우세 명확성을 중심으로 설계되었습니다. MACD Titanium Pro가 곧 출시됩니다 — 알림 기능, 멀티 타임프레임 분석 및 고급 다이버전스 감지 기능이 포함됩니다. MACD Titanium Trend
FREE
==============================================================================                     DIVERGENCE HUNTER PRO v2.01          Advanced Multi-Oscillator Divergence Detection System ============================================================================== OVERVIEW Divergence Hunter Pro is a professional-grade divergence detection indicator  that automatically identifies high-probability trading oppor
FREE
ATR SuperTrend
Paulo Henrique Faquineli Garcia
A ‘Supertrend’ indicator is one, which can give you precise buy or sell signal in a trending market.  As the name suggests, ‘Supertrend’ is a trend-following indicator just like moving averages and MACD (moving average convergence divergence). It is plotted on prices and their placement indicates the current trend. The Supertrend indicator is a trend following overlay on your trading chart, much like a moving average, that shows you the current trend direction. The indicator works well in a tren
BeST Oscillators Collection MT5
Eleni Koulocheri
4.33 (9)
BeST_Oscillators Collection is a Composite MT5 Indicato r including the Chaikin ,  Chande and TRIX Oscillators from which by default Chaikin and TRIX Oscillators but not Chande Momentum Oscillator are contained in MT5 platform. It also provides for each Oscillator the option of displaying or not a Mov. Average as a  Signal Line and the resulting Signals as Arrows in a Normal (all arrows) or in a Reverse Mode (without showing up any resulting successive and of same type arrows). Analytically fo
FREE
Paula Bollinger Bands Strategy
Francisco Gomes Da Silva
3.67 (3)
Bollinger bands out/in strategy A strategy created by Joe Ross, and very useful for finding trades when the market is overloaded. Indicator You don't need to find where there are entries on the chart, this indicator shows them for you. The entrance The trade is confirmed when the price closes outside the bollinger bands on a candle and the candle after the price closes inside the bands. comment I want to improve this indicator, so you can help me sending me your reviews and comments, thanks :).
FREE
Cvd Divergence
Thalles Nascimento De Carvalho
CVD Divergence – 전문적인 주문 흐름 및 다이버전스 분석 CVD Divergence는 가격과 Cumulative Delta Volume(CVD) 사이의 신뢰할 수 있는 다이버전스를 감지하기 위해 개발된 기술적 지표입니다. 실제 주문 흐름이 가격 움직임을 확인하지 않을 때를 정확하게 포착하여, 잠재적 추세 전환, 매수·매도 세력의 소진, 기관의 시장 조작 가능성을 보여줍니다. 이 지표는 공격적인 거래량 분석과 가격 구조 해석을 결합해 명확하고 객관적이며 빠른 신호를 제공합니다. 지표 기능 CVD Divergence는 누적 델타 거래량을 사용하여 주문 흐름의 방향과 가격 방향을 비교합니다. 두 값이 크게 괴리될 경우 차트에 시각적 표시를 남기고 다이버전스 방향을 명확하게 보여줍니다. 다음과 같은 상황을 감지합니다: 강세 다이버전스 (가격이 하락하지만 CVD가 상승할 때) 약세 다이버전스 (가격이 상승하지만 CVD가 하락할 때) 매수·매도 세력의 힘 고갈 기관 주문 불균형으로
Binary MACD
Bogdan Kupinsky
Индикатор, показывающий момент преодоления нулевой отметки индикатора MACD.  Подходит для бинарной торговли, т.к. имеется возможность посчитать точность сигналов, в зависимости от времени экспирации. Входные параметры Period of SMA1  - Период 1 скользящей средней Period of SMA2 -  Период 2 скользящей средней Period of SMA3 -  Период 3 скользящей средней Price Type - Тип цены, используемый индикатором MACD Invert signals  - Возможность давать инвертированные сигналы (для работы по тренду) Inform
ToolBot Probabilistic Analysis
Josue De Matos Silva
4 (1)
ToolBot Probabilistic Analysis - FREE   An effective indicator for your negotiations The toolbot indicator brings the calculation of candles and a probabilistic analysis so that you have more security on your own. Also test our  FREE tops and bottoms indicator: :   https://www.mql5.com/pt/market/product/52385#description Also test our  FREE (RSI, ATR, ADX, OBV) indicator:   https://www.mql5.com/pt/market/product/53448#description Try our EA ToolBot for free:   https://www.mql5.com/market/prod
FREE
Schaff Trend Cycle STC
Mohammad Taher Halimi Tabrizi
The Schaff Trend Cycle indicator is the product of combining Slow Stochastics and the moving average convergence/divergence (MACD). The MACD has a reputation as a trend indicator, but it's also notorious for lagging due to its slow responsive signal line. The improved signal line gives the STC its relevance as an early warning sign to detect currency trends. this indicator is converted from Trading View code of STC Indicator - A Better MACD [SHK]
HLC bar MT5 Wyckoff
Eduardo Da Costa Custodio Santos
MT5에 대한 표시기 "HLC_bar_MT5 Wyckoff"는 거래 시 분석을 용이하게 하기 위해 생성되었습니다. HLC Bar는 Richard Wyckoff가 사용했으며 현재 "VSA" 작업에서 널리 사용됩니다. Wyckoff는 High, Low 및 Close를 사용하면 그래프가 훨씬 더 명확하고 분석하기 쉽다는 것을 발견했습니다. 표시기 "HLC_bar_MT5 Wyckoff"는 다음을 허용합니다. # 막대 너비를 변경합니다. # 막대를 같은 색으로 둡니다. # 그리고 같은 가격으로 열리고 닫힌 바를 강조 표시합니다. 색상과 너비는 설정에서 쉽게 수정할 수 있습니다. 지표를 사용하려면 차트로 끌어다 놓기만 하면 됩니다. Wyckoff는 볼륨과 함께 사용할 때 HLC 차트를 막대 그래프라고 불렀습니다.
Finding Divergence RSI
Mykhailo Zakervashevych
4 (1)
Finding Divergence RSI  is a professional MetaTrader 5 indicator designed for automatic detection and visualization of classic and hidden divergences using the RSI indicator. The indicator works directly on the price chart, displaying arrows at divergence points and optionally drawing trend lines on both price and RSI charts. Divergence Types 1. Classic Divergences Classic Bullish : Price forms Lower Low (LL), RSI forms Higher Low (HL) Signal: Trend reversal to upside Classic Bearish : Price fo
FREE
The   OHLC indicator   shows the current and historical values of High, Low, Open, Close and Mid for a specific time period. It can plot the current values or the values from the previous session. The indicator's range can be calculated from a daily, weekly, monthly, or user-specified session. Levels High  of the current or previous session. Low  of the current or previous session. Open  of current or previous session. Close  of the current or previous session. Midpoint  of the current or prev
FREE
MACD indicators
Xiao Dong Feng
MACD indicators https://mql5.com This MACD indicator looks slightly different from the MACD indicator found in many other charting software. When the value of the signal line parameter is greater than the value of the MACD parameter, the indicator will give a buy prompt, and when the signal line parameter is less than the value of the MACD parameter, the indicator will give a sell prompt.
FREE
MACD divergence indicator finds divergences between price chart and MACD indicator and informs you with alerts (popup, mobile notification or email) . Its main use is to find trend reversals in the chart. Always use the divergence indicators with other technical assets like support resistance zones, candlestick patterns and price action to have a higher possibility to find trend reversals. Three confirmation type for MACD divergences: MACD line cross zero level Price returns to previous H/L Crea
FREE
VolumeBasedColorsBars
Henrique Magalhaes Lopes
VolumeBasedColorsBars — Free Powerful Volume Analysis for All Traders Unlock the hidden story behind every price bar! VolumeBasedColorsBars is a professional-grade, 100% FREE indicator that colorizes your chart candles based on real, adaptive volume analysis. Instantly spot surges in market activity, identify exhaustion, and catch the moves that matter. This indicator gives you:    • Dynamic color-coded bars for instant volume context    • Adaptive thresholds based on historical, session-awar
FREE
Zero Lag MACD
Flavio Javier Jarabeck
For those who are fans of the traditional MACD ( Moving Average Convergece/Divergence ) indicator, here it is a way faster indicator that could be very useful for intraday trading. Of course it could be used in higher timeframes, with the proper settings. Here at Minions Labs we always encourage traders to calibrate every single indicator you have to extract and distill every drop of good information it has for you. And this is the case with this speedy friend... This Zero Lag MACD could be used
Detect divergence (classic, hidden) price and all oscillator indicator include: RSI, CCI, MACD, OSMA, Stochastic, Momentum, Awesome Oscillator (AO), Accelerator Oscillator (AC), Williams Percent Range (WPR), Relative Vigor Index (RVI), Rate of Change (ROC). Confirm reversal with dochian channel for to improve signal quality. Divergence is when the price of an asset is moving in the opposite direction of a technical   indicator , such as an oscillator, or is moving contrary to other data. Diverge
The MultiFrameTrendAnalyzer is a versatile MetaTrader 5 (MT5) indicator designed to provide multi-timeframe trend analysis using Moving Average (MA) crossovers. This indicator synchronizes trend signals across multiple timeframes (M1, M5, M15, M30, H1, H4, D1, W1, MN1) and displays them with intuitive visual cues, including a colored trend line, signal arrows, and a customizable dashboard. Features Multi-Timeframe Analysis : Evaluates trends across up to nine timeframes, allowing traders to conf
FREE
RelicusRoad MACD v2 MT5
Relicus LLC
4.77 (22)
이동 평균 수렴 발산(MACD) 거래 전략은 추세와 흐름 방향의 변화를 식별하는 데 사용되는 인기 있는 기술 분석 도구입니다. MACD는 12기간의 지수 이동 평균(EMA)에서 26기간의 EMA를 빼서 계산됩니다. "신호 선"이라고 불리는 9기간의 EMA는 MACD 위에 표시되어 매수 및 매도 신호를 트리거로 작용합니다. MACD 선이 신호 선 위에 있으면 매수 트렌드로 간주되고, 신호 선 아래에 있으면 매도 트렌드로 간주됩니다. 거래자들은 종종 이 정보를 사용하여 잠재적인 매수 및 매도 기회를 파악합니다. MACD는 다양한 방식으로 사용될 수 있는 다재다능한 지표입니다. 일반적으로 사용되는 몇 가지 방법은 다음과 같습니다. 교차: MACD 선이 신호 선 위로 크로스되면 매수 교차가 발생하고, MACD 선이 신호 선 아래로 크로스되면 매도 교차가 발생합니다. 발산: MACD가 새로운 고점을 형성하면서 기초 자산이 그렇지 않은 경우 매수 발산이 발생하고, MACD가 새로운 저점을 형성
FREE
Impulse MACD
Elie Baptiste Granger
5 (1)
The Impulse MACD is a technical indicator that combines the power of multiple moving averages to create a unique momentum oscillator. Unlike traditional MACD indicators, this tool uses three different moving averages applied to high, low, and weighted price data to generate more precise market impulse signals. Its strength is its excellent filtering capability during ranging markets. Visual Elements Color-coded Histogram : Dynamic green/red bars that change color based on momentum direction Sign
FREE
버전 4.4 다중 시간대 확인 기능을 갖춘 Engulfing Candlestick Patterns 감지 전문 지표 주요 기능: 유연한 시간대 구성 확정을 위한 하위 시간대를 완벽하게 사용자 정의 가능 M1-M5-M15, M5-M15-H1, M15-H1-H4 등 원하는 조합으로 사용 가능 모든 거래 스타일 및 전략에 적용 가능 3단계 신호 확인 약한 확인(맞춤형 TF) - 노란색 화살표 중간 확인(맞춤형 TF) - 파란색 화살표 강한 확인(맞춤형 TF) - 녹색/빨간색 화살표 재도색 없이 안정적인 작동 화살표는 한 번 그려지며 사라지지 않습니다. 확정을 위해 마감된 캔들만 사용 허위 신호 방지 모든 거래 스타일에 적용 가능 스캘퍼: M1-M2-M5 데이 트레이더: M5-M15-H1 스윙 트레이더: M15-H1-H4 장기 트레이더: H1-H4-D1 스마트 알림 시스템 현재 막대 신호에 대해서만 알림이 전송됩니다. 지표 추가 시 과거 신호에서 스팸
Breakout Finder MT5
Quang Huy Quach
5 (1)
The "Breakout Finder" is a technical indicator designed to automatically identify potential price breakouts and breakdowns on a chart. The highlight of this indicator is its robust signal filtering system, which helps traders avoid false signals (fakeouts) and focus on higher-probability trading opportunities. Key Features Automatic Pivot Point Detection: The indicator automatically identifies significant pivot highs and lows on the chart to establish potential support and resistance levels. Bre
FREE
Divergence Force
Alessandro Riggi
4.5 (2)
Divergence Force 다이버전스 지표 1.0 설명 Divergence Force 은 자산의 가격과 MACD(이동 평균 수렴 발산) 간의 다이버전스를 식별하기 위해 설계된 지표입니다. 이 지표는 가격과 MACD의 고점 및 저점에 자동으로 추세선을 그려 잠재적인 거래 기회를 강조합니다. 주요 기능 자동 다이버전스 식별 : 지표는 가격과 MACD 간의 강세 및 약세 다이버전스를 자동으로 감지합니다. 추세선 추적 : 가격의 연속적인 고점과 저점에 자동으로 추세선을 그리며, 이를 MACD의 고점 및 저점과 비교합니다. 매수 및 매도 신호 : 다이버전스가 식별되면 차트에 명확하게 매수("Buy") 및 매도("Sell") 신호를 표시합니다. 다이버전스가 감지되지 않으면 "Neutral"을 표시합니다. 표준 MACD 매개변수 : 표준 MACD 매개변수(12, 26, 9)를 사용하여 계산하여 신뢰할 수 있고 인식된 결과를 보장합니다. 다양한 시간대와의 호환성 : 1시간 시간대에서 작동하도록
FREE
Hi Low Last Day
Igor Vishnevskii
The Hi Low Last Day ( Hi Lo Last Day ) indicator shows the high and low of the last trading day and the second trading day, as well as the minimum and maximum of last week . There are many trading strategies on the daily levels. This indicator is indispensable when using such trading strategies. In fact, everything is simple in trading, you just need to understand and accept it for yourself. There is only price!!! What is price? This is the level on the chart. The level is the price that the buy
이 제품의 구매자들이 또한 구매함
Neuro Poseidon MT5
Daria Rezueva
5 (11)
Neuro Poseidon is a new indicator by Daria Rezueva. It combines precise trading signals with adaptive TP/SL levels - creating best possible trades as a result! Message me and get  Neuro Poseidon Assistant  as a gift to automize your trading process! What makes it stand out? 1. Proven profitability on all assets and timeframes 2. Only confirmed BUY and SELL signals present on the chart 3. Adaptive TP & SL levels generated by the software for each trade 4. Easy to understand - suitable for al
SuperScalp Pro
Van Minh Nguyen
4.65 (26)
SuperScalp Pro – 고급 멀티 필터 스캘핑 지표 시스템 SuperScalp Pro는 클래식 Supertrend와 여러 지능형 확인 필터를 결합한 고급 스캘핑 지표로, 거래 기회를 식별하는 데 도움을 줍니다. M1부터 H4까지 다양한 시간대에서 효율적으로 작동하며, XAUUSD, BTCUSD 및 주요 Forex 통화쌍에 최적화되어 있습니다. 이 지표는 명확한 매수 및 매도 신호를 제공하며, ATR 기반으로 진입가, 손절가, 익절가를 자동 계산하여 보다 효과적인 리스크 관리를 지원합니다. Fibonacci Take Profit 기능은 중요한 가격 구간에서 더 빠르게 포지션을 청산할 수 있도록 하며, 해당 수준 도달 시 알림을 전송합니다. 기본 설정은 Fibonacci Take Profit이 활성화된 상태로 최적화되어 있으며, 보다 안정적이고 일관된 거래 경험에 중점을 둡니다. 차트에 적용하는 것만으로 즉시 사용할 수 있습니다. 고급 사용자를 위해 모든 파라미터는 자유롭게 사용
Entry In The Zone and SMC Multi Timeframe is a real-time 2-in-1 market analysis tool that combines market structure analysis and a No Repaint BUY / SELL signal system into a single indicator, built on Smart Money Concepts (SMC) — a widely adopted framework used by professional traders to understand market structure. This indicator helps you see the market more clearly, make decisions based on structure rather than guesswork, and focus on high-probability zones where price is more likely to react
SMC Intraday Formula
Kareem Abbas
5 (12)
먼저 솔직하게 말하겠습니다. 어떤 인디케이터도 단독으로 당신을 수익성 있게 만들어주지 않습니다. 누군가 그렇게 말한다면, 그는 당신에게 꿈을 파는 것입니다. 완벽한 매수/매도 화살표를 보여주는 모든 인디케이터는 완벽하게 보이도록 만들 수 있습니다 — 단지 올바른 과거 구간을 확대하고 승리한 거래만 캡처하면 됩니다. 우리는 그렇게 하지 않습니다.  SMC Intraday Formula는 도구입니다. 시장 구조를 읽고, 가장 높은 확률의 가격 구간을 표시하며, 현재 스마트 머니의 흐름이 어떻게 보이는지 아주 단순한 언어로 보여줍니다. 최종 결정은 여전히 당신이 합니다. 실행도 당신이 합니다. 하지만 이제는 희망이 아니라 정확성으로 거래하게 됩니다. 우리는 이 인디케이터를 지난 약 3년 동안 골드(XAUUSD) 및 주요 외환 통화쌍의 데이 트레이딩 스캘핑에 사용해 왔습니다. M1, M5, M15, M30에서 우리의 핵심 도구입니다. 이 도구는 미래를 예측하려 하지 않습니다 — 지금 형성
Divergence Bomber
Ihor Otkydach
4.9 (89)
이 지표를 구매하신 분께는 다음과 같은 혜택이 무료로 제공됩니다: 각 거래를 자동으로 관리하고, 손절/익절 수준을 설정하며, 전략 규칙에 따라 거래를 종료하는 전용 도우미 툴 "Bomber Utility" 다양한 자산에 맞게 지표를 설정할 수 있는 셋업 파일(Set Files) "최소 위험", "균형 잡힌 위험", "관망 전략" 모드로 설정 가능한 Bomber Utility의 셋업 파일 이 전략을 빠르게 설치, 설정, 시작할 수 있도록 돕는 단계별 영상 매뉴얼 주의: 위의 모든 보너스를 받기 위해서는 MQL5 개인 메시지 시스템을 통해 판매자에게 연락해 주세요. 독창적인 커스텀 지표인 “Divergence Bomber(다이버전스 봄버)”를 소개합니다. 이 지표는 MACD 다이버전스(괴리) 전략을 기반으로 한 올인원(All-in-One) 거래 시스템입니다. 이 기술 지표의 주요 목적은 가격과 MACD 지표 간의 다이버전스를 감지하고, **향후 가격이 어느 방향으로 움직일지를 알려주는
ScalpPoint
Temirlan Kdyrkhan
ScalpPoint is a powerful trading companion designed to generate high-probability entry signals with dynamic TP/SL/DP levels based on volatility. Built-in performance tracking shows win/loss stats, PP1/PP2 hits, and success rates — all updated live. Key Features: Buy/Sell signals with adaptive volatility bands Real-time TP/SL/DP levels based on ATR Built-in MA Filter with optional ATR/StdDev volatility Performance stats panel (Success, Profit/Loss, PP1/PP2) Alerts via popup, sound, push, or emai
Power Candles MT5
Daniel Stein
5 (8)
Power Candles V3 - 자체 최적화 강도 지표 파워 캔들 V3는 적용된 모든 차트에서 통화 및 상품의 강세를 실행 가능한 거래 계획으로 전환합니다. 단순히 캔들에 색상을 입히는 대신, 백그라운드에서 실시간 자동 최적화를 수행하여 현재 보고 있는 종목에 대한 최적의 손절매, 익절 및 신호 임계값을 제공합니다. 한 번의 클릭으로 실시간 거래에 적용할 수 있으며, 진입점, 손절매 및 익절 선이 정확한 가격에 맞춰 차트에 표시되고, 방향과 함께 알림이 발령됩니다. 이 도구는 Stein Investments 에코시스템의 일부입니다. 18개 이상의 도구와 함께 당신의 1대1 AI 트레이딩 멘토 Max.  항상 대기 중, 모든 인디케이터를 깊이 있게 이해, 무언가를 차근차근 생각해보고 싶은 순간에 도움을 줍니다.  https://stein.investments 에서 만나보세요 매 종가 바마다 3,000회 이상의 트레이딩 시뮬레이션. 9가지 강도 상태. 2가지 전략을 병렬로 테스트.
SmartScalping
Temirlan Kdyrkhan
SmartScalping is a powerful trading companion designed to generate high-probability entry signals with dynamic TP/SL/DP levels based on volatility. Built-in performance tracking shows win/loss stats, PP1/PP2 hits, and success rates — all updated live. Key Features: Buy/Sell signals with adaptive volatility bands Real-time TP/SL/DP levels based on ATR Built-in MA Filter with optional ATR/StdDev volatility Performance stats panel (Success, Profit/Loss, PP1/PP2) Alerts via popup, sound, push, or e
SignalTech MT5
Yue Wang
5 (26)
SignalTech MT5 is an unique fully rule based trading system for EURUSD, USDCHF, USDJPY, AUDUSD, NZDUSD, EURJPY, AUDJPY, NZDJPY, CADJPY.  All the winning trades with chart setups are published on the comments page. 2026-05 4107 Pips (Until 05-29 NY Closed) 2026-04 2243 Pips 2026-03 2165 Pips 2026-02 2937 Pips 2026-01 2624 Pips 2025-12 1174 Pips It can generate signals with Buy/Sell Arrows and Pop-Up/Sound Alerts. Each signal has clear Entry and Stop Loss levels, which should be automatically flag
TrendProMaster
Temirlan Kdyrkhan
MasterTrend Indicator for MT5 A powerful trend-following and signal-evaluation tool MasterTrend   is a custom MT5 indicator that combines Moving Averages and ATR-based risk/reward logic to generate clear buy/sell signals. It visualizes dynamic SL/TP levels, evaluates past trade outcomes, and displays win/loss statistics in a clean on-chart panel. Key features include: Buy/Sell signals based on MA crossovers ATR-based SL/TP1/TP2/TP3 levels with visual lines and labels Signal outcome tracking wit
MasterTrend
Temirlan Kdyrkhan
MasterTrend Indicator for MT5 A powerful trend-following and signal-evaluation tool MasterTrend   is a custom MT5 indicator that combines Moving Averages and ATR-based risk/reward logic to generate clear buy/sell signals. It visualizes dynamic SL/TP levels, evaluates past trade outcomes, and displays win/loss statistics in a clean on-chart panel. Key features include: Buy/Sell signals based on MA crossovers ATR-based SL/TP1/TP2/TP3 levels with visual lines and labels Signal outcome tracking wit
소개       Quantum Breakout PRO   , 브레이크아웃 존 거래 방식을 변화시키는 획기적인 MQL5 지표! 13년 이상의 거래 경험을 가진 숙련된 트레이더 팀이 개발한       퀀텀 브레이크아웃 PRO       혁신적이고 역동적인 브레이크아웃 존 전략으로 거래 여정을 새로운 차원으로 끌어올리도록 설계되었습니다. Quantum Breakout Indicator는 5개의 이익 목표 영역이 있는 브레이크아웃 영역의 신호 화살표와 브레이크아웃 상자를 기반으로 한 손절 제안을 제공합니다. 초보자 거래자와 전문 거래자 모두에게 적합합니다. Quantum EA 채널:       여기를 클릭하세요 중요한! 구매 후 설치 매뉴얼을 받으려면 개인 메시지를 보내주십시오. 추천: 기간: M15 통화쌍: GBPJPY, EURJPY, USDJPY,NZDUSD, XAUUSD 계정 유형: 스프레드가 매우 낮은 ECN, Raw 또는 Razor 브로커 시간: GMT +3 중개인 :
이 제품은 2026년 시장에 맞게 업데이트되었으며 최신 MT5 빌드에 최적화되었습니다. 가격 업데이트 안내: Smart Trend Trading System은 현재 $99 에 제공됩니다. 다음 30회 구매 후 가격은 $199 로 인상됩니다. 특별 혜택: Smart Trend Trading System 구매 후 저에게 개인 메시지를 보내시면 Smart Universal EA를 무료 로 받을 수 있으며, Smart Trend 신호를 자동 거래로 전환할 수 있습니다. Smart Trend Trading System은 리페인트 없음, 재그리기 없음, 지연 없음의 완전한 트레이딩 시스템으로, 더 깨끗한 신호, 더 나은 추세 방향, 그리고 더 체계적인 시장 거래 방식을 원하는 트레이더를 위해 제작되었습니다. Online course , manual and download presets . 이 시스템은 추세 감지, 반전 구간, Smart Cloud, 트레일링 스톱 로직, 지지와 저항, 캔들 색
Azimuth Pro
Ottaviano De Cicco
5 (7)
Azimuth Pro V2: Synthetic Fractal Structure and Confirmed Entries for MT5 Overview Azimuth Pro is a multi-level swing structure indicator by Merkava Labs . Four nested swing layers, swing-anchored VWAP, ABC pattern detection, three-timeframe structural filtering, and closed-bar confirmed entries — one chart, one workflow from micro-swings to macro-cycles. This is not a blind signal product. It is a structure-first workflow for traders who care about location, context, and timing. V2 Launch Offe
Quantum TrendPulse
Bogdan Ion Puscasu
5 (25)
SuperTrend   ,   RSI   ,   Stochastic   의 힘을 하나의 포괄적인 지표로 결합하여 트레이딩 잠재력을 극대화하는 궁극의 트레이딩 도구   인 Quantum TrendPulse를   소개합니다. 정밀성과 효율성을 추구하는 트레이더를 위해 설계된 이 지표는 시장 추세, 모멘텀 변화, 최적의 진입 및 종료 지점을 자신 있게 식별하는 데 도움이 됩니다. 주요 특징: SuperTrend 통합:   주요 시장 추세를 쉽게 따라가고 수익성의 물결을 타세요. RSI 정밀도:   매수 과다 및 매도 과다 수준을 감지하여 시장 반전 시점을 파악하는 데 적합하며 SuperTrend 필터로 사용 가능 확률적 정확도:   변동성이 큰 시장에서 숨겨진 기회를 찾기 위해 확률적 진동   을 활용하고 SuperTrend의 필터로 사용 다중 시간대 분석:   M5부터 H1 또는 H4까지 다양한 시간대에 걸쳐 시장을 최신 상태로 유지하세요. 맞춤형 알림:   맞춤형 거래 조건이 충족되면
FX Trend MT5 NG
Daniel Stein
5 (6)
FX Trend NG: 차세대 멀티 마켓 트렌드 인텔리전스 개요 FX Trend NG 는 다중 시간 프레임 기반의 전문 트렌드 분석 및 시장 모니터링 도구입니다. 몇 초 만에 전체 시장 구조를 파악할 수 있도록 설계되었습니다. 여러 차트를 일일이 전환할 필요 없이, 어떤 종목이 추세에 있는지, 어디에서 모멘텀이 약화되고 있는지, 그리고 어떤 시간 프레임이 서로 정렬되어 있는지 즉시 확인할 수 있습니다. 출시 기념 특별 혜택 – FX Trend NG 를 $30 (6개월) 또는 $80 평생 라이선스 로 이용할 수 있습니다. 이미 Stein Investments 고객이신가요? -> 메시지를 보내 전용 고객 그룹에 참여하세요. 설정이나 사용 방법이 필요하신가요? -> Stein Investments 공식 페이지 를 방문하세요. 1. FX Trend NG가 특별한 이유 3단계 추세 로직 – 단순한 Buy / Sell이 아닙니다 • 대부분의 지표는 Buy 또는 Sell 두 가지 상태만 제
Gann Made Easy MT5
Oleg Rodin
5 (4)
Gann Made Easy 는 mr.의 이론을 사용하여 최고의 거래 원칙을 기반으로 하는 전문적이고 사용하기 쉬운 Forex 거래 시스템입니다. W.D. 간. 이 표시기는 Stop Loss 및 Take Profit Levels를 포함하여 정확한 BUY 및 SELL 신호를 제공합니다. PUSH 알림을 사용하여 이동 중에도 거래할 수 있습니다. 구매 후 거래 방법 안내 및 유용한 추가 지표를 무료로 받으시려면 저에게 연락주세요! 아마도 Gann 거래 방법에 대해 이미 여러 번 들었을 것입니다. 일반적으로 Gann의 이론은 초보자 거래자뿐만 아니라 이미 거래 경험이 있는 사람들에게도 매우 복잡한 것입니다. Gann의 거래 방식은 이론적으로 적용하기 쉽지 않기 때문입니다. 나는 그 지식을 연마하고 Forex 지표에 최고의 원칙을 적용하기 위해 몇 년을 보냈습니다. 표시기는 적용하기가 매우 쉽습니다. 차트에 첨부하고 간단한 거래 권장 사항을 따르기만 하면 됩니다. 지표는 지속적으로 시장 분석
ARIPoint
Temirlan Kdyrkhan
1 (1)
ARIPoint is a powerful trading companion designed to generate high-probability entry signals with dynamic TP/SL/DP levels based on volatility. Built-in performance tracking shows win/loss stats, PP1/PP2 hits, and success rates all updated live. Key Features: Buy/Sell signals with adaptive volatility bands Real-time TP/SL/DP levels based on ATR Built-in MA Filter with optional ATR/StdDev volatility Performance stats panel (Success, Profit/Loss, PP1/PP2) Alerts via popup, sound, push, or email Cu
Atomic Analyst MT5
Issam Kassas
4.19 (32)
이 제품은 2026년 시장에 맞게 업데이트되었으며 최신 MT5 빌드에 최적화되었습니다. 가격 업데이트 안내: Atomic Analyst는 현재 $99 에 제공됩니다. 다음 30회 구매 후 가격은 $199 로 인상됩니다. 특별 혜택: Atomic Analyst 구매 후 저에게 개인 메시지를 보내시면 Smart Universal EA를 무료 로 받을 수 있으며, Atomic Analyst 신호를 자동 거래로 전환할 수 있습니다. Atomic Analyst는 리페인트 없음, 재그리기 없음, 지연 없음의 Price Action 거래 인디케이터로, 수동 거래, 신호 명확성, EA 자동화를 위해 설계되었습니다. User manual: settings, inputs and strategy. 가격 움직임, 강도, 모멘텀, 다중 시간대 방향 및 고급 필터를 분석하여 트레이더가 노이즈를 줄이고 약한 세팅을 피하며 더 체계적인 거래 결정을 내릴 수 있도록 돕습니다. 이 인디케이터는 복잡한 시장 계산
Trend Catcher ind mt5
Ramil Minniakhmetov
5 (4)
트렌드 캐처 인디케이터 트렌드 캐처 인디케이터는 개발자가 자체 개발한 맞춤형 적응형 트렌드 분석 지표들을 조합하여 시장 가격 움직임을 분석합니다. 단기적인 노이즈를 제거하고 근본적인 모멘텀 강도, 변동성 확대, 가격 구조 움직임에 집중하여 진정한 시장 방향을 파악합니다. 또한 이동 평균, RSI, 변동성 필터와 같은 맞춤형 지표들을 활용하여 가격을 평활화하고 트렌드를 필터링합니다. 실제 운영 모니터링 및 기타 제품은 다음 링크에서 확인하실 수 있습니다:   https://www.mql5.com/en/users/mechanic/seller 텔레그램에서는 EA나 설정 파일을 판매하지 않습니다. 사기이니 주의하세요. 모든 설정 파일은 블로그에서 무료로 제공됩니다. 중요! 구매 후 즉시 연락 주시면 사용 방법 및 보너스를 드립니다!
M30/H1/H4 스윙 버전 출시 큰 움직임을 잡고 싶으신가요? Gold Signal Swing Pro (M30/H1/H4). 목표: 거래당 $20-$80+. https://www.mql5.com/en/market/product/177643 KURAMA GOLD SIGNAL PRO (MT5) — 7층 필터 탑재 XAUUSD 완벽 트레이딩 시스템 리페인트 없음. 리드로우 없음. 지연 없음. 모든 신호는 확정 후 변하지 않습니다. 구매자 한정 혜택: 매수 라이선스 구매자에게 AI Zone Radar ($59 상당) + PDF 매뉴얼을 무료 제공합니다. 구매 후 MQL5에서 메시지를 보내주세요. AI Zone Radar: https://www.mql5.com/en/market/product/175834 실제 골드 트레이더 커뮤니티에서 사용되며, 정확도와 사용 편의성으로 높은 평가를 받고 있습니다.
Reversion King Indicator
Eugen-alexandru Zibileanu
5 (3)
새로운 왕의 등장 - 인디케이터 + 주문 관리 표시(TP1 + TP2 + TP3) + 선택형 텔레그램 시그널 전송 기능 포함 (무료) (완전한 트레이딩 및 시그널 시스템) 골드를 위한 최고의 EA: Gold Slayer 이 인디케이터는 고급 전략, 사용자 지정 가능한 주문 관리 시스템, 그리고 엔벨로프 확장을 결합한 평균 회귀(mean reversion) 시스템을 포함하고 있습니다. 또한 RSI와 같은 여러 지능형 확인 필터를 통해 높은 확률의 반전 진입 구간을 포착하여 BUY 및 SELL 시그널을 제공합니다. 단순히 거래 방법만 배우는 것이 아니라, 여러 포지션을 효과적으로 관리하고 이전에 수익 중인 오픈 포지션으로 손실 거래를 커버하는 방법까지 익힐 수 있습니다. M5 전용으로 설계 및 최적화되었으며, 유동성이 풍부해 시그널이 더 깔끔하고 신뢰도 높은 BTCUSD와 XAUUSD에서 뛰어난 성능을 발휘합니다. 이 인디케이터는 ATR 기반으로 자동 계산된 진입가, 손절가, 익절가와
Market Structure Order Block Dashboard MT5는 시장 구조와 주요 가격 반응 구역을 차트에서 직접 읽고자 하는 트레이더를 위해 설계된 MT5 지표입니다. BOS, ChoCH, 오더 블록, Fair Value Gap (FVG), 유동성, Kill Zones, Volume Profile 그리고 빠른 분석을 위한 콤팩트한 대시보드를 결합합니다. 이 지표는 시장 구조, ICT 및 Smart Money 개념을 의사결정 프레임워크로 사용하는 트레이더를 대상으로 합니다. 추세 지속, 가능한 반전, 가격 불균형, 유동성 타겟 및 관심 구역을 보다 체계적으로 식별하는 데 도움을 줄 수 있습니다. 구매자를 위한 포함 리소스 구매 후 MQL5 개인 메시지로 요청하시면 완전한 PDF 사용 설명서와 파라미터 설정 팁을 제공해 드립니다. MQL5 개인 메시지를 통한 직접 기술 지원. 1.20 버전은 두 가지 주요 추가 기능을 제공합니다: Pending BOS / Pending
PZ Swing Trading MT5
PZ TRADING SLU
5 (5)
Protect against whipsaws: revolutionize your swing trading approach Swing Trading is the first indicator designed to detect swings in the direction of the trend and possible reversal swings. It uses the baseline swing trading approach, widely described in trading literature. The indicator studies several price and time vectors to track the aggregate trend direction and detects situations in which the market is oversold or overbought and ready to correct. [ Installation Guide | Update Guide | Tro
Crystal Heikin Ashi Signals
Muhammad Jawad Shabir
5 (2)
Crystal Heikin Ashi Signals - Professional Trend & Signal Detection Indicator Advanced Heikin Ashi Visualization with Intelligent Signal System for Manual & Automated Trading Final Price: $149 ---------> Price goes up $10 after every 10 sales . Limited slots available — act fast . Overview Crystal Heikin Ashi Signals is a professional-grade MetaTrader 5 indicator that combines pure Heikin Ashi candle visualization with an advanced momentum-shift detection system. Designed for both manual traders
Smart Structure Concepts MT5
Cristhian Alexander Gaibor Cuasquer
5 (1)
이것은 영역을 그리고 당신이 추측하게 만드는 또 다른 구조 지표가 아닙니다. Smart Structure Concepts는 당신을 위해 시장을 읽습니다 — XAUUSD(금), 외환, 지수, 암호화폐 및 기타 모든 시장 에서 Smart Money Concepts (SMC / ICT) 구조를 실시간으로 표시합니다. 각 영역을 설정하기 위해 입력값에 들어갈 필요 없습니다: 차트의 인터랙티브 대시보드 패널 로, 단 한 번의 클릭으로 표시, 숨기기 또는 조정을 결정할 수 있습니다 — 속성을 열거나 지표를 다시 시작할 필요 없이. 이 도구는 MetaTrader 5용 성장하는 지표 및 패널 세트의 일부입니다 — 모두 11개 언어의 교육 툴팁과 모든 차트에 내장된 시각적 멘토를 갖추고 있습니다. 각 도구는 당신이 거래하는 동안 가르칩니다: 어떤 영역, 신호 또는 레벨에 마우스를 올리면 설명이 차트에 직접 나타납니다. 블랙박스 없음, 맹목적인 주문 없음. 거래하면서 배웁니다. 전체 라인업을 여기서
Trend Screener Pro MT5
STE S.S.COMPANY
4.85 (104)
트렌드 표시기, 트렌드 트레이딩 및 필터링을 위한 획기적인 고유 솔루션, 하나의 도구 안에 내장된 모든 중요한 트렌드 기능! Forex, 상품, 암호 화폐, 지수 및 주식과 같은 모든 기호/도구에 사용할 수 있는 100% 다시 칠하지 않는 다중 시간 프레임 및 다중 통화 표시기입니다. Trend Screener는 차트에 점이 있는 화살표 추세 신호를 제공하는 효율적인 지표 추세 추종 지표입니다. 추세 분석기 표시기에서 사용할 수 있는 기능: 1. 트렌드 스캐너. 2. 최대 이익 분석이 있는 추세선. 3. 추세 통화 강도 측정기. 4. 경고가 있는 추세 반전 점. 5. 경고가 있는 강력한 추세 점. 6. 추세 화살표 Trend Screener Indicator가 있는 일일 분석 예, 일일 신호 성능...등은 여기에서 찾을 수 있습니다. 여기를 클릭하십시오. LIMITED TIME OFFER : Trend Screener Indicator는 50$ 및 평생 동안만 사용할 수 있습니다.
이 제품은 2026년 시장에 맞게 업데이트되었으며 최신 MT5 빌드에 최적화되었습니다. 가격 업데이트 안내: Smart Price Action Concepts는 현재 $200 에 제공됩니다. 다음 30회 구매 후 가격은 $299 로 인상됩니다. 특별 혜택: 구매 후 저에게 개인 메시지를 보내시면 무료 보너스 + 선물 을 받을 수 있습니다. 먼저, 이 트레이딩 도구는 리페인트 없음, 재그리기 없음, 지연 없음의 인디케이터이므로 전문적인 트레이딩에 적합하다는 점을 강조하고 싶습니다. Online course , and manual Smart Price Action Concepts Indicator는 초보자와 경험 많은 트레이더 모두에게 매우 강력한 도구입니다. 20개 이상의 유용한 인디케이터를 하나로 결합하고, Inner Circle Trader Analysis와 Smart Money Concepts Trading Strategies 같은 고급 트레이딩 아이디어를 통합합니다. 이 인디
Meridian Pro
Ottaviano De Cicco
5 (2)
Meridian Pro 2.00: Professional Multi-Timeframe Trend Matrix for MT5 Meridian Pro 2.00 is a professional adaptive trend matrix for MetaTrader 5. It combines the original Meridian trend engine, a clean chart ribbon, closed-bar signal arrows, an 8-timeframe dashboard, Fuel momentum, weighted consensus, synthetic HTF processing and chart-native higher-timeframe context lines. The goal is simple: read current trend, multi-timeframe structure, strength, momentum and EA-ready state from one discipline
Trend Forecaster
Alexey Minkov
5 (7)
Trend Forecaster – Since 2023. The Trend Forecaster indicator utilizes a unique proprietary algorithm to determine entry points for a breakout trading strategy. The indicator identifies price clusters, analyzes price movement near levels, and provides a signal when the price breaks through a level. The Trend Forecaster indicator is suitable for all financial assets, including currencies (Forex), metals, stocks, indices, and cryptocurrencies. You can also adjust the indicator to work on any time
제작자의 제품 더 보기
Time to Close Candle
German David Nino Cifuentes
TimeToClose The "TimeToClose" indicator is an essential tool for traders who need to monitor the remaining time before a candle closes. This indicator displays the remaining time directly on the BID line, providing a clear and precise reference during real-time trading. Key Features: Displays the remaining time for the current candle to close. Direct integration on the BID line for better visualization. Simple and user-friendly configuration. Ideal for all types of traders, from beginners to pro
FREE
MACD Color Histogram for MT4
German David Nino Cifuentes
For MT5 The MACD Histogram Indicator is an enhanced version of the traditional MACD indicator, offering superior insights into market trends and momentum shifts. Unlike the default MACD in MT4, this version features a histogram , making it easier for traders to visualize and interpret market conditions. Advantages over the default MACD indicator: Enhanced Visuals: The histogram provides a bar chart representation of the difference between the MACD line and the signal line, making it simpler to i
Relative Adaptive RSI
German David Nino Cifuentes
RAR (Relative Adaptive RSI) 지표로 트레이딩 전략을 최적화하세요! 이 고급 기술 분석 지표는 상대 강도 지수(RSI)의 힘을 적응 기술과 결합하여 일반적인 오실레이터보다 더 정확하고 신뢰할 수 있는 신호를 제공합니다. RAR 지표란? RAR은 MetaTrader 5를 위해 설계된 지표로, 지수 이동 평균(EMA)과 적응 이동 평균(AMA)을 사용하여 RSI를 부드럽게 하고 동적으로 시장 상황에 맞게 조정합니다. 이 혁신적인 조합은 시장 트렌드 및 강도 변화를 더 큰 정확도와 속도로 감지할 수 있게 합니다. RAR 지표의 장점 동적 적응성 : RAR은 변화하는 시장 조건에 자동으로 적응하여 전통적인 RSI에 비해 신호 정확도를 향상시킵니다. 시장 소음 감소 : EMA 및 AMA를 사용하여 RSI를 부드럽게 하여 시장 소음을 줄이고 더 명확하고 신뢰할 수 있는 신호를 제공합니다. 직관적인 시각화 : 시장 트렌드 및 강도 변화를 식별하는 데 도움이 되는 색상 히스토그
필터:
strazzy
197
strazzy 2024.06.02 12:36 
 

excellent indicator

리뷰 답변