MACD Multi Timeframe Panel
- インディケータ
-
Hacene Harrous
 私は MetaTrader 5 向けに、シンプルで誠実なインジケーターを作っています。専門はマルチタイムフレームのダッシュボードです。一つの視点(RSI、トレンド、MACD、ADX、ストキャスティクス、CCI、または一目均衡表のすべて)を複数の時間足で一目で表示し、チャートを切り替える手間をなくします。どれも軽量で、アラートは決してリペイントせず、すべて無料です。取引の役に立ったなら、短いレビューが何よりの支援になります。
 - バージョン: 1.1
- アップデート済み: 27 8月 2026
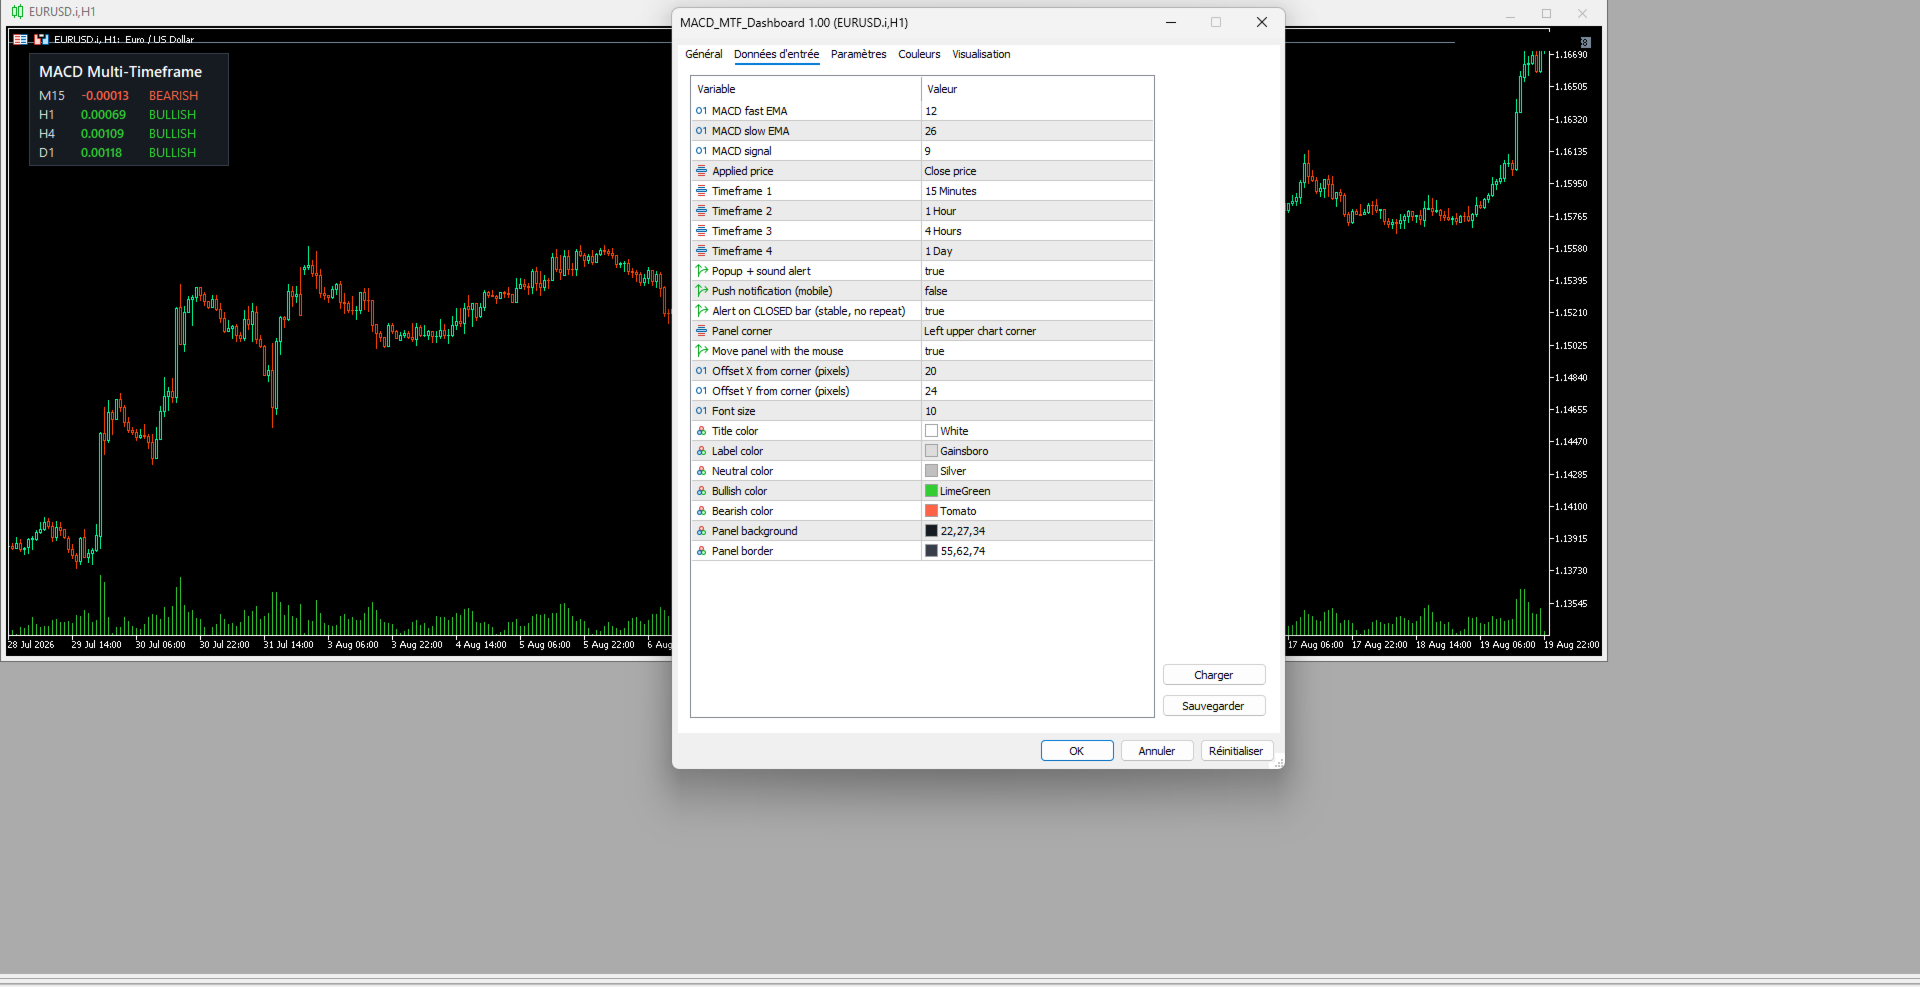
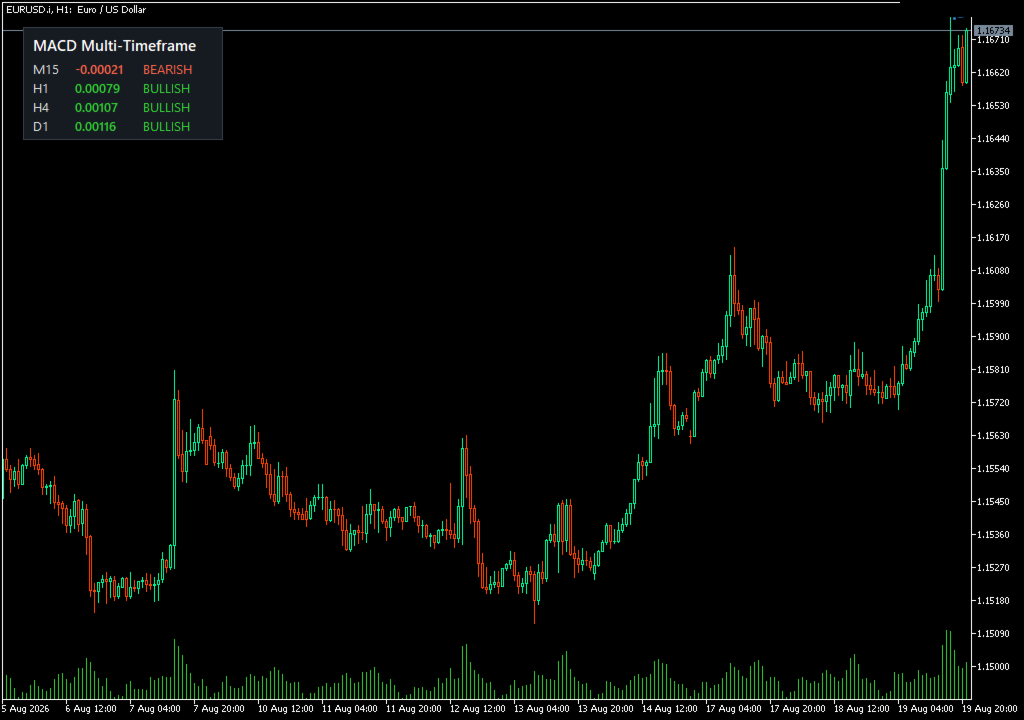
MACD Multi-Timeframe Dashboard shows whether MACD is bullish or bearish on four timeframes at once, by comparing the MACD line to its signal line on each timeframe. You read the direction of momentum across the whole market in a single panel instead of switching charts. By default it covers the M15, H1, H4 and D1 timeframes, and the fast, slow and signal settings are configurable. Each timeframe appears in green when momentum is bullish and red when it is bearish, and the histogram value is shown for context. An alert is available on a bullish or bearish cross, based on the closed bar so it does not repaint. The panel can be anchored to a corner or dragged anywhere with the mouse, and it remembers its place. It works on any symbol and any timeframe. This tool displays momentum and is not a signal system, so trade with your own risk management. It is free to use, and it is part of the laPanthere multi-timeframe suite on my profile.