Understudy
- 지표
- 버전: 1.11
- 활성화: 5

Understudy shows which market regime you are in, and it tells you when its own machine learning is
not good enough to be trusted.
Most machine learning indicators ask you to take the model on faith. This one measures itself
against a fixed structural baseline on every closed bar and publishes the verdict on the chart. It
will tell you, in writing, when it is losing.
HOW IT WORKS
Two forecasters run side by side.
The Principal is a fixed structural model. Its weights never change, so it stays stable and
predictable in every market.
The Understudy is a compact neural network, seven inputs to six hidden neurons to one output, that
trains itself directly on your chart as bars close. It only ever learns from outcomes that have
already resolved: on any bar it may train on an earlier feature vector whose result is now known,
never on the bar in front of it.
Both models read the same seven normalised inputs:
Linear regression slope measured in ATR units
Distance from the mean measured in standard deviations
Directional efficiency of the recent swing
Volatility regime against its own long average
Smoothed candle body dominance
Participation against median volume
Higher timeframe alignment
Every input is normalised by ATR, by standard deviation or by its own median, so one build behaves
consistently on a currency pair, on gold and on an index without retuning.
THE SELF AUDIT
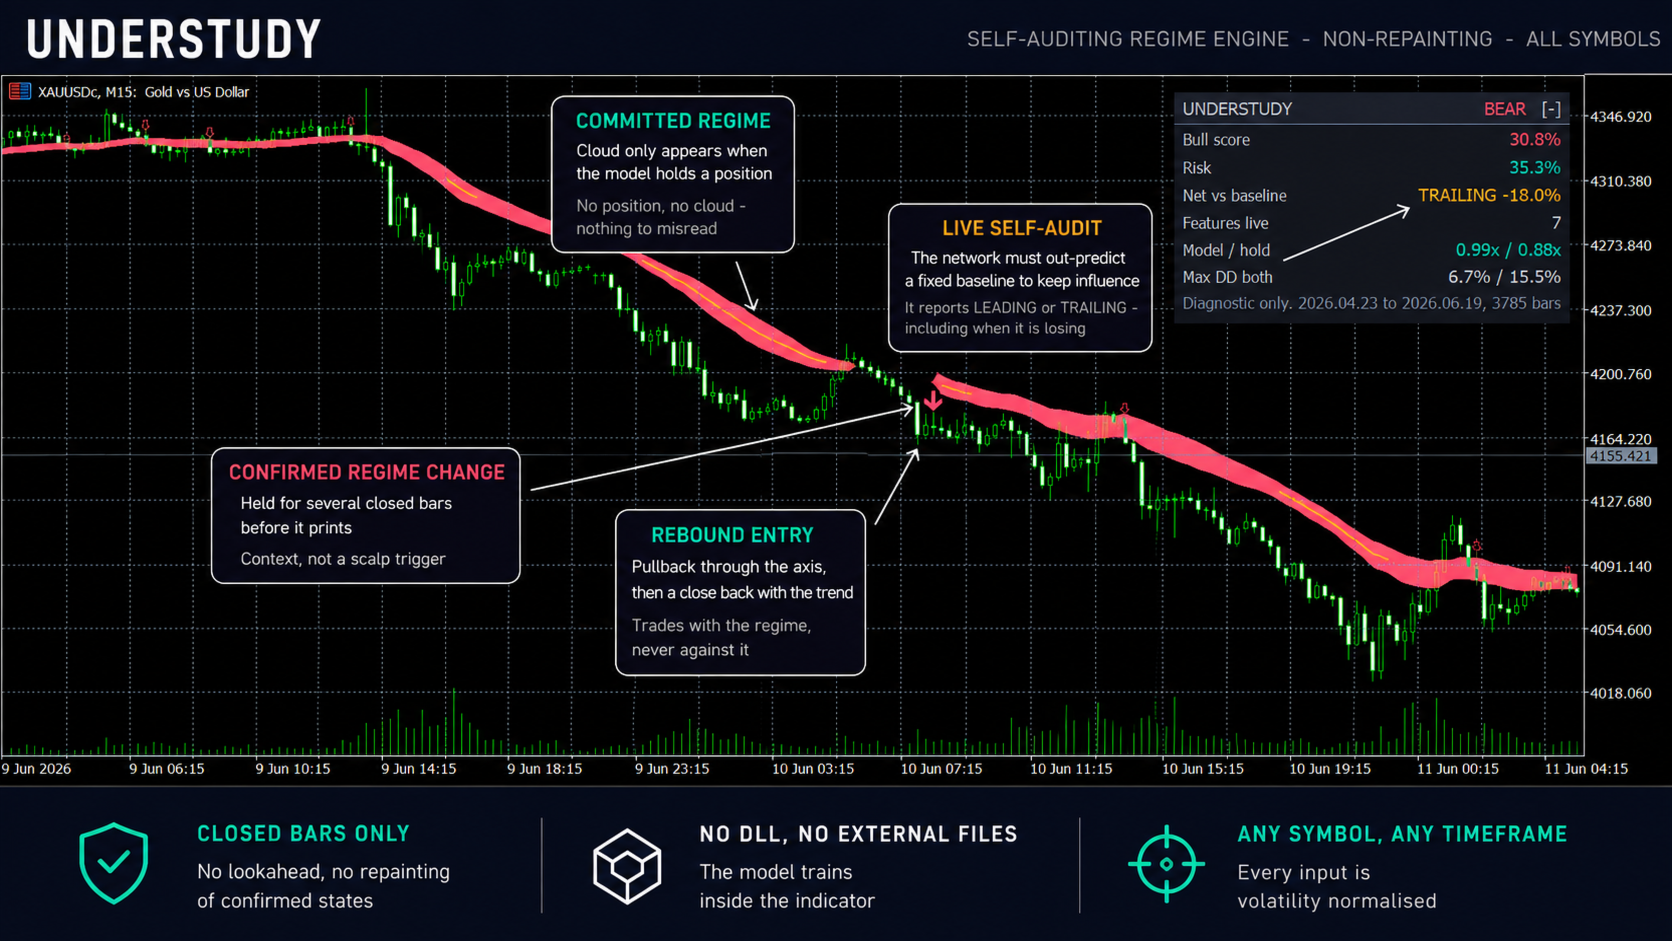
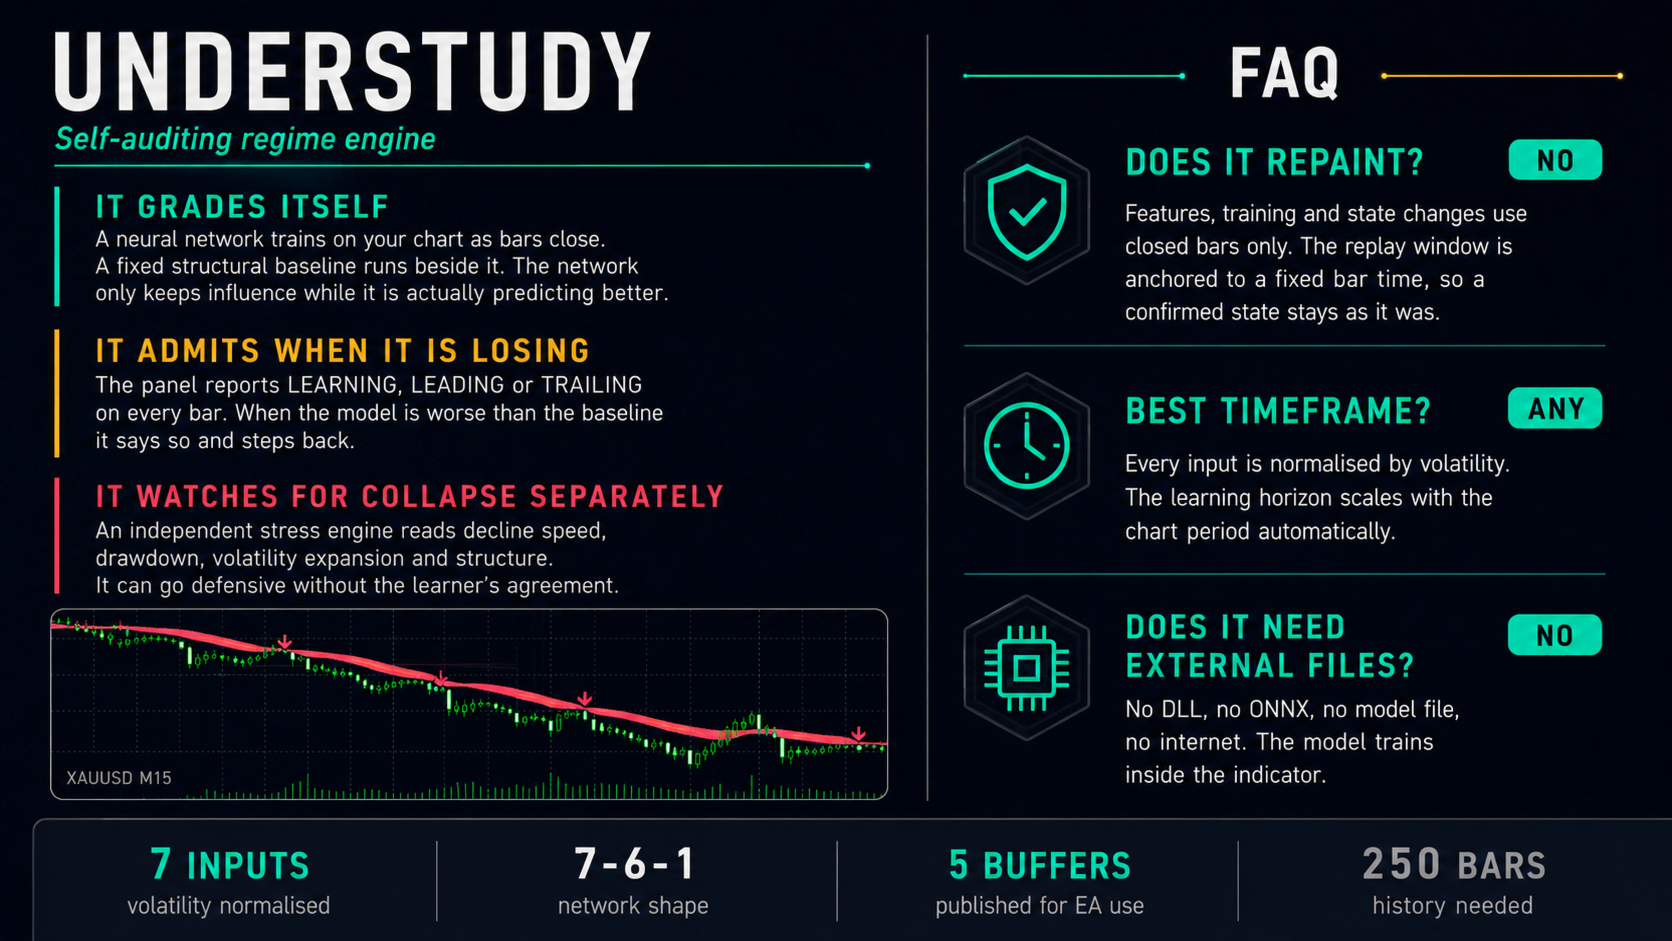
The indicator keeps a running error for the network and for the baseline, and compares them. The
panel reports one of three verdicts:
LEARNING - not enough resolved samples yet, the network's influence stays capped low
LEADING - the network is out-predicting the baseline, its influence is raised
TRAILING - the network is worse than the baseline, its influence is cut to a floor
You can watch the model lose. That is deliberate. An indicator that only ever reports that it is
right is not reporting anything.
INDEPENDENT STRESS LAYER
A separate engine reads price directly, with no input from either model: speed of decline,
drawdown from the recent high, volatility expansion and long term structure. It can force the
defensive state on its own, so a collapse does not have to wait for the learner to agree.
Its thresholds scale with each instrument's own volatility, so the same settings mean the same
thing on a quiet currency pair and on gold.
WHAT YOU SEE
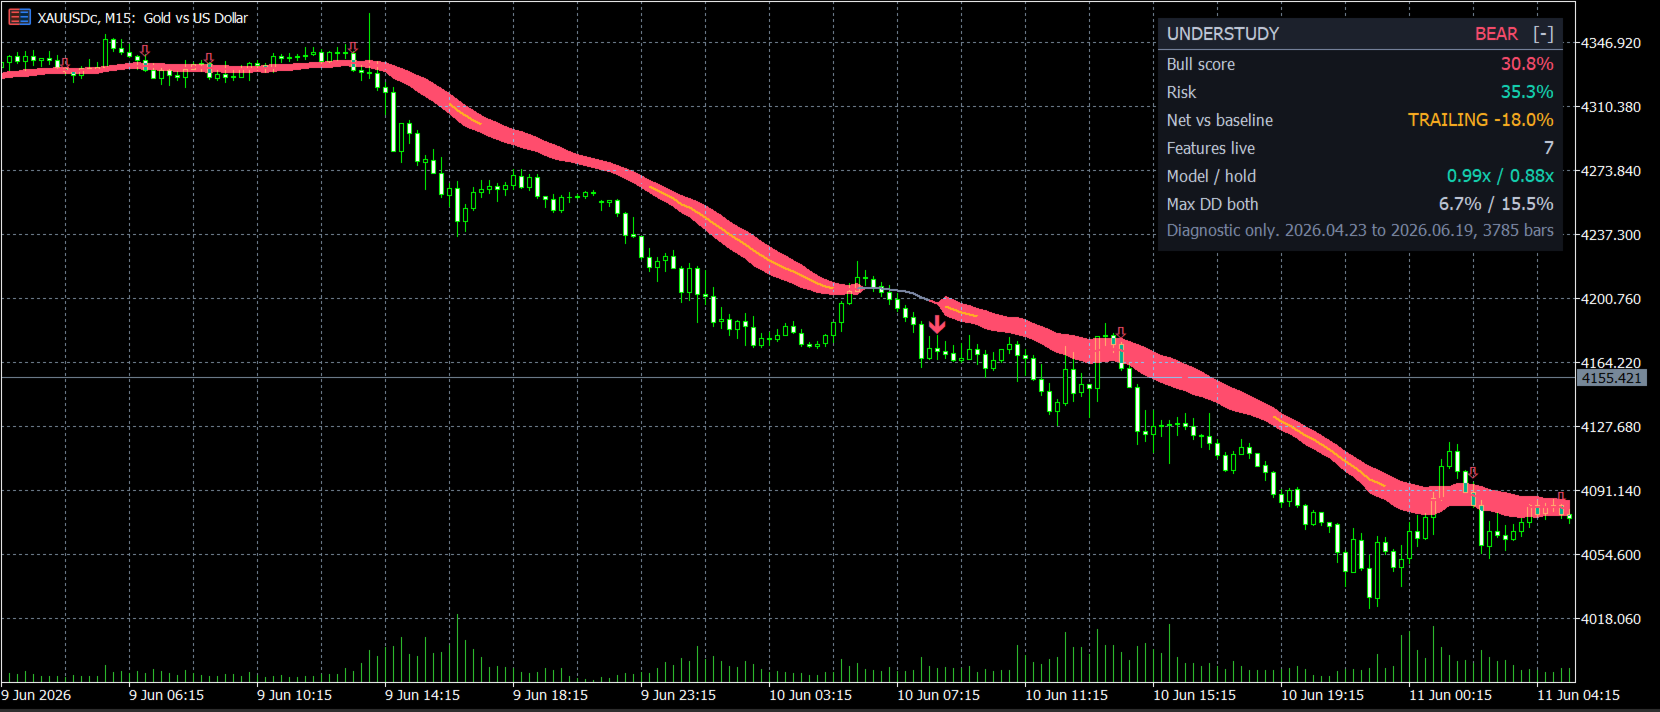
A coloured cloud marks the committed regime. When the model holds no position there is no cloud at
all, only the axis line, because an empty chart is the honest picture of holding nothing.
The axis line carries the finer state, including caution, which is when the regime is still intact
but the evidence is turning. Both the regime states and the caution state have to be confirmed over
several closed bars before they change, so the chart does not flicker.
Large arrows mark confirmed regime changes. These are context, and they are late by design.
Small arrows mark rebound entries inside a regime that is already confirmed: price pulls back
through the axis by a real distance, then closes back on the regime's side. These trade with the
committed trend, never against it, and a cooldown keeps a choppy pullback to one arrow instead of
six.
NON-REPAINTING
Every feature, every training step and every state change runs on closed bars only. The forming bar
displays the last confirmed state and never feeds the model.
The replay window is anchored to a fixed bar time rather than measured back from the newest bar. A
sliding window would restart the learner one bar later on every new bar, change its training path
and quietly alter states it had already confirmed. This one grows instead of sliding, so a
confirmed state stays as it was.
There are no higher timeframe lookahead reads: the parent timeframe is only ever read at a bar that
has already closed there.
BUILT-IN COMPARISON
The panel carries a lagged long/flat comparison against buy and hold over a window you choose,
applying your chosen transition cost on every switch, and charging a reversal as the two
transactions it really is.
This is a diagnostic for judging the model's behaviour on the instrument in front of you, not a
strategy backtest and not a projection. It excludes spread, slippage, swap, commission, tax and
execution constraints, and it will show you the periods where the model trails the market.
FOR EA DEVELOPERS
Five machine readable buffers are published for iCustom:
Buffer 12 - state code: 2 bull, 1 caution, 0 flat or cash, -1 bear caution, -2 bear
Buffer 13 - bull score, 0 to 1
Buffer 14 - risk, 0 to 1
Buffer 15 - audit skill, positive means the network is beating the baseline
Buffer 16 - rebound signal: 1 long, -1 short, 0 none
SETTINGS
Mode selects Allocation, which is long or cash and never short, or Signal, which adds a confirmed
bear state. Auto picks by symbol type.
Response controls adaptation speed and how many closed bars a change must survive. Balanced is the
starting point; Fast reacts sooner; Smooth prioritises stability.
Selectivity controls how much evidence is required before a regime is confirmed.
The rebound group controls pullback depth in ATR, how many bars the pullback may take, the cooldown
between arrows, and whether rebounds are suppressed while the regime is in caution.
The panel can be dragged anywhere on the chart and collapsed to its title bar. Its position is
remembered across timeframe switches.
COMPATIBILITY
All symbols and all timeframes. Around 250 bars of history are needed before the first state is
printed; the panel says so plainly when there are not enough.
No DLL, no ONNX file, no external model file, no internet access, no data files. Everything runs in
the indicator. Compiled for X64 Regular.
Alerts by popup, push notification and email. Email requires prior configuration in MT5 under
Tools, Options, Email. Popup and push need no setup.
IMPORTANT LIMITATIONS
The bull score is an internal normalised score, not a calibrated probability of profit. The model
can be late, it can produce false changes in sideways markets, and it cannot remove gap risk.
Online learning does not imply future performance.
This indicator provides market context. It is not financial advice and it does not guarantee any
result.
SUPPORT
For questions please use the comments section of this product page or contact the author through
the MQL5 messaging system.