Low Buy High Sell Radar MT5

Product Overview
Low Buy High Sell Radar is an all‑in‑one main‑chart trend‑following and swing‑trading indicator designed for both the MT4 and MT5 platforms. By building a dynamic trend‑line color‑switching system and combining multi‑period oscillator algorithms (TSI and RSI), a volume‑price momentum model, and a signal‑cooldown filter, it delivers a full range of trading signals covering trend confirmation, overbought/oversold detection, and precise entry and exit. With rigorous logic, clean visuals, and a complete cooldown plus multi‑channel alert mechanism, it is an ideal choice for building a main‑chart trading system.
Core Features
Dynamic Trend Line and Moving Average System The system draws two core trend‑identification elements on the main chart: the MA60 magenta line, a 60‑period simple moving average that serves as the medium‑to‑long‑term trend reference, and the dynamic trend line, which is based on a white central axis and automatically turns into a thick red line when short‑term momentum keeps rising, or into a thick green line when short‑term and medium‑term momentum weaken together, visually reflecting the shift of bullish and bearish dominance. Traders only need to watch the trend‑line color to quickly judge the prevailing market direction. The system displays a white real‑time closing‑price label to the right of the latest candle. The MT5 version additionally supports candle color‑coding, coloring rising candles blue, falling candles red, flat candles gray, and bullish‑turn candles yellow, so that trend state and reversal patterns are shown intuitively through candle color.
Buy Signals
  • Low Buy (Dip Buy): Triggered when the short‑term oscillator crosses above its signal line while its value is below 30 (the oversold zone), displaying a light‑red upward arrow with the text "Low Buy" below the candle low. This means price has moved deep into the oversold zone, bearish momentum is starting to exhaust, and the first signs of reversal are appearing, making it an agile left‑side low‑level trial position or oversold‑bounce capture signal.
  • Buy (Buy): A multi‑condition confluence signal based on the TSI (True Strength Index), triggered when the TSI value is at the lowest point of the last 7 candles and the TSI crosses above its moving average from the negative zone, displaying a yellow upward arrow with the text "Buy" below the candle. This means that after a deep decline the momentum indicator has confirmed the early signal of a trend reversal, making it a higher‑win‑rate right‑side trend‑reversal long‑entry signal.
Sell & Exit Signals
  • High Sell (Rally Sell): Triggered when the short‑term oscillator crosses below its signal line while its value is above 85 (the overbought zone), displaying a green downward arrow with the text "High Sell" above the candle high. This means price has moved deep into the overbought zone and bullish momentum is severely overextended, making it a clear short‑term high take‑profit or reverse‑short signal.
  • Sell (Sell): A multi‑condition confluence signal based on the TSI indicator, triggered when the TSI value is at the highest point of the last 7 candles and the TSI crosses below its moving average from the high zone, displaying a green downward arrow with the text "Sell" above the candle. This means that after a rapid rally the momentum indicator has confirmed the early signal of a trend reversal, making it a clear right‑side trend‑reversal short or full‑exit signal.
  • Top (Top): Triggered when the RSI indicator falls back below 84 from the overbought zone (above 84), displaying a yellow downward arrow with the text "Top" above the candle. This means a short‑term top structure has formed and bullish strength is materially fading, making it an early‑warning exit signal for trimming longs, taking profit, or placing a protective stop.
Practical Application
In day‑to‑day swing trading, the dynamic trend‑line color is the primary decision basis. During thick‑red‑line phases, focus only on buy signals (Low Buy and Buy); during thick‑green‑line phases, focus only on sell and exit signals (High Sell, Sell, and Top). This fundamentally avoids counter‑trend operations and keeps every trade aligned with the prevailing market direction.
The Low Buy signal suits left‑side traders capturing bounces in the oversold zone and is best used when price approaches a prior low or a support level, where the risk‑reward ratio is often most favorable; the Buy signal is a right‑side confirmation signal with a higher win rate, suitable for trend traders building positions at the start of a reversal, and can serve as the basis for adding to or opening the main position. The High Sell and Sell signals correspond to overbought‑zone exits and trend‑reversal shorts respectively; the former is more aggressive and suited to short‑term profit‑taking, while the latter is more robust and suited to trend shorts or full liquidation. As an early‑warning signal, Top is best verified a second time with candle patterns (such as long upper shadows or engulfing patterns) before trimming or taking profit.
Parameter Settings
Core algorithm parameters: The system has a built‑in unified signal‑cooldown mechanism; Signal cooldown defaults to 10 candles and is shared by all five signal types, effectively preventing repeated signals in extreme conditions and preserving signal scarcity and value. Max Lookback Bars defaults to 2000, controlling the maximum number of historical candles marked with signals, balancing chart cleanliness with backtesting needs.
Alert settings: Alert On Bar Close is enabled by default and is strongly recommended to stay enabled, so alerts fire only after a candle closes and confirms the signal, avoiding false‑cross signals caused by violent intrabar price swings. Popup and Sound are enabled by default, while Push and Email are disabled by default; traders can adjust them flexibly according to their screen‑watching habits.
Per‑signal alert switches: The system lets you independently enable or disable alerts for each of the five core signals, Low Buy, High Sell, Buy, Sell, and Top, so you receive only the signals relevant to your current strategy and filter out unnecessary noise.
Usage Recommendations
This indicator applies to mainstream instruments such as forex, precious metals, indices, and cryptocurrencies, and is fully compatible with the MT4 and MT5 terminals. It is recommended for use on the H1 timeframe and above; multi‑factor confluence signals on larger timeframes are more stable and practically valuable than on smaller ones, effectively reducing noise.
It is recommended to combine this indicator with main‑chart support/resistance lines or a volume indicator. A Low Buy signal near a prior low accompanied by rising volume greatly increases reliability; a Sell signal near a prior high accompanied by shrinking volume is a high‑confidence top‑escape signal. No indicator can guarantee a 100% win rate, so please always set strict stop losses and control position risk, using this indicator as a decision aid rather than the sole basis.
Summary
Low Buy High Sell Radar perfectly fuses three mechanisms: dynamic trend identification, multi‑factor signal confluence, and strict cooldown filtering. It is not only a visually clear main‑chart trend tool but also a practical swing‑trading system with layered signal design, independent alert control, and all‑round filtering, suitable for traders at every level to build robust dip‑buy/rally‑sell and trend‑following rules and capture high‑win‑rate opportunities while controlling risk.

추천 제품
Basic information. To perform its work, the indicator takes data on volumes from a lower timeframe, builds Market Profiles for a higher timeframe and a histogram for the current timeframe. The indicator starts in several stages. In this case, messages like: "Build Source & Target TF. Step: …" are output to the log. The process can be accelerated by changing the input parameter Milliseconds between steps - the initialization speed. The final value of this parameter is always individual and is set
This indicator is based on a classic Moving Average indicator. Moving averages help us to first define the trend and second, to recognize changes in the trend. Multi TimeFrame indicator MTF-MA shows MA data from the 4 timeframes by your choice. By default this indicator has external parameters: TF1 = 1; TimeFrame2b = true; TF2 = 5; TimeFrame3b = true; TF3 = 15; TimeFrame4b = true; TF4 = 60; InpPSARStep = 0.02; InpPSARMaximum = 0.2; You can change TF1-TF4 in the next limits: TF1 from M1 (1) to H4
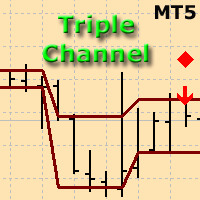
The indicator plots three consecutive channels by Close prices and checks if they match the scheme shown in the screenshots. The length of each channel is not fixed and is selected by the program within the range ChMin and ChMax . When the match is found, a signal is formed (an appropriately colored arrow). A possible stop loss level is displayed as a diamond. A signal may be accompanied by a pop-up window, a push notification and/or an email. The indicator works by Open prices. Parameters ChMi
The   Pure Price Action ICT Tools   indicator is designed for pure price action analysis, automatically identifying real-time market structures, liquidity levels, order & breaker blocks, and liquidity voids. Its unique feature lies in its exclusive reliance on price patterns, without being constrained by any user-defined inputs, ensuring a robust and objective analysis of market dynamics.   MARKET STRUCTURES A Market Structure Shift, also known as a Change of Character (CHoCH), is a pivota
Keltner Channel indicator for MT5
Renaud Herve Francois Candel
Keltner Channel Indicator Keltner Channel is an oscillator like Bollinger Bands. Keltner Channel is a very good tool to time entries for your strategy. Keltner Channel displays a channel where price is supposed to stay unless we are in overbought or oversold situations. Various strategies use Keltner Channel indicator successfully to spot overbought / oversold situations and look for reversals. Keltner Channel indicator uses ATR to determine overbought and oversold situations. Inputs of the indi
MT5 Drawdown Tracker – Track Your EA’s Performance with Precision! Take your trading analysis to the next level with our MT5 indicator designed to monitor, record, and report the drawdown of any Expert Advisor. Whether you’re fine-tuning your strategies or optimizing risk management, this tool gives you the insights you need. Key Features: Effortless Tracking: Automatically monitors the drawdown levels of your EAs with precision. Comprehensive Data Storage: Accurately logs each drawdown event,
WinWiFi Ultra Signal
Nirundorn Promphao
"We have developed a highly accurate trading signal system applicable to all assets on the 15-minute (M15) timeframe. Calibrated against actual Gold price behavior, this system allows users to trade every candlestick effectively, regardless of market conditions—whether the market is trending, moving sideways, or reversing. The system features real-time arrows and color-coded indicators that signal immediate Buy or Sell entry points. This allows traders to use it as a reliable confirmation tool t
FREE
WaveSniper
Alessandro Farinella
Wave Sniper One indicator. Adaptive baseline, multi-layer signal engine, and closed-bar confirmed entries — designed for traders who want precision without complexity. I tried to build the perfect indicator. I ended up deleting most of them. I used, studied and coded hundreds of indicators. I analyzed and converted entire libraries from PineScript, ProRealCode, EasyLanguage, MQL. Oscillators, moving averages, bands, candlestick pattern: you name it! I spent weeks, even months optimizing param
RSI Scanner is a multi symbol multi timeframe RSI dashboard that monitors Relative Strength Index indicator for price entering and exiting overbought and oversold in up to 28 symbols and 9 timeframes. Download Demo here  (Scans only M2, and M10) Settings description   here MT4 version   here RSI Scanner features: Signals RSI entering and exiting the overbought and oversold zones. Monitors 28 customizable instruments and 9 timeframes at the same time. Supports all 21 timeframes of Metatrader 5
LBR Oscillator
Pablo Filipe Soares De Almeida
LBR Oscillator – 3/10 Oscillator LBR Oscillator는 전문 트레이더 Linda Raschke가 널리 사용하고 대중화한 클래식 3/10 Oscillator를 개선한 버전입니다. 이 지표는 Linda Raschke가 사용하는 원래의 표준 설정을 기반으로 개발되었으며, 3기간과 10기간 이동평균, 그리고 16기간 시그널 라인을 사용하여 모멘텀과 시장 리듬 변화를 분석하는 데 초점을 둡니다. 개념적 기반 – Linda Raschke의 3/10 Oscillator 활용 방식 Linda Raschke는 3/10 Oscillator를 단순한 자동 신호 생성기가 아닌, 모멘텀 확인 도구로 사용합니다. 주요 활용 방법은 다음과 같습니다: 모멘텀의 가속 및 감속 식별 추세 내 되돌림 확인 단기 시장 방향 변화 예측 가격 행동, 이동평균, 추세 맥락과 함께 사용 중점은 기계적인 교차가 아니라 히스토그램의 움직임, 기울기, 방향 변화에 있습니다. 히스토그램은 빠른 평균(
Divergence Matrix Pro for MetaTrader 5 Divergence Matrix Pro is a confirmed multi-oscillator divergence indicator for MetaTrader 5. It detects regular and hidden divergence between price and selected oscillators, then presents the confirmed structure through divergence lines, pivot labels, action markers, an optional current-timeframe Matrix Panel and optional alerts. The indicator is an analysis and confirmation tool. It does not open or close trades, and the signal score is not a win rate or a
BeST_Keltner Channels Strategies MT5   is an  MT5  Indicator based on the original Keltner Channels Indicator and it can display in the Chart all the known Variations of Keltner Channels and also the corresponding 10 totally Strategies. Every such generally consists of a Central Moving Average Line and two Boundary Bands at a distance above and below it and can be traded mainly in a Trending Mode but also in a Ranging ReEntry Mode.  BeST_Keltner Channels Strategies Indicator Draws definite Buy
The indicator detects divergence signals - the divergences between the price peaks and the MACD oscillator values. The signals are displayed as arrows in the additional window and are maintained by the messages in a pop-up window, e-mails and push-notifications. The conditions which formed the signal are displayed by lines on the chart and in the indicator window. The indicator parameters MacdFast - fast MACD line period MacdSlow - slow MACD line period MacdSignal - MACD signal line period Macd
Dual Period Filter — Adaptive Dual-Period Coppock Momentum Indicator In one sentence : A trend-strength visualization indicator based on dual-period ROC summation, adaptive source filtering, and a 4-state momentum histogram, running in a separate MT5 window. How It Works The classic Coppock curve sums a long and a short Rate of Change (ROC) and then smooths the result with a WMA. This indicator enhances the classic formula in two ways: Adaptive source filtering : Before the price is fed into the
FREE
ATR Line
Evgeny Levchenko
The indicator - "ATR Line" determines the current trend and gives signals to buy (green arrow to the top) or sell (red arrow to the bottom). The indicator calculation is based on the deviation of the average price of the instrument from its average true range - ATR. The moving average of prices is used to reduce "market noise". If the main line of the indicator - "ATR Line" is lower the instrument price chart, then the market is in a "bullish" trend. If the main line of the indicator is higher t
Visual Falcon Wave Indicator
AL MOOSAWI ABDULLAH JAFFER BAQER
Visual Falcon Wave Indicator: Trade with Clarity and Confidence Are you tired of navigating the chaotic market with lagging indicators and confusing signals? Do you struggle to identify the true trend direction amidst unpredictable price swings? The Visual Falcon Wave Indicator was engineered from the ground up to solve this exact problem, providing a crystal clear, intuitive, and powerful tool for trend traders. For a one-time price of just $30, you can equip yourself with an indicator designe
PAX3 Price Action Indicator
Marco Aurelio Santos Costa
5 (5)
You probably won't see the power of the indicator in the backtest, because it uses 3 windows, something you can't do, in the DEMO version that the site offers.  I trust 100% on my work and on my indicator, if you want a test version, send me a message, different from other sellers, who just want to "sell", I want whether you have a full version before renting and deciding. Christmas Discount 30% off until the 25th As you can imagine, it was a failure, I'm not saying that any indicator doesn't w
OHLC Levels
Makarii Gubaydullin
차트에서 시가, 고가, 저가, 종가 수준의 시각화 현재 것뿐만 아니라 모든 시간 프레임을 선택할 수 있습니다. 계산된 바의 오프셋은 조정 가능합니다 : 현재 (변동) 바, 또는 설정된 수의 이전 바. 다기능 유틸리티 : 66개 이상의 기능 포함  |   문의 사항이 있으면 연락주세요   |    MT4 버전 지표 설정에서 다음을 구성할 수 있습니다: 계산된 바의 오프셋 : 0 = 현재 바, 1 = 이전 바, 2 = 2 바 전... " 여러 바 포함 " 옵션: 만약 > 0: 여러 바가 결합되어 최고가 와 최저가 를 결정합니다. 계산된 시간 프레임 . 각 수준(OHLC)은 개별적으로 활성화/비활성화  될 수 있습니다. 선 시각화 : 색상, 스타일, 크기, 배경 옵션. 추가 정보: 비활성화 가능; 선 가격만; 선 정보만; 둘 다: 정보 + 가격; 글꼴 크기 및 스타일 ('추가 정보'가 활성화된 경우). 프로그램 파일은 " Indicators " 디렉토리에 위치해야 합니다.
# Volatility Adaptive MA - Variable speed moving average *Category: Trend | Difficulty: intermediate | Window: chart window (overlaid on price) | Markets: Universal (Forex, indices, commodities, crypto, stocks) | Suggested timeframes: M5, M15, M30, H1, H4* ## Short description > A moving average whose smoothing factor is driven by the ratio between short and long term volatility: it accelerates during breakouts and slows down in compressed phases, cutting false crossovers. ### Overview Eve
Every indicator has its advantages and disadvantages. Trending ones show good signals during a trend, but lag during a flat. Flat ones thrive in the flat, but die off as soon as a trend comes. All this would not be a problem, if it was easy to predict when a flat changes to a trend and when a trend changes to a flat, but in practice it is an extremely serious task. What if you develop such an algorithm, which could eliminate an indicator's flaws and enhance its strengths? What if such an algorit
Noise filtering: the key to mastering trends This indicator tracks the market trend with an unmatched reliability, by ignoring sudden fluctuations and market noise. It has been designed to trend-trade intraday charts and small timeframes. Its winning ratio is around 85%. [ Installation Guide | Update Guide | Troubleshooting | FAQ | All Products ] Amazingly easy to trade Find oversold/overbought situations Enjoy noise-free trading at all times Avoid being whipsawed in intraday charts The indi
Pixel Minimalist Screener – 더 스마트하게 트레이딩하세요 명확함은 곧 힘입니다. 빠르게 움직이는 시장 속에서 깔끔하고 집중된 작업 환경은 승부를 가를 수 있습니다. Pixel Minimalist Screener 는 정확성, 단순함, 그리고 실질적인 정보를 한눈에 제공하는 트레이더를 위한 도구입니다. 핵심 기능 멀티 타임프레임 지원 최대 3개의 맞춤 타임프레임 을 한 화면에서 모니터링하세요. 스캘핑부터 스윙, 장기 트레이딩까지 — 시장의 전반적인 흐름을 빠르게 파악할 수 있습니다. 7가지 핵심 기술 지표 포함 불필요한 시각적 요소 없이도 충분한 정보 제공: RSI (상대 강도 지수) MACD ADX 스토캐스틱 오실레이터 패러볼릭 SAR 이동 평균선 모멘텀 모든 지표는 깔끔하게 시각화되어 빠른 판단을 도와줍니다. 실시간 대시보드 선택한 타임프레임에서 지표 상태를 실시간으로 확인할 수 있습니다. 상승(Bullish), 하락(Bearish), 중립(
Polar Volumetric is not just an indicator; it is a complete trading ecosystem designed for serious traders, Prop Firm candidates, and Scalpers. It fuses three powerful concepts into one clean chart: Adaptive Trend , Momentum Oscillator , and Real-Time Volume Data . KEY INNOVATION: Unified Calculation Engine Unlike standard volume indicators that show different data on different charts, Polar Volumetric uses a proprietary Unified Engine . This ensures that the Volume Delta you see on the Sc
Price Range MT5
Vladimir Toropov
Price Range MT5 는 가격 범위와 가격을 식별하고, 특정 가격대의 종료 시점과 추세의 시작 시점을 인식하는 시스템입니다. 높은 확률로 새로운 추세의 방향을 알려주고, 푸시 알림을 통해 적시에 결정을 내릴 수 있도록 도와줍니다. Price Range 표시기의 기능 이 지표는 실시간으로 파악되는 모든 가격 범위, 레벨, 추세에 대한 푸시 알림을 제공합니다. 모든 종목과 모든 시간대에서 작동합니다. 이 지표는 모든 가격 범위를 직접 표시합니다. 별도의 그리기 도구를 사용할 필요가 없습니다. 표시된 모든 범위를 삭제하려면 차트에서 지표를 제거하세요. 이 지표는 범위가 실제로 끝나는 시점을 파악하고 차트에 추세 시작 신호를 표시합니다. 안정적인 범위 내에서 이 지표는 지지선과 저항선을 찾습니다. 이러한 가격 수준에서 가격은 매우 높은 확률로 반등할 것입니다. 이 지표는 지지선과 저항선에 대해 가장 최적의 손절매선을 표시합니다. 데이터 과학은 이 가격을 계산하며, 이는 다음 지지선
Simple Delta
Vincent Jose Proenca
Simple Delta – 클라이언트 설명 Simple Delta는 MetaTrader 5용 깨끗하고 효율적인 거래량 델타 지표로, 각 캔들 위에 정규화된 매수 및 매도 압력을 표시합니다. 제공 내용 이 지표는 실시간 틱 데이터를 분석하여 델타(매수량 − 매도량)를 계산하고, 각 캔들 위에 단일 정규화 값(-10에서 +10)을 표시합니다. 양수 값 은 매수 우위를 나타내며(선택한 매수 색상으로 표시), 음수 값 은 매도 압력을 나타냅니다(선택한 매도 색상으로 표시). 주요 특징 즉각적인 시각적 명확성: 캔들당 하나의 숫자 — 복잡함 없이 바로 활용 가능한 데이터 제공 6가지 전문 색상 테마 + 완전히 사용자 정의 가능 현재 캔들 2초마다 실시간 업데이트 차트 레이아웃에 맞게 텍스트 위치 조정 가능 M5 및 M15 시간 프레임에 최적화 복잡한 지표로 차트를 혼잡하게 만들지 않고, 깔끔하고 집중할 수 있는 주문 흐름 분석을 원하는 트레이더에게 완벽합니다.
InfinX Slope MT5
Stanislav Shtiliyanov
The Slope indicator   measures the slope of a linear regression , which is the line of best fit for a data series. A 20-period Slope, therefore, measures the slope of a 20-day linear regression. ... In general, a positive slope indicates an uptrend, while a negative slope indicates a downtrend. How do you use slope Indicator? By applying the slope indicator  to both the price chart and the price relative , chartists can quantify the price trend and relative performance with one indicator. A pos
Smart M Concept MT5
Andrei Novichkov
Our new indicator is an important part of the Smart Money Concepts (SMC) system It uses a modern market vision and fast calculation methods. As a result, the trader has a complete picture of the trade at every moment in time, which makes the process of obtaining results easier and faster. Our new indicator displays the following important patterns:   Order Blocks. Imbalance – Fair Value Gap (FVG). Break Of Structures (BoS). Change of character (CHoCH). Equal highs & lows. Premium , Equilibrium
TechBot Indicator is an intelligent, high-precision trading system built on complex mathematical logic — not a mix of standard indicators. Using proprietary analytics and dynamic data modelling, TechBot interprets market strength, timing, and momentum with exceptional accuracy. It continuously filters market noise to reveal only high-confidence setups, giving traders a clear, predictive view of upcoming movements. Originally optimized for synthetic markets, TechBot’s self-scaling mathematical m
This indicator shows data from 9 currency pairs by your choice for all 9 Time Frames. If a digital value of the RSI is less or equal to DnLevel = 30 (or whatever number you decided to put) then a Green square will appear. This is potentially an oversold condition and maybe a good time to go Long. If a digital value of the RSI is greater or equal to UpLevel = 70 (or whatever number you decided to put) then a Red square will appear. This is potentially an overbought condition and maybe a good time
MA Slope
Serge Villasica
MA Slope is a simple indicator that measures the slope of a specific Moving Average.  We usually say that the price is in an uptrend when it is above the moving average, or it is in a downtrend when it is below the moving average. However, this information is inadequate since most of the time the market is in range. During range-bound markets, price moves back and forth around the Moving Average giving a lot of false signals.  MA Slope helps identify and validate trends as it directly measures t
이 제품의 구매자들이 또한 구매함
이 제품은 2026년 시장에 맞게 업데이트되었으며 최신 MT5 빌드에 최적화되었습니다. 가격 업데이트 안내: Smart Trend Trading System은 현재 $99 에 제공됩니다. 다음 30회 구매 후 가격은 $199 로 인상됩니다. 특별 혜택: Smart Trend Trading System 구매 후 저에게 개인 메시지를 보내시면 Smart Universal EA를 무료 로 받을 수 있으며, Smart Trend 신호를 자동 거래로 전환할 수 있습니다. Smart Trend Trading System은 리페인트 없음, 재그리기 없음, 지연 없음의 완전한 트레이딩 시스템으로, 더 깨끗한 신호, 더 나은 추세 방향, 그리고 더 체계적인 시장 거래 방식을 원하는 트레이더를 위해 제작되었습니다. Learn Smart Trend Trading System Everything you need to learn, install, and use the product is available
Trend Sniper X
Sarvarbek Abduvoxobov
4.88 (32)
Trend Sniper X 는 트레이더가 추세 방향과 잠재적 반전 지점을 명확하고 정확하게 포착할 수 있도록 도와주는 MetaTrader 5용 멀티 타임프레임 추세 추종 지표입니다. MT4용: https://www.mql5.com/en/market/product/193245 가격 정보: 현재 가격은 프로모션 할인가이며, 향후 업데이트 및 새로운 기능이 출시됨에 따라 변동될 수 있습니다. 보너스 혜택: 본 지표 전용 무료 자동매매 Assistant EA를 받으시려면 구매 후 작성자에게 메시지를 보내주시기 바랍니다. Code2Profit 채널 멀티 타임프레임 분석으로 시장을 마스터하세요! Trend Sniper X로 승률을 극대화하는 방법: 핵심 규칙 및 세션 팁 기술 사양 플랫폼 MetaTrader 5 지표 유형 멀티 타임프레임 추세 지표 운용 타임프레임 모든 차트 타임프레임 지원, 독립적으로 선택 가능한 상위 타임프레임(M1–MN1) 주요 상품 외환, 금(XAUUSD) 및 기타 C
SMC Intraday Formula
Kareem Abbas
5 (23)
먼저 솔직하게 말하겠습니다. 어떤 인디케이터도 단독으로 당신을 수익성 있게 만들어주지 않습니다. 누군가 그렇게 말한다면, 그는 당신에게 꿈을 파는 것입니다. 완벽한 매수/매도 화살표를 보여주는 모든 인디케이터는 완벽하게 보이도록 만들 수 있습니다 — 단지 올바른 과거 구간을 확대하고 승리한 거래만 캡처하면 됩니다. 우리는 그렇게 하지 않습니다.  SMC Intraday Formula는 도구입니다. 시장 구조를 읽고, 가장 높은 확률의 가격 구간을 표시하며, 현재 스마트 머니의 흐름이 어떻게 보이는지 아주 단순한 언어로 보여줍니다. 최종 결정은 여전히 당신이 합니다. 실행도 당신이 합니다. 하지만 이제는 희망이 아니라 정확성으로 거래하게 됩니다. 우리는 이 인디케이터를 지난 약 3년 동안 골드(XAUUSD) 및 주요 외환 통화쌍의 데이 트레이딩 스캘핑에 사용해 왔습니다. M1, M5, M15, M30에서 우리의 핵심 도구입니다. 이 도구는 미래를 예측하려 하지 않습니다 — 지금 형성
Neuro Poseidon MT5
Daria Rezueva
4.79 (53)
Neuro Poseidon is a new indicator by Daria Rezueva. It combines precise trading signals with adaptive TP/SL levels - creating best possible trades as a result! Message me and get  Neuro Poseidon Assistant  as a gift to automize your trading process! What makes it stand out? 1. Proven profitability on all assets and timeframes 2. Only confirmed BUY and SELL signals present on the chart 3. Adaptive TP & SL levels generated by the software for each trade 4. Easy to understand - suitable for al
Welcome to ENTRY IN THE ZONE AND SMC MULTI TIMEFRAME Entry In The Zone and SMC Multi Timeframe is a real-time market analysis tool based on Smart Money Concepts (SMC), designed to analyze market structure, price direction, and key trading zones. It supports both Single-Timeframe Analysis and Multi-Timeframe Analysis, providing a clearer view of the overall market structure across multiple timeframes, with real-time BUY / SELL signals that do not repaint. It is designed to help filter trading opp
SuperScalp Pro
Van Minh Nguyen
4.63 (32)
SuperScalp Pro - Professional Multi-Layer Confluence Scalping System SuperScalp Pro는 클래식 Supertrend에 여러 지능형 확인 필터를 추가한 고급 스캘핑 지표입니다. 더 높은 확률의 Buy/Sell 거래 기회를 식별하는 데 도움을 주며, 잘못된 신호를 크게 줄이는 데 도움을 줍니다. 명확한 Buy 및 Sell 화살표가 차트에 직접 표시되며, ATR 기반 Stop Loss 및 Take Profit 수준이 실시간으로 자동 계산됩니다. 구매 후 설정 방법 및 권장 구성에 대한 안내가 필요하시면 저에게 문의해 주세요. SuperScalp Pro Auto Trader를 사용하여 신호를 쉽게 자동화할 수 있습니다: [Auto Trader] 권장 설정 파일 다운로드: [Set File] 전체 문서는 제품 블로그에서 확인할 수 있습니다: [User Guide] 업데이트를 확인하려면 공식 채널에 참여하세요: [Official C
Unix Scalper
Issam Kassas
UNIX Scalper — Gold Scalping Indicator for MetaTrader 5 UNIX Scalper is a focused Gold scalping indicator designed primarily for XAUUSD on M1, M2, M3, M5, M10 and M15. It gives the trader a clear BUY, SELL or WAIT decision together with the complete trade plan: Entry, Stop Loss, TP1 and TP2 . The concept is simple: wait for the signal, follow the levels, move the Stop Loss to Break Even after TP1, and trade with discipline. Learn UNIX Scalper Everything you need to learn and use the product is
Reversion King Indicator
Eugen-alexandru Zibileanu
5 (7)
새로운 왕의 등장 - 인디케이터 + 주문 관리 표시(TP1 + TP2 + TP3) + 선택형 텔레그램 시그널 전송 기능 포함 (무료) (완전한 트레이딩 및 시그널 시스템) 골드를 위한 최고의 EA: Gold Slayer 이 인디케이터는 고급 전략, 사용자 지정 가능한 주문 관리 시스템, 그리고 엔벨로프 확장을 결합한 평균 회귀(mean reversion) 시스템을 포함하고 있습니다. 또한 RSI와 같은 여러 지능형 확인 필터를 통해 높은 확률의 반전 진입 구간을 포착하여 BUY 및 SELL 시그널을 제공합니다. 단순히 거래 방법만 배우는 것이 아니라, 여러 포지션을 효과적으로 관리하고 이전에 수익 중인 오픈 포지션으로 손실 거래를 커버하는 방법까지 익힐 수 있습니다. M5 전용으로 설계 및 최적화되었으며, 유동성이 풍부해 시그널이 더 깔끔하고 신뢰도 높은 BTCUSD와 XAUUSD에서 뛰어난 성능을 발휘합니다. 이 인디케이터는 ATR 기반으로 자동 계산된 진입가, 손절가, 익절가와
Gann Made Easy MT5
Oleg Rodin
5 (10)
Gann Made Easy 는 mr.의 이론을 사용하여 최고의 거래 원칙을 기반으로 하는 전문적이고 사용하기 쉬운 Forex 거래 시스템입니다. W.D. 간. 이 표시기는 Stop Loss 및 Take Profit Levels를 포함하여 정확한 BUY 및 SELL 신호를 제공합니다. PUSH 알림을 사용하여 이동 중에도 거래할 수 있습니다. 구매 후 거래 방법 안내 및 유용한 추가 지표를 무료로 받으시려면 저에게 연락주세요! 아마도 Gann 거래 방법에 대해 이미 여러 번 들었을 것입니다. 일반적으로 Gann의 이론은 초보자 거래자뿐만 아니라 이미 거래 경험이 있는 사람들에게도 매우 복잡한 것입니다. Gann의 거래 방식은 이론적으로 적용하기 쉽지 않기 때문입니다. 나는 그 지식을 연마하고 Forex 지표에 최고의 원칙을 적용하기 위해 몇 년을 보냈습니다. 표시기는 적용하기가 매우 쉽습니다. 차트에 첨부하고 간단한 거래 권장 사항을 따르기만 하면 됩니다. 지표는 지속적으로 시장 분석
M1 Sniper MT5
Oleg Rodin
5 (7)
M1 SNIPER 는 사용하기 쉬운 거래 지표 시스템입니다. M1 시간대에 맞춰 설계된 화살표 지표입니다. 이 지표는 M1 시간대 스캘핑을 위한 단독 시스템으로 사용할 수 있으며, 기존 거래 시스템의 일부로도 사용할 수 있습니다. 이 거래 시스템은 M1 시간대 거래용으로 특별히 설계되었지만, 다른 시간대에도 사용할 수 있습니다. 원래는 XAUUSD와 BTCUSD 거래를 위해 이 방법을 설계했지만, 다른 시장 거래에도 유용하다는 것을 알게 되었습니다. 이 지표의 신호는 추세 방향과 반대로 거래될 수 있습니다. 저는 지표의 신호를 활용하여 양방향으로 거래할 수 있도록 돕는 특별한 거래 기법을 알려드립니다. 이 방법은 특별한 동적 지지선과 저항선 가격 영역을 활용하는 것을 기반으로 합니다. 구매하시면 M1 SNIPER 화살표 지표를 바로 다운로드하실 수 있습니다. 또한, 아래 스크린샷에 표시된 Apollo Dynamic SR 지표는 M1 SNIPER 도구를 사용하는 모든 사용자에게 무료로
UZFX {SSS} 스캘핑 스마트 시그널 v5.0 MT5는 급변하는 시장에서 정확한 실시간 시그널을 필요로 하는 스캘퍼, 데이 트레이더, 스윙 트레이더를 위해 설계된 리페인팅이 없는 고성능 트레이딩 지표입니다. (UZFX-LABS)에서 개발한 이 지표는 가격 움직임 분석, 추세 확인 및 스마트 필터링을 결합하여 모든 통화 쌍과 시간대에서 높은 확률의 매수 및 매도 신호, 경고 신호, 추세 지속 기회를 생성합니다. 거래에 대한 망설임을 멈추고, 명확성, 정밀성, 그리고 규율 있는 시장 실행을 원하는 트레이더를 위해 설계된 체계적인 신호 시스템을 따르기 시작하세요. 제 말을 믿으세요. 이 지표는 MQL5에서 구할 수 있는 최고의 지표 중 하나입니다. 그러니 절대 놓치지 마세요!! “현명한 트레이더를 위한 스마트 신호” 지금 최신 버전 5.0이 출시되었으며, 사전 공지 없이 가격이 최대 $499.99까지 인상될 수 있으니 기회를 놓치기 전에 서둘러 구매하세요!! 최종 구매 전! 무료 체
Entry Points Pro for MT5
Yury Orlov
4.51 (150)
전설이 돌아왔습니다: Entry Points Pro 10. MQL5 마켓 Top-3 자리를 3년간 지켜온 전설적인 지표의 재출시입니다. 수백 개의 호평 리뷰(두 버전 합산 589개), 매일 이 지표로 거래하는 수천 명의 트레이더, 31,000회 이상의 데모 다운로드   MT4+MT5 . 지난 5년간 여러분이 남긴 리뷰를 하나도 빠짐없이 읽었고, 약속 대신 그 답을 버전 10에 담았습니다. 1999년부터 시장에서 활동하며 정직함과 자신의 평판, 그리고 고객을 소중히 여기는 개발자가 만들었습니다. Entry Points Pro의 진입 시그널은 절대 리페인팅되지 않습니다. 그리고 이번에는 개발자의 말뿐이 아니라 검증 가능한 사실입니다: 확정 시그널은 캔들 종가에서만 표시되며, 자동화 테스트에서 리페인팅 0건 이 확인되었습니다(EURUSD, XAUUSD, BTCUSD에서 2,486,568회의 불변조건 검사 — 위반 0건). 검증 방법은 공개되어 있으니 전략 테스터에서 직접 재현해 보실 수
통화 강도 마법사는 성공적인 거래를 위한 올인원 솔루션을 제공하는 매우 강력한 지표입니다. 표시기는 여러 시간 프레임의 모든 통화 데이터를 사용하여 이 또는 해당 외환 쌍의 힘을 계산합니다. 이 데이터는 특정 통화의 힘을 확인하는 데 사용할 수 있는 사용하기 쉬운 통화 지수 및 통화 전력선의 형태로 표시됩니다. 필요한 것은 거래하려는 차트에 표시기를 부착하는 것뿐입니다. 표시기는 거래하는 통화의 실제 강세를 보여줍니다. 지표는 또한 추세와 거래할 때 유리하게 사용할 수 있는 구매 및 판매 거래량 압력의 극한값을 보여줍니다. 지표는 또한 피보나치에 기반한 가능한 대상을 보여줍니다. 표시기는 PUSH 알림을 포함한 모든 유형의 알림을 제공합니다. 구매 후 연락주세요. 나는 당신과 거래 팁을 공유하고 당신에게 무료로 훌륭한 보너스 지표를 줄 것입니다! 나는 당신에게 행복하고 유익한 거래를 기원합니다!
Atomic Analyst MT5
Issam Kassas
4.45 (55)
이 제품은 2026년 시장에 맞게 업데이트되었으며 최신 MT5 빌드에 최적화되었습니다. 가격 업데이트 안내: Atomic Analyst는 현재 $99 에 제공됩니다. 다음 30회 구매 후 가격은 $199 로 인상됩니다. 특별 혜택: Atomic Analyst 구매 후 저에게 개인 메시지를 보내시면 Smart Universal EA를 무료 로 받을 수 있으며, Atomic Analyst 신호를 자동 거래로 전환할 수 있습니다. Atomic Analyst는 리페인트 없음, 재그리기 없음, 지연 없음의 Price Action 거래 인디케이터로, 수동 거래, 신호 명확성, EA 자동화를 위해 설계되었습니다. User manual: settings, inputs and strategy.   &   User Manual PDF . 가격 움직임, 강도, 모멘텀, 다중 시간대 방향 및 고급 필터를 분석하여 트레이더가 노이즈를 줄이고 약한 세팅을 피하며 더 체계적인 거래 결정을 내릴 수 있도록
ATstrong
Zaha Feiz
ATSTRONG PRO: 시장 구조 및 돌파(Breakout) 지표 돌파 감지 엔진 | 5개의 동적 TP 목표 | 실시간 대시보드 패널 | 리페인팅 없음 출시 기념 가격 현재 가격: $59 — 10개가 판매될 때마다 가격이 $10씩 인상됩니다. ATSTRONG PRO 는 MetaTrader 5 전용으로 설계된 고급 돌파 및 기관 수준의 시장 구조 지표입니다. 높은 확률의 스윙 피벗을 감지하고, 군집된 지지 및 저항 축적 영역을 식별하며, 실시간으로 구조 붕괴(BOS) 및 특성 변화(CHoCH) 신호를 제공합니다. 이 지표는 차트 위에 동적 손절매(Stop Loss)와 5개의 개별 이익 실현 수준(TP1 ~ TP5)을 자동으로 그려주며, 위험 대비 보상 투영 상자, 별점으로 매겨진 신호 품질 등급, 실시간 온차트 성과 분석 대시보드를 함께 제공합니다. 거래 주의 사항: 이 지표는 수동 거래 및 시장 분석용입니다. 캔들이 마감될 때 시각적으로 명확한 신호, 레벨, 알림을 리페인팅
이 제품은 2026년 시장에 맞게 업데이트되었으며 최신 MT5 빌드에 최적화되었습니다. 가격 업데이트 안내: Smart Price Action Concepts는 현재 $200 에 제공됩니다. 다음 30회 구매 후 가격은 $299 로 인상됩니다. 특별 혜택: 구매 후 저에게 개인 메시지를 보내시면 무료 보너스 + 선물 을 받을 수 있습니다. 먼저, 이 트레이딩 도구는 리페인트 없음, 재그리기 없음, 지연 없음의 인디케이터이므로 전문적인 트레이딩에 적합하다는 점을 강조하고 싶습니다. [Online course] ,   [User Manual]  ,  [How to Install]  ,   [PDF] Smart Price Action Concepts Indicator는 초보자와 경험 많은 트레이더 모두에게 매우 강력한 도구입니다. 20개 이상의 유용한 인디케이터를 하나로 결합하고, Inner Circle Trader Analysis와 Smart Money Concepts Trading
Axiom Matrix
Issam Kassas
5 (6)
[User Manual]   ,   [Online Course]   ,   [PDF]  And [DEMO] Axiom Matrix는 MetaTrader 5용 전문 멀티 심볼, 멀티 타임프레임 시장 스캐너이자 의사결정 대시보드입니다. Axiom Matrix는 사용자의 Market Watch를 스캔하고, 여러 타임프레임을 분석하며, 여러 근거 엔진을 읽고, 가장 강한 기회를 비교하여 하나의 깔끔한 매트릭스 대시보드 안에서 최적의 BUY, SELL, WAIT 또는 차단 상태를 보여줍니다. 저는 무거운 시장 스캔 작업을 대신 처리해 줄 수 있는 하나의 도구가 필요했기 때문에 Axiom Matrix를 만들었습니다. 저는 RSI만 따로 확인하고 싶지 않았습니다. 그다음 MACD만 따로 확인하고. 그다음 이동평균. 그다음 거래량. 그다음 변동성. 그다음 지지와 저항. 그리고 하나의 트레이딩 아이디어를 만들기 위해 심볼과 타임프레임을 수동으로 계속 전환하고 싶지 않았습니다. 저는 시장을 스캔하고,
Gem SIGNAL
Shengzu Zhong
5 (1)
GEM Signal Pro GEM Signal Pro는 MetaTrader 5용 추세추종형 지표로, 차트에서 더 명확한 신호, 더 구조적인 트레이드 설정, 그리고 더 실용적인 리스크 관리를 원하는 트레이더를 위해 설계되었습니다. 단순한 화살표만 표시하는 것이 아니라, GEM Signal Pro는 전체 트레이드 아이디어를 더 깔끔하고 읽기 쉬운 방식으로 보여줍니다. 조건이 확인되면 진입가, 손절가, 목표가를 차트에 표시하여 트레이더가 설정을 더 효율적으로 검토할 수 있도록 도와줍니다. 작동 방식 이 지표는 먼저 내부 로직에 따라 유효한 초기 신호를 식별합니다. 확인 조건이 충족되면, GEM Signal Pro는 차트에 전체 설정을 표시합니다. 이를 통해 트레이더는 거래 구조를 더 명확하게 보고, 수동 분석 작업을 줄일 수 있습니다. 차트에 표시되는 거래 레벨 확인된 신호에 대해, GEM Signal Pro는 다음을 표시할 수 있습니다. 진입가 손절가 목표가 1 목표가 2 목표가 3 손
FiboSniper Pro
Van Minh Nguyen
5 (2)
FiboSniper Pro – Multi-Filter Fibonacci System with Auto SL/TP and Control Panel FiboSniper Pro는 동적 Fibonacci Envelopes와 여러 확인 필터를 결합하여 선별된 Buy 및 Sell 신호를 생성하는 기술적 지표입니다. Fibonacci 레벨은 Moving Average와 ATR을 기반으로 계산된 후 ADX, EMA, RSI, ATR, Volume, Time 및 Candle 구조를 통해 필터링됩니다. 이 지표는 ATR 기반의 자동 Stop Loss 및 Take Profit 레벨을 차트에 직접 표시하며, 빠른 설정 조정을 위한 인터랙티브 Control Panel을 제공합니다. 구매 후 권장 설정 파일과 자세한 사용 방법을 받으려면 저에게 문의해 주세요. Auto Trader X를 사용하여 FiboSniper Pro 신호를 자동화할 수 있습니다: [Auto Trader X] User Guide 및 Se
Divergence Bomber
Ihor Otkydach
4.89 (94)
이 지표를 구매하신 분께는 다음과 같은 혜택이 무료로 제공됩니다: 각 거래를 자동으로 관리하고, 손절/익절 수준을 설정하며, 전략 규칙에 따라 거래를 종료하는 전용 도우미 툴 "Bomber Utility" 다양한 자산에 맞게 지표를 설정할 수 있는 셋업 파일(Set Files) "최소 위험", "균형 잡힌 위험", "관망 전략" 모드로 설정 가능한 Bomber Utility의 셋업 파일 이 전략을 빠르게 설치, 설정, 시작할 수 있도록 돕는 단계별 영상 매뉴얼 주의: 위의 모든 보너스를 받기 위해서는 MQL5 개인 메시지 시스템을 통해 판매자에게 연락해 주세요. 독창적인 커스텀 지표인 “Divergence Bomber(다이버전스 봄버)”를 소개합니다. 이 지표는 MACD 다이버전스(괴리) 전략을 기반으로 한 올인원(All-in-One) 거래 시스템입니다. 이 기술 지표의 주요 목적은 가격과 MACD 지표 간의 다이버전스를 감지하고, **향후 가격이 어느 방향으로 움직일지를 알려주
BlueDigitsFx 공식 에코시스템 접근 공식 BlueDigitsFx 에코시스템을 통해 인프라 업데이트, 워크플로우 리소스, 제품 출시 및 에코시스템 접근 권한을 받으세요. Telegram 에코시스템 웹사이트 BlueDigitsFx Precision Order Flow MT5 — MetaTrader 5 완전한 오더플로우 분석 스위트 밸류 에어리어, Point of Control, 경매 컨텍스트, 구조화된 의사결정 지원을 결합한 진지한 MT5 트레이더를 위한 전문적인 세션 기반 시장 구조 프레임워크. 가치가 위치한 곳을 파악하세요 VAH, POC, VAL을 자동으로 모니터링하세요 London 및 New York 세션 구조를 이해하세요 구조화된 시장 컨텍스트로 의사결정 피로를 줄이세요 MetaTrader 5 트레이더를 위해 특별히 설계되었습니다 개발자의 메시지 저는 MetaTrader 5 내에서 세션 구조를 더 명확하게 읽고 싶어서 Precision Order Flow를 개발했습
SR Liquidity MT5
Oleg Rodin
5 (2)
SR Liquidity 는 시장 유동성이 집중되고 가격이 가장 강력하게 반응하는 숨겨진 구간을 포착하도록 설계된 트레이딩 지표입니다. 이러한 특수 유동성 구간은 강력한 지지 및 저항선 역할을 하며, 시장 반전 가능성이 가장 높은 지점을 명확하게 보여주는 지도가 되어 줍니다. SR Liquidity는 일반적인 지지 및 저항선을 단순히 그리는 대신, 실제 가격 움직임을 분석하여 매수 및 매도 압력이 집중되는 구간을 포착합니다. 이러한 구간은 실질적인 시장의 흐름을 주도하는 유동성 풀(liquidity pools)에 해당합니다. 이 지표는 해당 구간을 차트에 직접 시각화하여, 가격 반응이 실제로 나타나기 전에 이를 미리 예측할 수 있도록 돕습니다. 즉, 가격 추세가 전환될 가능성을 사전에 파악하게 해주는 것입니다. 결과적으로 이 지표는 가공되지 않은 가격 움직임(price action)을 시장의 핵심 가격대, 다시 말해 추세 전환점이 될 수 있는 지점들을 보여주는 명확하고 실용적인 로드맵
Crystal Quantum Pro
Muhammad Jawad Shabir
5 (3)
CRYSTAL QUANTUM PRO Institutional Signal & Trade Intelligence for MetaTrader 5 Final Price: 199 USD ----> Price goes up 10 USD after every 10 sales. Limited launch slots available, act fast. Most indicators give you an arrow and leave you alone. A naked arrow is a gamble. Winning consistently requires CONFLUENCE , a clear STOP and TARGET , and honest PROOF that the system works. Crystal Quantum Pro delivers all three in one clean, no-repaint package. Crystal Quantum Pro is a complete decision sy
Scalper Vault 는 성공적인 스캘핑에 필요한 모든 것을 제공하는 전문 스캘핑 시스템입니다. 이 표시기는 외환 및 바이너리 옵션 거래자가 사용할 수 있는 완전한 거래 시스템입니다. 권장 시간 프레임은 M5입니다. 시스템은 추세 방향으로 정확한 화살표 신호를 제공합니다. 또한 상단 및 하단 신호와 Gann 시장 수준을 제공합니다.  이 시스템은 사용하기가 매우 쉽습니다. 원하는 시장 지역의 화살표만 따라가면 됩니다. 엑시트는 가격이 적정 수준에 도달하거나 시장의 고점 또는 저점 신호가 나타날 때 수행됩니다.  표시기는 PUSH 알림을 포함한 모든 유형의 경고를 제공합니다. 인디케이터 구매 후 연락주세요. 내 개인 거래 권장 사항과 훌륭한 보너스 지표를 무료로 공유합니다! 나는 당신에게 행복하고 유익한 거래를 기원합니다!
Power Candles MT5
Daniel Stein
4.73 (11)
Power Candles V3 - 자체 최적화 강도 지표 파워 캔들 V3는 적용된 모든 차트에서 통화 및 상품의 강세를 실행 가능한 거래 계획으로 전환합니다. 단순히 캔들에 색상을 입히는 대신, 백그라운드에서 실시간 자동 최적화를 수행하여 현재 보고 있는 종목에 대한 최적의 손절매, 익절 및 신호 임계값을 제공합니다. 한 번의 클릭으로 실시간 거래에 적용할 수 있으며, 진입점, 손절매 및 익절 선이 정확한 가격에 맞춰 차트에 표시되고, 방향과 함께 알림이 발령됩니다. 이 도구는 Stein Investments 에코시스템의 일부입니다. 18개 이상의 도구와 함께 당신의 1대1 AI 트레이딩 멘토 Max.  항상 대기 중, 모든 인디케이터를 깊이 있게 이해, 무언가를 차근차근 생각해보고 싶은 순간에 도움을 줍니다.  https://stein.investments 에서 만나보세요 매 종가 바마다 3,000회 이상의 트레이딩 시뮬레이션. 9가지 강도 상태. 2가지 전략을 병렬로 테스트.
CRT Candle Range Theory HTF MT5.   Ultimate CRT Indicator: Advanced ICT Concepts and Malaysian SnR Trading System Master the Market Maker's Footprints with the Most Advanced Candle Range Theory Indicator Unlock the true power of  Smart Money Concepts (SMC)  and trade precisely like the institutions with the  Ultimate CRT Indicator . Built exclusively for serious traders, this indicator automates the highly effective  Candle Range Theory (CRT) , a core pillar of  ICT Concepts (Inner Circle Trader
FX Trend MT5 NG
Daniel Stein
5 (6)
FX Trend NG: 차세대 멀티 마켓 트렌드 인텔리전스 개요 FX Trend NG 는 다중 시간 프레임 기반의 전문 트렌드 분석 및 시장 모니터링 도구입니다. 몇 초 만에 전체 시장 구조를 파악할 수 있도록 설계되었습니다. 여러 차트를 일일이 전환할 필요 없이, 어떤 종목이 추세에 있는지, 어디에서 모멘텀이 약화되고 있는지, 그리고 어떤 시간 프레임이 서로 정렬되어 있는지 즉시 확인할 수 있습니다. 출시 기념 특별 혜택 – FX Trend NG 를 $30 (6개월) 또는 $80 평생 라이선스 로 이용할 수 있습니다. 이미 Stein Investments 고객이신가요? -> 메시지를 보내 전용 고객 그룹에 참여하세요. 설정이나 사용 방법이 필요하신가요? -> Stein Investments 공식 페이지 를 방문하세요. 1. FX Trend NG가 특별한 이유 3단계 추세 로직 – 단순한 Buy / Sell이 아닙니다 • 대부분의 지표는 Buy 또는 Sell 두 가지 상태만 제
Trend Catcher ind mt5
Ramil Minniakhmetov
5 (18)
트렌드 캐처 인디케이터 트렌드 캐처 인디케이터는 개발자가 자체 개발한 맞춤형 적응형 트렌드 분석 지표들을 조합하여 시장 가격 움직임을 분석합니다. 단기적인 노이즈를 제거하고 근본적인 모멘텀 강도, 변동성 확대, 가격 구조 움직임에 집중하여 진정한 시장 방향을 파악합니다. 또한 이동 평균, RSI, 변동성 필터와 같은 맞춤형 지표들을 활용하여 가격을 평활화하고 트렌드를 필터링합니다. 실제 운영 모니터링 및 기타 제품은 다음 링크에서 확인하실 수 있습니다:   https://www.mql5.com/en/users/mechanic/seller 텔레그램에서는 EA나 설정 파일을 판매하지 않습니다. 사기이니 주의하세요. 모든 설정 파일은 블로그에서 무료로 제공됩니다. 중요! 구매 후 즉시 연락 주시면 사용 방법 및 보너스를 드립니다!
Crystal Heikin Ashi Signals
Muhammad Jawad Shabir
5 (4)
Crystal Heikin Ashi Signals - Professional Trend & Signal Detection Indicator Advanced Heikin Ashi Visualization with Intelligent Signal System for Manual & Automated Trading Final Price: $149 ---------> Price goes up $10 after every 10 sales . Limited slots available — act fast . Overview Crystal Heikin Ashi Signals is a professional-grade MetaTrader 5 indicator that combines pure Heikin Ashi candle visualization with an advanced momentum-shift detection system. Designed for both manual traders
Smc Pro ToolKit
Talal N Z Aljarusha
5 (12)
SMC PRO TOOLKIT — SMART MONEY ANALYSIS & STRUCTURED TRADE PLANNING SMC Pro ToolKit is a professional Smart Money Concepts analysis workspace for MetaTrader 5. It combines market structure, multi-timeframe analysis, institutional price zones, setup evaluation, confirmation tools, volume context, alerts, and risk planning inside one organized chart environment. One workspace. Multiple layers of confirmation. One structured trading plan. OPEN COMPLETE USER GUIDE MULTI-CONDITION SETUP ENGINE At
제작자의 제품 더 보기
Smart Divergence Finder Indicator In-depth Analysis: A Practical Guide to Trend, Divergence, and Resonance Indicator Introduction Smart Divergence Finder is an intelligent main-chart comprehensive indicator designed for MT4/MT5 platforms. It overcomes the fragmented limitations of traditional sub-chart divergence analysis by integrating: Trend determination Multi-indicator divergence detection Intelligent signal filtering All key trading signals are displayed directly on the price chart. Its co
Product Overview Dual Swing Breakout System is a dual swing breakout state machine main chart indicator designed specifically for both   MT4 and MT5   platforms. By constructing two completely independent fast and slow swing high/low tracking systems, it transforms market structure into a clear state machine model. When price breaks key swing extremes, the system changes the state line color and triggers trading signals. This indicator helps traders filter market noise, precisely identify short
FREE
Product Overview Pattern Recognition Master System is a main‑chart classic candlestick pattern auto‑recognition indicator designed for both the   MT4 and MT5   platforms. It automatically detects and labels eleven classic reversal and continuation patterns on the main chart, covering double tops and bottoms, head‑and‑shoulders tops and bottoms, hammer and hanging man, engulfing, doji, and morning and evening stars, with an independent cooldown period assigned to each pattern category to suppres
FREE
Product Overview Pyramiding Entry Master is a main‑chart moving‑average trend‑following and pyramiding‑entry indicator designed for both the   MT4 and MT5   platforms. It draws a four‑period moving‑average system (MA5, MA10, MA20, MA60) on the main chart and, based on a 55‑period trend‑momentum model, volume‑expansion confirmation, and multiple oversold conditions, automatically generates three types of buy signals: Chase (halfway momentum entry), Add (next‑day pyramiding), and Dip Buy (deep‑ov
FREE
Product Overview TD Sequential Pro is a TD Sequential main chart indicator designed specifically for both   MT4 and MT5   platforms, deeply developed based on the classic Tom DeMark Sequential theory. By statistically analyzing the comparison relationship between 9 consecutive bars' closing prices and their 4 preceding bars, this indicator precisely identifies market momentum exhaustion points. It helps traders capture high-probability reversal opportunities at trend ends, while providing compr
FREE
Product Overview Dynamic Fibonacci Deviation is an adaptive Fibonacci levels main chart indicator designed specifically for both   MT4 and MT5   platforms. It innovatively combines EMA dynamic midline, standard deviation volatility, and Fibonacci ratios to construct an intelligent support/resistance system that automatically expands and contracts with market volatility. Through overbought/oversold recognition and fall back/bounce signals, this indicator helps traders accurately capture high-pro
FREE
Product Overview Dual Swing Breakout System is a dual swing breakout state machine main chart indicator designed specifically for both   MT4 and MT5   platforms. By constructing two completely independent fast and slow swing high/low tracking systems, it transforms market structure into a clear state machine model. When price breaks key swing extremes, the system changes the state line color and triggers trading signals. This indicator helps traders filter market noise, precisely identify short
FREE
Product Overview Pyramiding Entry Master is a main‑chart moving‑average trend‑following and pyramiding‑entry indicator designed for both the   MT4 and MT5   platforms. It draws a four‑period moving‑average system (MA5, MA10, MA20, MA60) on the main chart and, based on a 55‑period trend‑momentum model, volume‑expansion confirmation, and multiple oversold conditions, automatically generates three types of buy signals: Chase (halfway momentum entry), Add (next‑day pyramiding), and Dip Buy (deep‑ov
FREE
Product Overview Dynamic Fibonacci Deviation is an adaptive Fibonacci levels main chart indicator designed specifically for both   MT4 and MT5   platforms. It innovatively combines EMA dynamic midline, standard deviation volatility, and Fibonacci ratios to construct an intelligent support/resistance system that automatically expands and contracts with market volatility. Through overbought/oversold recognition and fall back/bounce signals, this indicator helps traders accurately capture high-pro
FREE
Product Overview TD Sequential Pro is a TD Sequential main chart indicator designed specifically for both   MT4 and MT5   platforms, deeply developed based on the classic Tom DeMark Sequential theory. By statistically analyzing the comparison relationship between 9 consecutive bars' closing prices and their 4 preceding bars, this indicator precisely identifies market momentum exhaustion points. It helps traders capture high-probability reversal opportunities at trend ends, while providing compr
FREE
Product Overview Bottom Picker Pro is a bull/bear wave sub-window indicator designed specifically for both   MT4 and MT5   platforms. By integrating multi-period extreme value algorithms with multiple smoothing techniques, it constructs a highly responsive bull/bear trend line and wave tracking system. This indicator precisely identifies momentum reversals in extremely overbought and oversold zones, providing clear bottom-picking, top-escaping, and trend-pullback signals, helping traders accura
Product Overview Pattern Recognition Master System is a main‑chart classic candlestick pattern auto‑recognition indicator designed for both the   MT4 and MT5   platforms. It automatically detects and labels eleven classic reversal and continuation patterns on the main chart, covering double tops and bottoms, head‑and‑shoulders tops and bottoms, hammer and hanging man, engulfing, doji, and morning and evening stars, with an independent cooldown period assigned to each pattern category to suppres
FREE
Product Overview Liquidity Pool Hunter is a liquidity pool main chart indicator designed specifically for both   MT4 and MT5   platforms. Based on institutional order flow theory, it constructs liquidity accumulation zones by statistically analyzing recent highs and lows, precisely identifying sweep, fake break, and true break behaviors in the market. This indicator helps traders view the market from an institutional perspective, recognizing smart money liquidity hunting behavior, thereby captu
Dynamic Trend Follower Main Chart Indicator Deep Analysis: Dual MA Color Change + Cross Markers + Buy/Sell Signals + Trend Reversal + Strong Cross Indicator Overview Dynamic Trend Follower is a premium main chart moving average crossover composite signal indicator designed exclusively for the   MT4 platform . It breaks through the limitations of traditional single moving averages or simple crossovers by integrating a   Dual MA Trend Color Change System ,   Cross "+" Markers with Spread Percenta
FREE
Dynamic Trend Follower Main Chart Indicator Deep Analysis: Dual MA Color Change + Cross Markers + Buy/Sell Signals + Trend Reversal + Strong Cross Indicator Overview Dynamic Trend Follower is a premium main chart moving average crossover composite signal indicator designed exclusively for the   MT4 、5platform . It breaks through the limitations of traditional single moving averages or simple crossovers by integrating a   Dual MA Trend Color Change System ,   Cross "+" Markers with Spread Percen
FREE
Gap Up Hunter
You Long Guo
Reasonable Indicators, Reasonable Prices 1. Core Functions   Multi-Period Resonance : Uses   13, 34, 55   period KDJ for signal filtering.   Gap Up Capture : Identifies   Gap Up   patterns for strong start entries.   Reversal Warning : Predicts tops/bottoms using   J-value   sensitivity. 2. Signal Description   Buy Signal 1: UP (Gap Up) Displays white   “UP”   text. Indicates a   Gap Up   bullish candle above   MA5 . Shows strong   bullish power , suitable for   trend following .
FREE
Smart Divergence Finder Indicator In-depth Analysis: A Practical Guide to Trend, Divergence, and Resonance Indicator Introduction Smart Divergence Finder is an intelligent main-chart comprehensive indicator designed for MT4/MT5 platforms. It overcomes the fragmented limitations of traditional sub-chart divergence analysis by integrating: Trend determination Multi-indicator divergence detection Intelligent signal filtering All key trading signals are displayed directly on the price chart. Its co
Black Horse Finder Indicator In-depth Analysis: A Practical Guide to Trend, Support/Resistance, and Multi-Signal Trading Indicator Introduction Black Horse Finder is a comprehensive main-chart indicator designed specifically for the MT4 platform. Originating from the classic TongDaXin composite main chart logic, it breaks through the limitations of single moving averages or isolated indicators. It highly integrates trend determination, dynamic support/resistance levels, multiple buy signals (su
Channel Breakout Master: A Comprehensive Guide to Dual-Channel Trend Analysis with Weighted High-Low EMA and Trend State Identification Introduction Channel Breakout Master is an advanced chart indicator originally derived from the Tongdaxin SLTD series, specifically designed for both MT4 and MT5 platforms. This indicator transcends the limitations of traditional single Bollinger Bands or moving average channels by implementing a sophisticated dual-channel architecture combining   Weighted High-
Ultimate Signal Hub Main Chart Indicator Deep Analysis: MA60 Trend Baseline, Momentum Ignition & Multi-Layer Resonance Trading Guide Indicator Overview Ultimate Signal Hub is a premium main chart composite signal indicator designed exclusively for the   MT4/MT5 platform . It breaks through the limitations of traditional single moving averages or oscillators by integrating a multi-dimensional nested architecture comprising the   MA60 Trend Baseline ,   MACD Variant Ignition Algorithm ,   KDJ-Typ
Product Overview Bull Bear Decision Maker is an all-in-one main chart trend and reversal decision indicator designed specifically for both   MT4 and MT5   platforms. Originating from the classic NXMMA trading system, it deeply integrates Williams %R variants, KDJ, RSI, and a multiple moving average system. Through multi-dimensional algorithmic resonance, this indicator helps traders accurately identify high-probability trend-following, bottom-reversal, and top-escaping opportunities in complex
Product Overview Channel State Analyzer is a trend channel main chart indicator designed specifically for both   MT4 and MT5   platforms. It integrates linear regression slope trend lines, weighted channels, 55-period high/low monitoring, and channel state recognition. Through the combination of dynamic channels and trend lines, this indicator helps traders accurately identify trend reversals, channel breakouts, and short-term bottom opportunities in complex markets, while providing comprehensi
Product Overview Auto Trend Bands is an adaptive trend channel main chart indicator designed specifically for both   MT4 and MT5   platforms. It dynamically constructs trend channels based on linear regression algorithms and standard deviation, automatically identifying market trend direction and changing colors in real-time based on slope changes. Through channel breakout signals and strong trend markers, this indicator helps traders accurately capture trend initiation and acceleration opportu
Product Overview Color Trend Master is a multi-layer WMA smoothed trend line main chart indicator designed specifically for both   MT4 and MT5   platforms. Based on the classic MavilimW algorithm, it constructs an extremely smooth yet responsive trend-following system through 6 layers of nested Fibonacci-period Weighted Moving Average calculations. This indicator precisely identifies trend turning points and helps traders clearly grasp trend direction and momentum strength in complex markets th
Product Overview 6in1 Confluence System is a multi-indicator resonance sub-window indicator designed specifically for both   MT4 and MT5   platforms. It innovatively integrates 6 classic technical indicators—MACD, KDJ, RSI, LWR, BBI, and MTM—into a single sub-window, displaying bull/bear power comparison in real-time through a visual dot matrix. When all 6 indicators point in the same direction simultaneously, the system issues high-probability resonance signals, helping traders quickly identif
Product Overview Triple Divergence Hunter is a multi-indicator divergence detection sub-window indicator designed specifically for both   MT4 and MT5   platforms. It deeply integrates three classic momentum indicators—MACD, KDJ, and RSI—using rigorous crossover and extreme value comparison algorithms to precisely capture top and bottom divergences between price and indicators. Additionally, the indicator features a built-in custom K88/D88 momentum trend system, helping traders identify reversal
Product Overview Five Dimension Resonance System is a five-dimensional resonance trading main chart indicator designed specifically for both   MT4 and MT5   platforms. It innovatively integrates 5 independent trading systems—trend following, volatility breakout, range breakout, divergence reversal, and momentum scoring—into one unified framework. Through a strict resonance filtering mechanism, high-probability resonance entry alerts are triggered only when at least 2 out of the 5 systems simult
Product Overview Peak Valley Hunter (HZ88) is a comprehensive main chart trend-following and swing reversal indicator designed specifically for both   MT4 and MT5   platforms. By constructing a triple composite moving average system (Trade Line and Trend Line), combined with dynamic support/resistance tracking algorithms and candlestick pattern recognition technology, it provides traders with comprehensive trading signals ranging from trend confirmation and momentum explosion to local reversals
Product Overview Multi Dimensional Bottom Finder is an advanced sub-window oscillator and multi-dimensional resonance indicator designed specifically for both   MT4 and MT5   platforms. Breaking through the limitations of traditional single KDJ or RSI indicators, it constructs a highly in-depth bottom-hunting system by integrating multi-period stochastic oscillator algorithms, CCI extreme value analysis, volume anomaly detection, and bias rate recovery models. This indicator keenly captures mom
Product Overview Low Buy High Sell Radar is an all‑in‑one main‑chart trend‑following and swing‑trading indicator designed for both the   MT4 and MT5   platforms. By building a dynamic trend‑line color‑switching system and combining multi‑period oscillator algorithms (TSI and RSI), a volume‑price momentum model, and a signal‑cooldown filter, it delivers a full range of trading signals covering trend confirmation, overbought/oversold detection, and precise entry and exit. With rigorous logic, cle
필터:
리뷰 없음
리뷰 답변