Pattern Recognition Master System MT4

Product Overview
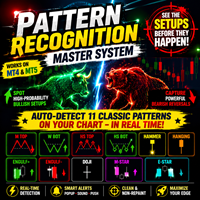
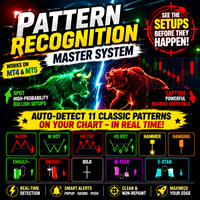
Pattern Recognition Master System is a main‑chart classic candlestick pattern auto‑recognition indicator designed for both the MT4 and MT5 platforms. It automatically detects and labels eleven classic reversal and continuation patterns on the main chart, covering double tops and bottoms, head‑and‑shoulders tops and bottoms, hammer and hanging man, engulfing, doji, and morning and evening stars, with an independent cooldown period assigned to each pattern category to suppress duplicate signals at the source. With compact visuals, clearly layered signals, and per‑pattern alert switches, it is an ideal main‑chart tool for building a pattern‑trading system.
Core Features
Automatic Pattern Recognition and Compact Labeling The system automatically draws pattern‑name text and directional arrows near qualifying candles. Bearish patterns (double top, head‑and‑shoulders top, hanging man, bearish engulfing, doji, evening star) are labeled above the candle, while bullish patterns (double bottom, head‑and‑shoulders bottom, hammer, bullish engulfing, morning star) are labeled below the candle; when multiple patterns appear on the same candle, they are automatically offset in a compact layout to avoid text overlap. Double tops and head‑and‑shoulders tops come with a red downward arrow, and double bottoms and head‑and‑shoulders bottoms come with a green upward arrow, making direction instantly clear. The MT5 version additionally supports pattern candle color‑coding, coloring the key candles that trigger patterns according to their bullish or bearish nature, so that pattern locations are shown intuitively through candle color.
Bearish Pattern Signals
  • M Top (Double Top): Triggered when the current candle is a local peak, a similar high of comparable height exists within the last 10 to 25 candles, and the current candle closes bearish, displaying a red downward arrow with the text "M Top" above the candle. This means price has failed twice to break the same resistance zone and bullish momentum is exhausted, making it a classic top‑reversal short or exit signal.
  • HS Top (Head‑and‑Shoulders Top): Triggered when a head‑and‑shoulders top structure is confirmed (the central head is higher than both shoulders, the two shoulders are of similar height, the current candle is a local peak, and the close is below the 10‑period moving average), displaying a red downward arrow with the text "HS Top" above the candle. This means a complete top‑reversal structure has formed, making it an extremely reliable trend‑reversal short signal.
  • Hanging (Hanging Man): Triggered when the candle's lower shadow is at least twice the body length, the upper shadow is smaller than the body, and the close is above the 10‑period moving average, displaying the orange text "Hanging" above the candle. This means that at the high of an uptrend, signs of weakening downside support are appearing, making it a short‑term topping warning signal.
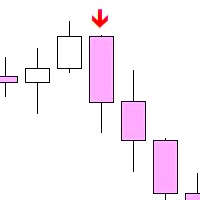
  • Engulf- (Bearish Engulfing): Triggered when the current bearish candle is completely engulfed by the previous bullish candle (open above the prior close and close below the prior open), displaying the red text "Engulf-" above the candle. This means bears have recaptured the entire prior gain and pushed back, making it a strong short‑term reversal short signal.
  • Doji (Doji): Triggered when the candle body is less than 10% of the total candle range, displaying the white text "Doji" above the candle. This means bullish and bearish forces have reached a brief balance within the candle, making it a neutral warning signal that the trend may pause or reverse; confirmation from the surrounding candles is recommended.
  • E-Star (Evening Star): Triggered when a three‑candle combination satisfies "the candle two bars back is bullish, the middle candle has a clearly smaller body, and the current candle closes bearish below the midpoint of the body two bars back," displaying the aqua text "E-Star" above the candle. This means a clear three‑candle reversal structure has appeared at the high of an uptrend, making it a classic top‑reversal exit signal.
Bullish Pattern Signals
  • W Bot (Double Bottom): Triggered when the current candle is a local bottom, a similar low of comparable depth exists within the last 10 to 25 candles, and the current candle closes bullish, displaying a green upward arrow with the text "W Bot" below the candle. This means price has found support twice at the same level and bearish momentum is exhausted, making it a classic bottom‑reversal long signal.
  • HS Bot (Head‑and‑Shoulders Bottom): Triggered when a head‑and‑shoulders bottom structure is confirmed (the central head is lower than both shoulders, the two shoulders are of similar depth, the current candle is a local bottom, and the close is above the 10‑period moving average), displaying a green upward arrow with the text "HS Bot" below the candle. This means a complete bottom‑reversal structure has formed, making it an extremely reliable trend‑reversal long signal.
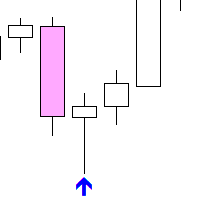
  • Hammer (Hammer): Triggered when the candle's lower shadow is at least twice the body length, the upper shadow is smaller than the body, and the close is below the 10‑period moving average, displaying the yellow text "Hammer" below the candle. This means strong downside support has appeared at the low of a downtrend, making it a short‑term bottoming rebound signal.
  • Engulf+ (Bullish Engulfing): Triggered when the current bullish candle is completely engulfed by the previous bearish candle (open below the prior close and close above the prior open), displaying the green text "Engulf+" below the candle. This means bulls have recaptured the entire prior loss and pushed back, making it a strong short‑term reversal long signal.
  • M-Star (Morning Star): Triggered when a three‑candle combination satisfies "the candle two bars back is bearish, the middle candle has a clearly smaller body, and the current candle closes bullish above the midpoint of the body two bars back," displaying the magenta text "M-Star" below the candle. This means a clear three‑candle reversal structure has appeared at the low of a downtrend, making it a classic bottom‑reversal entry signal.
Practical Application
In day‑to‑day pattern trading, it is recommended to use signals in layers by structural level. Double tops/bottoms and head‑and‑shoulders tops/bottoms are multi‑candle structural reversal signals with the highest reliability, suitable as the core basis for main‑position entry or exit; hammer, hanging man, and engulfing are single‑ or double‑candle momentum reversal signals that react quickly, suitable for short‑term timing and trial positions; doji is a neutral balance signal that does not itself provide a directional conclusion and should be treated as a prompt to "wait for the next candle to confirm"; morning and evening stars are three‑candle combination reversal signals with structural completeness between the two, suitable as confirmation signals for swing entries.
When bearish patterns (M Top, HS Top, Hanging, Engulf-, E-Star) appear, long holders should consider trimming or exiting, and flat traders can look for short opportunities; when bullish patterns (W Bot, HS Bot, Hammer, Engulf+, M-Star) appear, short holders should consider covering, and flat traders can look for long opportunities. All pattern signals are best used in combination with key support and resistance levels: reliability increases significantly when a pattern appears near a prior high or low, a trendline, or a moving average.
Parameter Settings
Cooldown filter parameters: The system assigns independent cooldown periods to four pattern categories. Double Top/Bot cooldown defaults to 15 candles, controlling the repetition frequency of double top and bottom signals; Head-Shoulder cooldown defaults to 20 candles, controlling the repetition frequency of head‑and‑shoulders patterns; Candle pattern cooldown defaults to 3 candles, controlling the repetition frequency of single‑candle patterns such as hammer, hanging man, engulfing, and doji; Star pattern cooldown defaults to 5 candles, controlling the repetition frequency of morning and evening stars. Max Lookback Bars defaults to 2000, controlling the maximum number of historical candles marked with patterns, balancing chart cleanliness with backtesting needs.
Alert settings: Alert On Bar Close is enabled by default and is strongly recommended to stay enabled, so alerts fire only after a candle closes and confirms the pattern, avoiding false pattern signals caused by intrabar price swings. Popup and Sound are enabled by default, while Push and Email are disabled by default; traders can adjust them flexibly according to their screen‑watching habits.
Per‑signal alert switches: The system lets you independently enable or disable alerts for each of the eleven pattern signals, M Top, W Bot, HS Top, HS Bot, Hammer, Hanging, Engulf+, Engulf-, Doji, M-Star, and E-Star. By default, alerts are enabled for double tops/bottoms, head‑and‑shoulders tops/bottoms, engulfing, and morning/evening stars, while hammer, hanging man, and doji are disabled by default due to their higher frequency, so you receive only the high‑quality signals relevant to your current strategy.
Usage Recommendations
This indicator applies to mainstream instruments such as forex, precious metals, indices, and cryptocurrencies, and is fully compatible with the MT4 and MT5 terminals. It is recommended for use on the H1 timeframe and above; pattern structures on larger timeframes are more stable and practically valuable than on smaller ones, effectively reducing noise patterns.
It is recommended to combine this indicator with trend indicators (such as moving averages) or volume indicators. For example, a Hammer or Engulf+ signal appearing within an uptrend is a with‑trend pullback buying opportunity with higher reliability than a counter‑trend signal; a Hanging or Engulf- signal appearing within a downtrend is a with‑trend rebound shorting opportunity. No pattern recognition can guarantee a 100% win rate, so please always set strict stop losses and control position risk, using this indicator as a decision aid rather than the sole basis.
Summary
Pattern Recognition Master System perfectly fuses three mechanisms: automatic recognition of eleven classic candlestick patterns, layered cooldown filtering, and independent alert control. It is not only a visually compact, clearly signaled main‑chart pattern labeling tool but also a practical pattern‑trading system with structural grading, directional layering, and all‑round filtering, suitable for traders at every level to build robust reversal‑capture and pattern‑following rules and capture high‑win‑rate reversal opportunities while controlling risk.

추천 제품
The indicator detects and displays М. Gartley's Butterfly pattern. The pattern is plotted by the extreme values of the ZigZag indicator (included in the resources, no need to install). After detecting the pattern, the indicator notifies of that by the pop-up window, a mobile notification and an email. The pattern and wave parameters are displayed on the screenshots. The default parameters are used for demonstration purposes only in order to increase the amount of detected patterns. Parameters z
PZ Penta O MT4
PZ TRADING SLU
2.33 (3)
The Penta-O is a 6-point retracement harmonacci pattern which usually precedes big market movements. Penta-O patterns can expand and repaint quite a bit. To make things easier this indicator implements a twist: it waits for a donchian breakout in the right direction before signaling the trade. The end result is an otherwise repainting indicator with a very reliable trading signal. The donchian breakout period is entered as an input. [ Installation Guide | Update Guide | Troubleshooting | FAQ | A
FREE
Free automatic fibonacci
Tonny Obare
4.69 (51)
Free automatic Fibonacci is an indicator that automatically plots a Fibonacci retracement based on the number of bars you select on the BarsToScan setting in the indicator. The Fibonacci is automatically updated in real time as new highest and lowest values appears amongst the selected bars. You can select which level values to be displayed in the indicator settings. You can also select the color of the levels thus enabling the trader to be able to attach the indicator several times with differe
FREE
하모닉 패턴은 시장 반전점을 예측하는 데 가장 적합합니다. 이러한 패턴은 높은 승률과 하루 동안 다양한 거래 기회를 제공합니다. 저희 인디케이터는 하모닉 트레이딩 문헌에 기반하여 가장 인기 있는 하모닉 패턴을 식별합니다. 중요 사항: 이 인디케이터는 다시 그리지 않으며 (D 지점에서 패턴을 감지함), 따라잡지 않습니다 (패턴이 유효하거나 취소됨). 사용 방법: MT5 차트에 인디케이터를 끌어다 놓으세요. 패턴 감지를 TRUE로 설정하세요 (ABCD; Gartley). 원하는대로 편차를 조정하세요 (높은 편차는 더 많은 패턴, 낮은 편차는 더 적은 패턴). 색상을 원하는 대로 사용자 정의하세요. 필요에 따라 ENTRY POINT, TP 및 SL에 대한 경고를 활성화하거나 비활성화하세요. 패턴 감지 시: 알고리즘은 D 지점에서 패턴을 감지합니다. 경고가 활성화되어 있으면 패턴 감지에 대한 알림을 보냅니다. 패턴이 무효화되면 "패턴 취소"라는 메시지가 포함된 경고가 트리거됩니다. 성공적인
FREE
Basic Harmonic Pattern
Mehran Sepah Mansoor
4.61 (64)
이 지표는 시장 반전 시점을 예측하는 가장 인기 있는 하모닉 패턴을 식별합니다. 이러한 하모닉 패턴은 외환 시장에서 지속적으로 반복되는 가격 형성이며 향후 가능한 가격 움직임을 제안합니다 / 무료 MT5 버전 또한 이 보조지표에는 시장 진입 신호와 다양한 이익실현 및 손절매 신호가 내장되어 있습니다. 하모닉 패턴 지표는 자체적으로 매수/매도 신호를 제공할 수 있지만 다른 기술 지표를 사용하여 이러한 신호를 확인하는 것이 좋습니다. 예를 들어, 매수/매도하기 전에 추세의 방향과 모멘텀의 강도를 확인하기 위해 RSI 또는 MACD와 같은 오실레이터를 사용하는 것을 고려할 수 있습니다. 이 인디케이터의 대시보드 스캐너: ( Basic Harmonic Patterns Dashboard ) 포함된 하모닉 패턴 가틀리 버터플라이 박쥐 게 Shark Cypher ABCD 주요 입력 Max allowed deviation (%): 이 매개변수는 하모닉 패턴의 형성에 허용되는 허용 오차
FREE
Wise Men Indicator demo
Bohdan Kasyanenko
3 (2)
The indicator displays signals according to the strategy of Bill Williams on the chart. Demo version of the indicator has the same features as the paid, except that it can work only on a demo account . Signal "First Wise Man" is formed when there is a divergent bar with angulation.  Bullish divergent bar - with lower minimum and closing price in the upper half. Bearish divergent bar - higher maximum and the closing price at the bottom half. Angulation is formed when all three lines of Alligator
FREE
Extremum Reverse Bar
Yurij Izyumov
2.8 (5)
This indicator has been created for finding the probable reversal points of the symbol price. A small candlestick reversal pattern is used it its operation in conjunction with a filter of extremums. The indicator is not redrawn! If the extremum filter is disabled, the indicator shows all points that have a pattern. If the extremum filter is enabled, the condition works – if the history Previous bars 1 candles back contains higher candles and they are farther than the Previous bars 2 candle, such
FREE
Pin Bars
Yury Emeliyanov
4.83 (6)
주요 목적:"핀 바"는 금융 시장 차트에서 핀 바를 자동으로 감지하도록 설계되었습니다. 핀 바는 특징적인 몸체와 긴 꼬리를 가진 촛불로,추세 반전 또는 교정을 신호 할 수 있습니다. 작동 원리:표시기는 차트의 각 촛불을 분석하여 촛불의 몸,꼬리 및 코의 크기를 결정합니다. 미리 정의 된 매개 변수에 해당하는 핀 막대가 감지되면 표시기는 핀 막대의 방향(강세 또는 약세)에 따라 위 또는 아래 화살표로 차트에 표시합니다. 매개 변수: 꼬리의 길이와 핀 바의 몸체 크기 사이의 최소 비율을 정의합니다. "코"와 핀 바의 꼬리 사이의 최대 허용 비율을 설정합니다. 화살표 크기-표시된 핀 막대와 차트에서 핀 막대를 가리키는 화살표 사이의 거리를 정의합니다. 신청:"핀 바"표시기는 잠재적 인 추세 반전 지점을 식별하고 시장 또는 가까운 위치에 진입하기 위해 신호를 생성하는 데 사용할 수 있습니다. 올바르게 사용하고 다른 기술 지표 및 분석 방법과 결합하면이 지표는 거래 결과를 향상시킬 수
FREE
Aurum Trend Scout
David Sanchez Clavero
Aurum Trend Scout — Aurum Trend Engine 무료 LITE 버전 Aurum Trend Scout는 Aurum Trend Engine 전문가 자문의 무료 버전 입니다. H1 타임프레임에서 XAUUSD(금)을 Parabolic SAR + 볼린저 밴드 폭 비율 기반 추세추종 전략으로 거래합니다. 이 LITE 버전에는 ATR 기반 손절을 포함한 전체 전략 로직이 포함되어 있습니다. 고정 랏을 사용하며, FULL 버전의 동적 자금 관리는 포함되지 않습니다. 검증된 성과 (실제 데이터, XAUUSD H1, 2014-2025) 스프레드 20포인트: 수익률 1.32 | 승률 63.65% | 최대 하락 2.22% | 순이익 $11,363 | 1,004건 스프레드 30포인트: 수익률 1.25 | 승률 62.60% | 최대 하락 2.40% | 순이익 $9,378 | 1,016건 LITE 버전 기능 전체 전략 로직 (FULL과 동일) ATR 기반 손절 매수만 — 마틴게일 없음,
FREE
Enhanced Volume Profile: The Ultimate Order Flow & Liquidity Analysis Tool Overview Enhanced Volume Profile   is an indicator for MetaTrader 5 that displays the traded volume at specific price levels over a defined period. It separates the total volume into buy and sell components, presenting them as a side-by-side histogram on the chart. This allows users to observe the volume distribution and the proportion of buy and sell volumes at each price level. Graphics Rendering The indicator uses t
FREE
Smc suite
Eric Treboldi
just for a limited time you can get unlimited god money maker item! for free! after 50 download it will go at 89 THE TRADING PANNEL IS AN EA it not come with the indicator Smart Money Suite v1 – All-In-One Institutional SMC Toolkit for MT4 Smart Money Suite is a comprehensive, institutional-grade trading toolkit engineered for traders operating with Smart Money Concepts (SMC) and ICT methodologies. The indicator consolidates Market Structure analysis, Liquidity Mapping, Fair Value Gaps, Equi
FREE
Goldcrest Indicator MT4 — Free BUY, SELL and Initial SL Levels Goldcrest Indicator MT4 is a free, standalone MetaTrader 4 indicator that marks qualifying BUY and SELL signals with their entry prices and initial stop-loss (SL) reference levels. It brings Goldcrest's multi-timeframe structural signal framework to a clean, easy-to-read MT4 chart, without executing trades. Key Features Live entry signals: clear BUY and SELL chart labels with the observed broker Ask price for BUY and Bid price for SE
FREE
Line
Andrea Fontanini
free only until the end of the week The following indicator must be used and contextualized according to your trading methodologies. It provides excellent trading insights and identifies rejection zones on the drawn lines. Several parameters can be customized. The indicator will plot three levels above and below the opening price on D1, W1, and MN1. It will provide the daily ADR and display two additional daily sessions (EUROPE session and USA session). The colors of the various lines can be cu
FREE
Pivot Pro MT4
Samil Bozuyuk
5 (3)
Draws Daily, Weekly and Monthly pivots and the respective supports and resistances levels (S1, S2, S3, R1, R2, R3). Ideal for placing stop losses and/or using as a break-out strategy. Features Unlike other pivot indicators in market you get very clean charts. Pivot levels are plotted irrespective of timeframe, on which you trade, i.e. M1, M5, M15, M30, H1,H4 or Daily timeframes. Pivot levels do not change when you change timeframe. Fully customizable options.    If you are looking at Fibonacci
FREE
Fx BFP Pivot Points
Maged Ait Abbi
5 (6)
A forex   pivot point   strategy could very well be a trader’s best friend as far as identifying levels to develop a bias, place stops and identify potential profit targets for a trade. Pivot points have been a go-to for traders for decades. The basis of pivot points is such that price will often move relative to a previous limit, and unless an outside force causes the price to do so, price should stop near a prior extreme. Pivot point trading strategies vary which makes it a versatile tool for
FREE
Power Trend Free
Yurij Kozhevnikov
5 (2)
Power Trend Free - the indicator shows the trend strength in the selected period. Input Parameters The indicator has three input parameters: Period - a positive number greater than one, it shows the number of candlesticks used for calculations. If you enter one or zero, there will be no error, but the indicator will not be drawn. Applied Price - the standard "Apply to:" set meaning data used for the indicator calculation: Close - Close prices; Open - Open prices; High - High prices; Low - Low p
FREE
Expert Advisor designed for trading Engulfing Candle Patterns within a manually input price range the D point of harmonic patterns , gartley , bat cypher butterfly ect.  This is the  full version , word test in the title is an error How Does It Work Step 1 Identify a price range around the end point D of your harmonic pattern. Input two prices into the EA settings   Inp9 Upper Level- type the highest price where an engulfing candle pattern can occur. Inp9 Lower Level - type the lowest price whe
FREE
High/Low Daily Levels is a robust, lightweight, and precision-engineered technical indicator designed for MetaTrader 4. It plots the High and Low prices of the trading session as clean, horizontal dashed lines directly on your active chart. Whether you trade breakouts, trend continuations, or mean-reversion strategies around key session boundaries, this indicator ensures you always have precise visual references without cluttering your workspace. Key Features: * Dual Mode Operation: Choose be
FREE
WPR Breakout MT4
Mohamed Hassan Mohamed Hassan Alsherbiny
When prices breakout resistance levels are combined with   Larry Williams' Percentage Range "WPR"   oscillator breaks out its historical resistance levels then probability emerges to record farther prices.   It's strongly encouraged to confirm price breakout with oscillator breakout since they have comparable effects to price breaking support and resistance levels; surely, short trades will have the same perception. Concept is based on find swing levels which based on number of bars by each side
FREE
SC MTF Rsi MT4
Krisztian Kenedi
5 (1)
다중 타임프레임 지원, 사용자 정의 시각 신호 및 구성 가능한 알림 시스템을 갖춘 상대강도지수(RSI) 지표. 프리랜서 프로그래밍 서비스, 업데이트 및 기타 TrueTL 제품은 제 MQL5 프로필 에서 확인하실 수 있습니다. 피드백과 리뷰를 진심으로 환영합니다! RSI란 무엇인가요? 상대강도지수(RSI)는 가격 변화의 속도와 크기를 측정하는 모멘텀 오실레이터입니다. 이 지표는 0에서 100 사이에서 진동하며, 지정된 기간 동안 최근 상승폭과 최근 하락폭의 크기를 비교합니다. RSI는 주로 과매수 및 과매도 상태를 식별하는 데 사용됩니다. 높은 수치는 과매수 상태를 나타내고, 낮은 수치는 과매도 상태를 나타냅니다. 트레이더들은 또한 RSI와 가격 움직임 사이의 다이버전스를 주시하며, 이는 잠재적인 추세 전환을 신호할 수 있습니다. 기능: 화살표와 수직선을 사용한 시각적 신호 마커 구성 가능한 트리거(방향 변경, 레벨 교차, 고점/저점, 극단 구역)가 있는 세 개의 독립적인 신호
FREE
Advanced Market Sessions 지표로 시장의 리듬을 마스터하세요. 트레이딩에서 타이밍은 모든 것입니다. 주요 금융 센터가 언제 개장하고 마감하는지 정확히 아는 것은 시장 변동성, 유동성, 방향성 바이어스(directional bias)를 이해하는 열쇠입니다. 이 지표는 아시아, 런던, 뉴욕이라는 세 가지 주요 거래 세션에 대한 명확한 시각적 가시성을 제공합니다. 실시간으로 각 세션의 정확한 고가(High)와 저가(Low)를 자동으로 매핑함으로써, 이 도구는 진정한 기관의 맥락에서 거래할 수 있도록 역량을 부여합니다. 스마트 머니 컨셉(SMC), ICT, 돌파 전략, 평균 회귀 중 어떤 매매를 하든 세션의 경계를 아는 것은 고확률 트레이딩 셋업을 찾는 데 매우 중요합니다. 핵심 장점: 유동성 풀 식별: 세션 고가와 저가는 가격의 자연스러운 자석입니다. 유동성이 머무는 곳을 쉽게 찾아내고 잠재적인 돌파나 가짜 돌파(스탑 헌트)를 예측하세요. 세션 겹침(Overlaps) 활
FREE
PZ Turtle Trading
PZ TRADING SLU
3.8 (10)
The Turtle Trading Indicator implements the original Dennis Richards and Bill Eckhart trading system, commonly known as The Turtle Trader. This trend following system relies on breakouts of historical highs and lows to take and close trades: it is the complete opposite to the "buy low and sell high" approach. The main rule is "Trade an N-day breakout and take profits when an M-day high or low is breached (N must me above M)". [ Installation Guide | Update Guide | Troubleshooting | FAQ | All Prod
FREE
CCI Trend Monitor
Jeffrey Lloyd Lauzon
MTF Commodity Channel Index (CCI) Matrix (Free Advanced Trend Scanner Dashboard) The Multi-Timeframe Commodity Channel Index (CCI) Matrix is an institutional-grade technical scanner designed to evaluate cyclical trend momentum and structural threshold breakouts across 4 distinct execution timeframes simultaneously[cite: 18, 19]. By monitoring the M15, H1, H4, and D1 intervals concurrently[cite: 18, 19], this utility completely eliminates multi-chart cluttering and gives traders an instant execu
FREE
Signals and Alerts for Accelerator/Decelerator indicator based on these MQL5 posts: Accelerator Oscillator and Signals of the Indicator Accelerator Oscillator . Note : this tool is based on the code of Accelerator indicator developed by MetaQuotes Software Corp. Features The signals are triggered at   closing   of last bar/opening of a new bar; Any kind of alerts can be enabled: Dialog Box, Email message, SMS notifications for smartphones and tablets, and Sound alerts; Customizable arrows. By d
FREE
Ppr PA
Yury Emeliyanov
4.75 (4)
"Ppr PA" is a unique technical indicator created to identify "PPR" patterns on the currency charts of the MT4 trading platform. These patterns can indicate possible reversals or continuation of the trend, providing traders with valuable signals to enter the market. Features: Automatic PPR Detection:   The indicator automatically identifies and marks PPR patterns with arrows on the chart. Visual Signals:   Green and red arrows indicate the optimal points for buying and selling, respectively. Ar
FREE
Fibomathe for MT4
Almaquio Ferreira De Souza Junior
Fibomathe Indicator: Support and Resistance Tool for MT4 The Fibomathe Indicator is a technical analysis tool designed for MetaTrader 4 (MT4) that assists traders in identifying support and resistance levels, take-profit zones, and additional price projection areas. It is suitable for traders who use structured approaches to analyze price action and manage trades. Key Features Support and Resistance Levels: Allows users to define and adjust support and resistance levels directly on the chart. L
FREE
Vanexio
Sayan Vandenhout
VANEXIO USES THE TREND WAVE INDICATOR AND IT CAN IDENTIFY THE BEGINNING AND THE END OF A NEW WAVE TREND MOVEMENT. AS AN OSCILLATOR, THE INDICATOR IDENTIFIES THE OVERBOUGHT AND OVERSOLD ZONES. IT WORKS GREAT TO CATCH THE SHORT TERM PRICE REVERSALS AND USES A MARTINGALE STRATEGY TO CLOSE ALL TRADES IN PROFIT. USE DEFAULT SETTINGS ON H1 OR HIGHER TIME FRAME ON ANY PAIR FOR MORE ACCURATE TRADES WHY THIS EA : Smart entries calculated by 5 great strategies The EA can be run on even a $20000 acco
FREE
PZ Pivot Points
PZ TRADING SLU
4.6 (10)
This indicator displays pivot points in the chart, including historical vales, and supports many calculation modes for Pivot Points and S/R levels. [ Installation Guide | Update Guide | Troubleshooting | FAQ | All Products  |  Get Help ] It plots historical levels for backtesting purposes It allows you to select the reference timeframe It implements different Pivot Point calculation modes It implements different SR calculation modes It implements customizable colors and sizes Calculation Mode
FREE
ZigZag Support Resistance MT4
Emmanuel Tshepang Mosweu
4.67 (3)
This indicator uses the Zigzag indicator to identify swing highs and swing lows in the price chart.    Once it has identified the swing highs and swing lows, it can use them to determine potential support and resistance levels. A support level is formed when the price drops and bounces back up from a swing low, indicating that there is buying pressure at that level. A resistance level is formed when the price rises and reverses downward from a swing high, suggesting selling pressure at that leve
FREE
Shadow Flare MT4
Kestutis Balciunas
Shadow Flare 인디케이터는 MetaTrader 4용 비리페인트형 추세 & 유동성 도구 입니다. 설정 가능한 이동평균 베이스라인(HMA, EMA, SMA 또는 RMA)을 계산하고, 그 주변에 평균진폭범위(ATR) 기반 밴드를 씌워 가격이 상단 또는 하단 밴드를 종가 기준으로 돌파할 때에만 방향이 전환되는 “점착형(Sticky)” 추세 상태를 생성합니다. 동일한 추세 엔진은 피벗 고점·저점을 감지하여 그 주위에 색상 박스를 그린 뒤, 가격이 종가 기준으로 해당 박스를 돌파하는 순간 자동으로 존을 소거(미티게이션)하는 공급/수요 존 모듈도 구동합니다. 매수·매도 신호는 추세 상태가 전환되는 시점에 발생하며, 선택적인 거래량 및 RSI 필터를 통해 약한 신호나 모멘텀에 역행하는 진입을 차단할 수 있습니다. 내장 대시보드는 실시간으로 Trend Bias(추세 바이어스), Momentum(RSI 기반), Volume(거래량)을 보여 줍니다. 팝업, 사운드, 모바일 푸시, 이메일로 구성
FREE
이 제품의 구매자들이 또한 구매함
Trend SniperX MT4
Sarvarbek Abduvoxobov
5 (5)
Trend Sniper X 는 트레이더가 명확하고 정확하게 트렌드 방향과 잠재적 반전 지점을 포착할 수 있도록 돕는 MetaTrader 5 전용 멀티 타임프레임 추세 추종 지표입니다. MT5 버전 링크: https://www.mql5.com/en/market/product/181101 가격 안내: 현재 가격은 프로모션 할인가이며, 향후 업데이트 및 새 기능 출시 시 인상될 수 있습니다. Code2Profit 채널 멀티 타임프레임 분석으로 시장을 정복하세요! Trend Sniper X로 승률을 극대화하는 방법: 핵심 규칙 및 세션 팁 기술 사양 플랫폼 MetaTrader 5 지표 유형 멀티 타임프레임 추세 지표 작동 타임프레임 모든 차트 타임프레임 (상위 타임프레임 M1–MN1 독립 선택 가능) 주요 종목 외환(Forex), 골드(XAUUSD) 및 기타 CFD 추천 계좌 모든 계좌 유형 시각화 컬러 추세 캔들 (매수/매도/약세/변화) + 매수/매도 화살표 추가 모듈 세션 마켓 박스 (
Zoryk Gold mt4
Reda El Koutbane
5 (3)
ZORYK — MetaTrader 4용 XAUUSD 전문 신호 및 트레이드 플래닝 시스템 이런 경험이 있을 것입니다. 골드를 분석하고 진입을 기다린 뒤 마침내 포지션을 열었지만 가격이 곧바로 반대 방향으로 움직입니다. 너무 일찍 청산하거나 Stop Loss를 옮기거나 몇 초 동안 망설입니다. 그 후 시장은 내가 없이도 처음 예상했던 목표까지 정확히 움직입니다. 문제는 항상 방향이 아니었습니다. 진짜 문제는 불확실성이었습니다. 정확한 진입 위치를 몰랐습니다. 어느 지점에서 원래의 트레이드 아이디어가 무효가 되는지 몰랐습니다. 가까운 수익을 확보해야 할지 더 큰 움직임을 기다려야 할지 판단하기 어려웠습니다. 현재 setup이 정말 강한지 아니면 단지 새로운 거래를 억지로 찾고 있는지도 확신하기 어려웠습니다. 골드는 매우 빠르게 움직입니다. 명확한 계획이 없다면 좋은 분석도 몇 초 만에 나쁜 결정으로 바뀔 수 있습니다. ZORYK는 이 문제를 해결하기 위해 개발되었습니다.
AW Prime Oscillator
AW Trading Software Limited
5 (1)
두 개의 오실레이터의 조합. 첫 번째 항목은 진입점을 표시하고 두 번째 항목은 현재 추세를 표시합니다. 표시기는 두 가지 모드의 화살표로 오실레이터 신호를 표시할 수 있습니다. 모든 빠른 오실레이터 신호 또는 현재 추세 방향의 신호만 표시할 수 있습니다. 다중 시간대 패널과 세 가지 유형의 신호 알림이 있습니다. 이익: 일일 및 스캘핑 거래에 적합 추세 필터링 간단하고 민감한 설정 다중 시간대 패널 Advisor에 통합하는 데 적합합니다. 모든 기호 및 기간에서 작동합니다. 세 가지 유형의 알림 MT5 version ->  HERE  / Problem solving ->  HERE 지표 전략 표시기는 두 개의 서로 다른 오실레이터로 구성됩니다. 느린 추세선(두꺼움) - 지표의 고수준이 위에서 아래로 교차하면 하락세 지표이고, 낮은 수평 수준(지표의 낮은 수준)이 아래에서 위로 교차하면 하락 추세 지표입니다. 상승 경향. 또한, 하단 영역에서 느린 선을 발견하면 현재 추세가 하락세임을
Super Signal – Skyblade Edition 전문가용 노리페인트 / 노래그 트렌드 신호 시스템, 뛰어난 승률 제공 | MT4 / MT5용 1분, 5분, 15분과 같은 낮은 타임프레임에서 가장 좋은 성능을 보입니다. 핵심 기능: Super Signal – Skyblade Edition은 추세 매매를 위해 설계된 스마트 신호 시스템입니다. 이 시스템은 다중 필터 로직을 활용하여, 명확한 방향성과 실질적인 모멘텀이 수반된 고품질 추세만을 감지합니다. 이 시스템은 고점 또는 저점을 예측하지 않으며 , 다음 세 가지 조건이 모두 충족될 때만 신호를 발생시킵니다: 명확한 추세 방향 강화되는 모멘텀 건전한 변동성 구조 또한, 시장 세션 기반의 유동성 분석을 통해 신호의 신뢰성과 타이밍을 더욱 향상시킵니다. 신호 특성: 모든 화살표 신호는 100% 리페인트 없음 / 지연 없음 신호가 한 번 발생하면 고정되며, 깜빡이거나 사라지지 않음 차트 상의 시각적 화살표, 정보 패널, 팝업 알
Liquidity Scalper System
Stanislav Konin
5 (1)
Liquidity Scalper System: 인디케이터 형식의 유동성 기반 트레이딩 시스템입니다. 대부분의 인디케이터는 화살표만 보여주고, 손절을 어디에 둘지, 목표가 어디인지, 신호를 믿어도 되는지는 트레이더가 스스로 판단해야 합니다. Liquidity Scalper System은 거래의 전체 주기를 다룹니다. 유동성 풀을 찾고, 돌파 시 신호를 주며, Entry, Stop Loss와 세 개의 목표를 즉시 계산하고, 패널에 통계와 새로운 데이터에 대한 검증 결과를 표시합니다. 설정은 시스템이 스스로 선택하고 매일 업데이트합니다. 작동 방식 1. 시스템이 유동성 풀을 찾습니다. 시장 참여자들의 스톱 주문이 쌓여 있는 레벨입니다. 2. 가격이 풀을 돌파하고 그 돌파가 움직임의 강도(필요 시 거래량)로 확인되면 차트에 BUY 또는 SELL 화살표가 나타납니다. 3. Entry, Stop Loss, TP1, TP2, TP3 레벨이 영역 채우기와 함께 즉시 그려집니다. 4. 오른쪽에 유
Atomic Analyst
Issam Kassas
5 (14)
Atomic Analyst — MetaTrader 4 제품 문의, 설정 안내 또는 기술 지원이 필요하면 MQL5에서 직접 메시지를 보내 주세요. 이 인디케이터는 복잡한 시장 계산을 단순한 시각적 신호, 색상 표시 캔들, 추세 판독, 손절 레벨 및 여러 익절 구간으로 변환하여 트레이더가 빠르게 이해하고 실제 시장 상황에서 사용할 수 있게 합니다. 주요 거래 용도: 스캘핑 및 인트라데이 거래: 빠른 의사결정, 명확한 화살표, 알림, 캔들 색상 및 구조화된 진입/청산 구간을 위해 설계되었습니다. 데이 트레이딩 및 스윙 트레이딩: 추세 방향, 강도, 모멘텀 및 다중 시간대 분석을 사용하여 더 큰 시장 움직임을 따라갈 수 있도록 돕습니다. 주요 기능: • Price Action, 강도 및 모멘텀 분석 • 다중 시간대 추세 스캐너 • 전체 추세 비율 계산 • 매수 및 매도 화살표 • 손절 및 여러 익절 레벨 • 최대 5개의 피보나치 기반 익절 레벨 • 트레일링 스톱 로직 • 추세 및 모멘텀
Smart Trend Trading System
Issam Kassas
4.8 (10)
Smart Trend Trading System은 추세 정보, 진입·청산 신호, 가격 수준을 하나의 차트에 표시하는 MetaTrader 4용 지표입니다. 이 시스템은 추세 감지, 반전 구간, Smart Cloud, 트레일링 스톱 로직, 지지와 저항, 캔들 색상 표시, 알림, 다중 시간대 분석 등 10개 이상의 트레이딩 도구 를 하나의 시스템으로 결합합니다. 이 시스템은 다양한 시장 상황에서 거래를 돕도록 설계되었습니다: 추세장: 주요 추세를 식별하고, 되돌림을 감지하며, 모멘텀을 따라가고, 손절 가이드와 트레일링 스톱 옵션을 사용해 더 깔끔한 진입 지점을 찾습니다. 횡보장: 박스권 시장 상황을 감지하고, 반응 구간을 식별하며, 가격이 중요한 레벨에서 반응할 때 더 명확한 신호를 받을 수 있습니다. 스캘핑 및 인트라데이 거래: 빠른 신호, 캔들 색상, 알림, 다중 시간대 확인을 사용하여 단기 거래 결정을 지원합니다. 주요 기능: • 10개 이상의 인디케이터를 하나의 트레이딩 시스
Neuro Poseidon MT4
Daria Rezueva
4.74 (46)
Neuro Poseidon is a new indicator by Daria Rezueva. It combines precise trading signals with adaptive TP/SL levels - creating best possible trades as a result! Message me and get  Neuro Poseidon Assistant  as a gift to automize your trading process! What makes it stand out? 1. Proven profitability on all assets and timeframes 2. Only confirmed BUY and SELL signals present on the chart 3. Adaptive TP & SL levels generated by the software for each trade 4. Easy to understand - suitable for all
Tokyo mt4 Indicator
Vasiliy Strukov
5 (9)
Tokyo Indicator는 추세 방향, 잠재적 거래 신호 및 시장 상황을 명확하고 시각적으로 보여줍니다. 색상으로 구분된 계단식 추세선은 강세 구간(파란색)과 약세 구간(자홍색)을 명확히 구별해 줍니다. 추세가 전환될 때 나타나는 방향성 화살표는 잠재적인 매수 및 매도 기회를 강조하여 보여줍니다. 통합 대시보드는 현재 신호, 시장 성향(bias), 모멘텀, 변동성, 신호 품질 등의 정보를 한눈에 파악할 수 있도록 구성되어 있습니다. 이를 통해 트레이더는 별도의 패널을 오갈 필요 없이 가격 움직임(price action)과 지표의 데이터를 동시에 분석할 수 있습니다. 깔끔한 차트 화면과 간결한 시장 개요를 제공하는 Tokyo Indicator는 체계적인 추세 분석과 거래 결정을 지원합니다. 모든 시간대와 다양한 자산(특히 금)에서 활용할 수 있습니다. 추세 방향, 잠재적 거래 신호 및 시장 상황을 명확하고 시각적으로 보여줍니다. 색상으로 구분된 계단식 추세선은 강세 구간(파란색)
현재 30% 할인 ! 초보자 또는 전문가 트레이더를 위한 최고의 솔루션! 이 대시보드 소프트웨어는 28개의 통화 쌍에서 작동합니다. 2가지 주요 지표(Advanced Currency Strength 28 및 Advanced Currency Impulse)를 기반으로 합니다. 전체 Forex 시장에 대한 훌륭한 개요를 제공합니다. 고급 통화 강도 값, 통화 이동 속도 및 모든(9) 시간대의 28 Forex 쌍에 대한 신호를 보여줍니다. 추세 및/또는 스캘핑 기회를 정확히 파악하기 위해 차트의 단일 지표를 사용하여 전체 시장을 볼 수 있을 때 거래가 어떻게 개선될지 상상해 보십시오! 잠재적인 거래를 식별하고 확인하면서 강력한 통화와 약한 통화를 더욱 쉽게 식별할 수 있도록 이 지표에 기능을 내장했습니다. 이 표시기는 통화의 강세 또는 약세가 증가 또는 감소하는지 여부와 모든 시간대에서 수행되는 방식을 그래픽으로 보여줍니다. 추가된 새로운 기능은 현재 시장 조건 변화에 적응하는
SR Liquidity
Oleg Rodin
5 (2)
SR Liquidity 는 시장 유동성이 집중되고 가격이 가장 강력하게 반응하는 숨겨진 구간을 포착하도록 설계된 트레이딩 지표입니다. 이러한 특수 유동성 구간은 강력한 지지 및 저항선 역할을 하며, 시장 반전 가능성이 가장 높은 지점을 명확하게 보여주는 지도가 되어 줍니다. SR Liquidity는 일반적인 지지 및 저항선을 단순히 그리는 대신, 실제 가격 움직임을 분석하여 매수 및 매도 압력이 집중되는 구간을 포착합니다. 이러한 구간은 실질적인 시장의 흐름을 주도하는 유동성 풀(liquidity pools)에 해당합니다. 이 지표는 해당 구간을 차트에 직접 시각화하여, 가격 반응이 실제로 나타나기 전에 이를 미리 예측할 수 있도록 돕습니다. 즉, 가격 추세가 전환될 가능성을 사전에 파악하게 해주는 것입니다. 결과적으로 이 지표는 가공되지 않은 가격 움직임(price action)을 시장의 핵심 가격대, 다시 말해 추세 전환점이 될 수 있는 지점들을 보여주는 명확하고 실용적인 로드맵
CRT Candle Range Theory HTF MT4 - Ultimate CRT Indicator: 고급 ICT 개념 및 Malaysian SnR 트레이딩 시스템 가장 진보된 Candle Range Theory 지표로 마켓 메이커의 발자취를 마스터하십시오. Ultimate CRT Indicator를 사용하여 Smart Money Concepts(SMC)의 진정한 힘을 발휘하고 기관처럼 정확하게 거래하십시오. 진지한 트레이더를 위해 독점적으로 제작된 이 지표는 ICT Concepts(Inner Circle Trader)의 핵심 기둥인 매우 효과적인 Candle Range Theory(CRT)를 자동화하고 Malaysian Support and Resistance(SnR) 진입 방법과 FVG(Imbalance) 영역의 치명적인 정밀도로 이를 강화합니다. MT4 또는 MT5에서 Forex, Crypto 또는 지수를 거래하든 이 알고리즘은 시장 소음을 제거하고 가짜 돌파(fakeout)
M1 Sniper
Oleg Rodin
4.97 (30)
M1 SNIPER 는 사용하기 쉬운 거래 지표 시스템입니다. M1 시간대에 맞춰 설계된 화살표 지표입니다. 이 지표는 M1 시간대 스캘핑을 위한 단독 시스템으로 사용할 수 있으며, 기존 거래 시스템의 일부로도 사용할 수 있습니다. 이 거래 시스템은 M1 시간대 거래용으로 특별히 설계되었지만, 다른 시간대에도 사용할 수 있습니다. 원래는 XAUUSD와 BTCUSD 거래를 위해 이 방법을 설계했지만, 다른 시장 거래에도 유용하다는 것을 알게 되었습니다. 이 지표의 신호는 추세 방향과 반대로 거래될 수 있습니다. 저는 지표의 신호를 활용하여 양방향으로 거래할 수 있도록 돕는 특별한 거래 기법을 알려드립니다. 이 방법은 특별한 동적 지지선과 저항선 가격 영역을 활용하는 것을 기반으로 합니다. 구매하시면 M1 SNIPER 화살표 지표를 바로 다운로드하실 수 있습니다. 또한, 아래 스크린샷에 표시된 Apollo Dynamic SR 지표는 M1 SNIPER 도구를 사용하는 모든 사용자에게 무료로
Top Bottom Tracker MT4
Rodrigo Arana Garcia
탑 바텀 트래커는 시장 추세를 분석하고 추세의 고점과 저점을 감지할 수 있는 정교한 알고리즘을 기반으로 하는 지표입니다 / MT5 버전 . 가격은 500$에 도달할 때까지 점진적으로 상승합니다. 다음 가격 --> $99 특징 다시 칠하지 않음 이 표시기는 새 데이터가 도착해도 값을 변경하지 않습니다 거래 쌍 모든 외환 쌍 기간 모든 기간 파라미터 ==== 인디케이터 구성 ==== 구성 매개 변수 // 40 (값이 높을수록 신호가 적지만 더 정확한 신호가 제공됩니다) 상위 레벨 값 // 80 (상단 수평선의 값) 하단 레벨 값 // 20 (하단 수평선 값) 인디케이터 계산 막대 수 // 3000 (인디케이터를 계산할 막대 수). 값 0은 모든 막대에 대해 인디케이터를 계산합니다) ==== 알람 구성 ==== 팝업 알림 // 참(터미널에서 알람) 이메일 알림 // 참(이메일로 알람 전송) 알람 시간 간격 // 10 (분 단위의 알람 간격) 경고
Advanced Supply Demand
Bernhard Schweigert
4.91 (302)
현재 30% 할인! 초보자나 전문 트레이더를 위한 최고의 솔루션! 이 보조지표는 우리가 다수의 독창적 기능과 새로운 공식을 통합한 독특하고 고품질이며 저렴한 거래 도구입니다. 이 업데이트를 통해 이중 시간대를 표시할 수 있습니다. 더 높은 TF를 표시할 수 있을 뿐만 아니라 차트 TF와 더 높은 TF 모두를 표시할 수 있습니다: 중첩 영역 표시. 모든 Supply Demand 트레이더들이 좋아할 것입니다. :) 중요한 정보 공개 Advanced Supply Demand의 잠재력을 극대화하려면 다음을 방문하십시오. https://www.mql5.com/ko/blogs/post/720245   진입 또는 목표의 명확한 트리거 포인트를 정확히 찾아냄으로 해서 거래가 어떻게 개선될지 상상해 보십시오. 새로운 알고리즘을 기반으로 매수자와 매도자 간의 잠재적인 불균형을 훨씬 더 쉽게 분간할 수 있습니다. 왜냐하면 가장 강한 공급영역과 가장 강한 수요 영역과 과거에 어떻게 진행 되었는지를(이전
Cycles Predictor
Martin Eshleman
Cycles Predictor Indicator This indicator uses past market cycles to predict future price movements. The indicator scans through past data and considers  combinations  of cycles. When cycles  coincide  at the same future date/time then it is considered a valid future prediction. The predictions are drawn as vertical lines on the right side of the chart in the future. A prediction will often result in type of candle (ex. bull or bear) and/or a reversal point (ex. bottom or top) forming at this ex
Break and Retest Hunter MT4 is a powerful MetaTrader 5 indicator designed to automatically identify support and resistance levels, breakout structures, and potential retest opportunities in real time. Bonus Indicator: After purchasing Break and Retest Hunter , contact me to receive Trade Indicator Assistant EA completely free as a bonus utility. $65 for the next 10 copies . Next price is $120.  Combining adaptive market analysis, clear BUY/SELL signals, Fibonacci-based profit targets, and a pre
PRO Renko System
Oleg Rodin
5 (31)
PRO Renko System 은 RENKO 차트 거래를 위해 특별히 고안된 매우 정확한 거래 시스템입니다. 이것은 다양한 거래 상품에 적용될 수있는 보편적 인 시스템입니다. 체계는 효과적으로 당신에게 정확한 반전 신호에 접근을 주는 소위 시장 소음을 중화합니다. 이 표시기는 사용하기가 매우 쉽고 신호 생성을 담당하는 매개 변수가 하나만 있습니다. 당신은 쉽게 당신의 선택의 어떤 무역 계기에 공구를 적응시킬 수 있고 renko 막대기의 크기. 나는 항상 당신이 내 소프트웨어로 수익성있게 거래 할 수 있도록 추가 지원을 제공 할 준비가되어 있습니다! 나는 당신에게 행복하고 수익성있는 거래를 기원합니다! 구매 후 저에게 연락하십시오! 내 렌코 차트 생성기를 보내드립니다. 또한 내 개인 권장 사항 및 시스템의 다른 모듈을 무료로 공유 할 것입니다!
ForexTrendMT4
Andriy Sydoruk
5 (1)
ForexTrendMT4 Indicator: A Reliable Tool for Market Tracking The ForexTrendMT4 indicator offers reliable market trend tracking, filtering out sudden fluctuations and market noise. This tool helps identify trends and signals favorable entry points into the market using arrows. It is suitable for both scalping on shorter timeframes and long-term trading strategies. Based on the principles of technical analysis, ForexTrendMT4 takes into account the cyclical nature of the market. Key Features and A
CRT Multi-Timeframe Market Structure & Liquidity Sweep Indicator Non-Repainting | Multi-Asset | MT5 Version Available MT5 Version:   https://www.mql5.com/en/market/product/162075 Full User Guide — explains what each feature does and why:   https://www.mql5.com/en/blogs/post/767525 Quick Start User Guide  — explains how to configure and in what order:  https://www.mql5.com/en/blogs/post/767540 Indicator Overview CRT Ghost Candle HTF Fractal is a complete institutional-grade market structure too
KT Parabolic RSI MT4
KEENBASE SOFTWARE SOLUTIONS
KT Parabolic RSI overlays Parabolic SAR directly on the RSI line to highlight likely market turning points. Classic RSI overbought and oversold readings already hint at reversals, and the added PSAR filter removes much of the noise and sharpens those signals, giving you clearer trade setups. Big Square Signals: A Parabolic SAR flip on an RSI that sits in overbought or oversold territory. These mark high-probability market turns. Small Square Signals: A SAR flip inside the neutral RSI band. Treat
Currency Strength Wizard
Oleg Rodin
4.85 (61)
통화 강도 마법사는 성공적인 거래를 위한 올인원 솔루션을 제공하는 매우 강력한 지표입니다. 표시기는 여러 시간 프레임의 모든 통화 데이터를 사용하여 이 또는 해당 외환 쌍의 힘을 계산합니다. 이 데이터는 특정 통화의 힘을 확인하는 데 사용할 수 있는 사용하기 쉬운 통화 지수 및 통화 전력선의 형태로 표시됩니다. 필요한 것은 거래하려는 차트에 표시기를 부착하는 것뿐입니다. 표시기는 거래하는 통화의 실제 강세를 보여줍니다. 지표는 또한 추세와 거래할 때 유리하게 사용할 수 있는 구매 및 판매 거래량 압력의 극한값을 보여줍니다. 지표는 또한 피보나치에 기반한 가능한 대상을 보여줍니다. 표시기는 PUSH 알림을 포함한 모든 유형의 알림을 제공합니다. 구매 후 연락주세요. 나는 당신과 거래 팁을 공유하고 당신에게 무료로 훌륭한 보너스 지표를 줄 것입니다! 나는 당신에게 행복하고 유익한 거래를 기원합니다!
Advanced Currency Strength28 Indicator
Bernhard Schweigert
4.91 (659)
현재 40% 할인 초보자 또는 전문가 트레이더를 위한 최고의 솔루션! 이 지표는 우리가 독점 기능과 새로운 공식을 통합했기 때문에 독특하고 고품질이며 저렴한 거래 도구입니다. 단 하나의 차트로 28 Forex 쌍의 통화 강도를 읽을 수 있습니다! 새로운 추세 또는 스캘핑 기회의 정확한 트리거 포인트를 정확히 찾아낼 수 있기 때문에 거래가 어떻게 개선될지 상상해 보십시오. 사용 설명서: 여기를 클릭  https://www.mql5.com/en/blogs/post/697384 그것이 첫 번째, 원본입니다! 쓸모없는 지망생 클론을 사지 마십시오. 더 스페셜  강력한 통화 모멘텀을 보여주는 하위 창의 화살표 GAP가 거래를 안내합니다! 기본 또는 호가 통화가 과매도/과매도 영역(외부 시장 피보나치 수준)에 있을 때 개별 차트의 기본 창에 경고 표시가 나타납니다. 통화 강도가 외부 범위에서 떨어질 때 풀백/반전 경고. 교차 패턴의 특별 경고 추세를 빠르게 볼 수 있는 다중 시간
Volume Orderflow Profile
Suvashish Halder
5 (2)
Introducing Volume Orderflow Profile , a versatile tool designed to help traders visualize and understand the dynamics of buying and selling pressure within a specified lookback period. Perfect for those looking to gain deeper insights into volume-based market behavior! MT5 Version -  https://www.mql5.com/en/market/product/122657 The indicator gathers data on high and low prices, along with buy and sell volumes, over a user-defined period. It calculates the maximum and minimum prices during this
화살표는 사라고만 말합니다. Obsidian Scalper Pro는 어디서 사는지, 손절이 어디로 가는지, 세 개의 목표가 어디인지, 당신의 리스크에 맞는 포지션 크기가 얼마인지, 그리고 그 셋업이 100점 만점에 몇 점인지까지 말합니다. 모든 시그널은 차트에 그려진 완성된 매매 플랜으로 도착하고, 내장된 통계 창이 최근 백 개의 정직한 결과를 신뢰구간이 붙은 승률까지 포함해 보여줍니다. 모든 결정은 마감된 봉에서 내려지므로, 지금 보고 있는 히스토리가 곧 당신이 실제로 거래했을 히스토리입니다. 이 지표는 금(XAUUSD) M30에서 가장 좋은 성능을 보이며, 다른 어떤 심볼과 타임프레임에서도 사용할 수 있습니다. 이 지표에 맞는 전략이 필요하신가요? 구매 후 MQL5에서 메시지를 보내주시면 보내드리겠습니다. 무엇을 하는가 Obsidian Scalper Pro는 확립된 추세 안의 되돌림 진입을 찾아 각각에 대해 완성된 플랜을 건네줍니다. Entry, SL, TP1, TP2와 선택형
UR TrendExhaustion
Krzysztof Jan Debski
UR 트렌드소진   UR TrendExhaustion은 매개 변수 값이나 기타 설정을 다루고 싶지 않은 트레이더를 위한 최고의 솔루션입니다. 모든 사람이 쉽고 시각적으로 이해할 수 있습니다. UR TrendExhaustion 사용의 이점: 매개변수 없음 차트에서 진행되는 상황을 가장 잘 설명하는 3개의 선이 있습니다: Trend Exhaustion Line, Whale Money Line 및 Retail Money Line. 인터페이스는 양쪽 극단(빨간색 영역)에서 어느 한 라인의 소진을 보여줍니다. 최고의 장점: 쉽고 모든 자산에 맞게 조정됩니다. 도구 업데이트를 최신 상태로 유지하고 빠진 것이 있다고 생각되면 요청을 보낼 수 있는 특별한 텔레그램 채팅이 있습니다! 왜 UR TrendExhaustion인가? 나는 내 경력 전반에 걸쳐 많은 종류의 지표를 코딩해 왔으며 차트에서 다른 도구 없이도 거래할 수 있는 이 간단하면서도 최고의 (imo) 도구를 코딩하기 위해 모든
This indicator works on MT4 and is very easy to use. When you receive a signal from it, you wait for that candle with the signal to close and you enter your trade at the beginning of the next new candle . A red arrow means sell and a green arrow means buy. All arrows comes with Alert  like for easy identification of trade signal. Are you okay with that? 1 minute candle 1 minute expire
This is a professional chart indicator designed for traders focused on stability and clear price action. It helps filter market noise and provides clear visual entry and exit zones for your trading decisions. Core Features: Strictly Non-Repainting: The system is built with strict non-repaint logic. What you see on the chart is the true historical performance. Confirmed Signals: Signals are triggered and confirmed only after the candle closes . Once a trading arrow appears on a closed candle, it
GoldRush Trend Arrow Signal
Kirk Lee Holloway
5 (2)
GoldRush 트렌드 화살표 신호 GoldRush 트렌드 화살표 신호 지표는 XAU/USD 시장에서 고속 단기 스캘핑 트레이더를 위해 설계된 정밀한 실시간 트렌드 분석을 제공합니다. 1분 시간대에 특화되어 설계된 이 도구는 명확한 진입점을 표시하는 방향성 화살표를 제공하여 스캘퍼들이 변동성이 높은 시장 환경에서도 자신 있게 거래할 수 있도록 합니다. 이 지표는 PRIMARY 및 SECONDARY 경고 화살표로 구성됩니다. PRIMARY 신호는 추세 방향의 변화를 나타내는 흰색과 검은색 방향성 화살표이며, SECONDARY 신호는 PRIMARY 화살표가 지시하는 방향을 확인하고 잠재적인 거래 진입점을 표시하는 파란색과 빨간색 화살표입니다. 참고: 추세 방향이 변경된 후 PRIMARY 경고 화살표가 단 하나만 표시될 경우, 다수의 SECONDARY 파란색/빨간색 화살표가 표시될 수 있음을 유의해야 합니다. SECONDARY 신호는 신호 기준을 충족하는 어떤 캔들 이후에도 표시
Scalper Vault
Oleg Rodin
5 (40)
Scalper Vault는 당일 매매(intraday trading)에서 일관된 성과를 내고자 하는 트레이더를 위해 설계된, 강력하고 모든 기능을 갖춘 트레이딩 시스템입니다. 이 고정밀 지표는 외환(Forex) 및 바이너리 옵션 트레이더 모두에게 기관급 분석을 제공하는 독립적인 종합 트레이딩 시스템 역할을 합니다. 구매 후 저에게 연락해 주시면, 트레이딩 팁과 함께 특별한 보너스를 제공해 드립니다! Scalper Vault는 추측에 의존하거나 복잡한 수동 분석을 할 필요를 없애주며, 사용하기 쉬운 트레이딩 기법을 통해 오직 매매 실행에만 집중할 수 있도록 돕습니다. 정확한 추세 추종 신호: 핵심 알고리즘이 시장 구조를 분석하여, 지배적인 시장 추세 방향과 일치하는 고확률 신호만을 제공함으로써 잘못된 진입을 획기적으로 줄여줍니다. 정밀한 고점 및 저점 탐지: 시장의 움직임이 소진되는 지점을 스캔하여 잠재적인 반전 구간을 식별합니다. 간(Gann) 이론 기반의 매수/매도 구간: 수학적
제작자의 제품 더 보기
Product Overview Pattern Recognition Master System is a main‑chart classic candlestick pattern auto‑recognition indicator designed for both the   MT4 and MT5   platforms. It automatically detects and labels eleven classic reversal and continuation patterns on the main chart, covering double tops and bottoms, head‑and‑shoulders tops and bottoms, hammer and hanging man, engulfing, doji, and morning and evening stars, with an independent cooldown period assigned to each pattern category to suppres
FREE
Product Overview Dual Swing Breakout System is a dual swing breakout state machine main chart indicator designed specifically for both   MT4 and MT5   platforms. By constructing two completely independent fast and slow swing high/low tracking systems, it transforms market structure into a clear state machine model. When price breaks key swing extremes, the system changes the state line color and triggers trading signals. This indicator helps traders filter market noise, precisely identify short
FREE
Product Overview Pyramiding Entry Master is a main‑chart moving‑average trend‑following and pyramiding‑entry indicator designed for both the   MT4 and MT5   platforms. It draws a four‑period moving‑average system (MA5, MA10, MA20, MA60) on the main chart and, based on a 55‑period trend‑momentum model, volume‑expansion confirmation, and multiple oversold conditions, automatically generates three types of buy signals: Chase (halfway momentum entry), Add (next‑day pyramiding), and Dip Buy (deep‑ov
FREE
Product Overview Dynamic Fibonacci Deviation is an adaptive Fibonacci levels main chart indicator designed specifically for both   MT4 and MT5   platforms. It innovatively combines EMA dynamic midline, standard deviation volatility, and Fibonacci ratios to construct an intelligent support/resistance system that automatically expands and contracts with market volatility. Through overbought/oversold recognition and fall back/bounce signals, this indicator helps traders accurately capture high-pro
FREE
Product Overview TD Sequential Pro is a TD Sequential main chart indicator designed specifically for both   MT4 and MT5   platforms, deeply developed based on the classic Tom DeMark Sequential theory. By statistically analyzing the comparison relationship between 9 consecutive bars' closing prices and their 4 preceding bars, this indicator precisely identifies market momentum exhaustion points. It helps traders capture high-probability reversal opportunities at trend ends, while providing compr
FREE
Product Overview Dynamic Fibonacci Deviation is an adaptive Fibonacci levels main chart indicator designed specifically for both   MT4 and MT5   platforms. It innovatively combines EMA dynamic midline, standard deviation volatility, and Fibonacci ratios to construct an intelligent support/resistance system that automatically expands and contracts with market volatility. Through overbought/oversold recognition and fall back/bounce signals, this indicator helps traders accurately capture high-pro
FREE
Product Overview Pyramiding Entry Master is a main‑chart moving‑average trend‑following and pyramiding‑entry indicator designed for both the   MT4 and MT5   platforms. It draws a four‑period moving‑average system (MA5, MA10, MA20, MA60) on the main chart and, based on a 55‑period trend‑momentum model, volume‑expansion confirmation, and multiple oversold conditions, automatically generates three types of buy signals: Chase (halfway momentum entry), Add (next‑day pyramiding), and Dip Buy (deep‑ov
FREE
Product Overview Bottom Picker Pro is a bull/bear wave sub-window indicator designed specifically for both   MT4 and MT5   platforms. By integrating multi-period extreme value algorithms with multiple smoothing techniques, it constructs a highly responsive bull/bear trend line and wave tracking system. This indicator precisely identifies momentum reversals in extremely overbought and oversold zones, providing clear bottom-picking, top-escaping, and trend-pullback signals, helping traders accura
Dynamic Trend Follower Main Chart Indicator Deep Analysis: Dual MA Color Change + Cross Markers + Buy/Sell Signals + Trend Reversal + Strong Cross Indicator Overview Dynamic Trend Follower is a premium main chart moving average crossover composite signal indicator designed exclusively for the   MT4 、5platform . It breaks through the limitations of traditional single moving averages or simple crossovers by integrating a   Dual MA Trend Color Change System ,   Cross "+" Markers with Spread Percen
FREE
Product Overview Dual Swing Breakout System is a dual swing breakout state machine main chart indicator designed specifically for both   MT4 and MT5   platforms. By constructing two completely independent fast and slow swing high/low tracking systems, it transforms market structure into a clear state machine model. When price breaks key swing extremes, the system changes the state line color and triggers trading signals. This indicator helps traders filter market noise, precisely identify short
FREE
Product Overview Liquidity Pool Hunter is a liquidity pool main chart indicator designed specifically for both   MT4 and MT5   platforms. Based on institutional order flow theory, it constructs liquidity accumulation zones by statistically analyzing recent highs and lows, precisely identifying sweep, fake break, and true break behaviors in the market. This indicator helps traders view the market from an institutional perspective, recognizing smart money liquidity hunting behavior, thereby captu
Smart Divergence Finder Indicator In-depth Analysis: A Practical Guide to Trend, Divergence, and Resonance Indicator Introduction Smart Divergence Finder is an intelligent main-chart comprehensive indicator designed for MT4/MT5 platforms. It overcomes the fragmented limitations of traditional sub-chart divergence analysis by integrating: Trend determination Multi-indicator divergence detection Intelligent signal filtering All key trading signals are displayed directly on the price chart. Its co
Gap Up Hunter
You Long Guo
Reasonable Indicators, Reasonable Prices 1. Core Functions   Multi-Period Resonance : Uses   13, 34, 55   period KDJ for signal filtering.   Gap Up Capture : Identifies   Gap Up   patterns for strong start entries.   Reversal Warning : Predicts tops/bottoms using   J-value   sensitivity. 2. Signal Description   Buy Signal 1: UP (Gap Up) Displays white   “UP”   text. Indicates a   Gap Up   bullish candle above   MA5 . Shows strong   bullish power , suitable for   trend following .
FREE
Dynamic Trend Follower Main Chart Indicator Deep Analysis: Dual MA Color Change + Cross Markers + Buy/Sell Signals + Trend Reversal + Strong Cross Indicator Overview Dynamic Trend Follower is a premium main chart moving average crossover composite signal indicator designed exclusively for the   MT4 platform . It breaks through the limitations of traditional single moving averages or simple crossovers by integrating a   Dual MA Trend Color Change System ,   Cross "+" Markers with Spread Percenta
FREE
Smart Divergence Finder Indicator In-depth Analysis: A Practical Guide to Trend, Divergence, and Resonance Indicator Introduction Smart Divergence Finder is an intelligent main-chart comprehensive indicator designed for MT4/MT5 platforms. It overcomes the fragmented limitations of traditional sub-chart divergence analysis by integrating: Trend determination Multi-indicator divergence detection Intelligent signal filtering All key trading signals are displayed directly on the price chart. Its co
Black Horse Finder Indicator In-depth Analysis: A Practical Guide to Trend, Support/Resistance, and Multi-Signal Trading Indicator Introduction Black Horse Finder is a comprehensive main-chart indicator designed specifically for the MT4 platform. Originating from the classic TongDaXin composite main chart logic, it breaks through the limitations of single moving averages or isolated indicators. It highly integrates trend determination, dynamic support/resistance levels, multiple buy signals (su
Channel Breakout Master: A Comprehensive Guide to Dual-Channel Trend Analysis with Weighted High-Low EMA and Trend State Identification Introduction Channel Breakout Master is an advanced chart indicator originally derived from the Tongdaxin SLTD series, specifically designed for both MT4 and MT5 platforms. This indicator transcends the limitations of traditional single Bollinger Bands or moving average channels by implementing a sophisticated dual-channel architecture combining   Weighted High-
Ultimate Signal Hub Main Chart Indicator Deep Analysis: MA60 Trend Baseline, Momentum Ignition & Multi-Layer Resonance Trading Guide Indicator Overview Ultimate Signal Hub is a premium main chart composite signal indicator designed exclusively for the   MT4/MT5 platform . It breaks through the limitations of traditional single moving averages or oscillators by integrating a multi-dimensional nested architecture comprising the   MA60 Trend Baseline ,   MACD Variant Ignition Algorithm ,   KDJ-Typ
Product Overview Bull Bear Decision Maker is an all-in-one main chart trend and reversal decision indicator designed specifically for both   MT4 and MT5   platforms. Originating from the classic NXMMA trading system, it deeply integrates Williams %R variants, KDJ, RSI, and a multiple moving average system. Through multi-dimensional algorithmic resonance, this indicator helps traders accurately identify high-probability trend-following, bottom-reversal, and top-escaping opportunities in complex
Product Overview Channel State Analyzer is a trend channel main chart indicator designed specifically for both   MT4 and MT5   platforms. It integrates linear regression slope trend lines, weighted channels, 55-period high/low monitoring, and channel state recognition. Through the combination of dynamic channels and trend lines, this indicator helps traders accurately identify trend reversals, channel breakouts, and short-term bottom opportunities in complex markets, while providing comprehensi
Product Overview Auto Trend Bands is an adaptive trend channel main chart indicator designed specifically for both   MT4 and MT5   platforms. It dynamically constructs trend channels based on linear regression algorithms and standard deviation, automatically identifying market trend direction and changing colors in real-time based on slope changes. Through channel breakout signals and strong trend markers, this indicator helps traders accurately capture trend initiation and acceleration opportu
Product Overview Color Trend Master is a multi-layer WMA smoothed trend line main chart indicator designed specifically for both   MT4 and MT5   platforms. Based on the classic MavilimW algorithm, it constructs an extremely smooth yet responsive trend-following system through 6 layers of nested Fibonacci-period Weighted Moving Average calculations. This indicator precisely identifies trend turning points and helps traders clearly grasp trend direction and momentum strength in complex markets th
Product Overview 6in1 Confluence System is a multi-indicator resonance sub-window indicator designed specifically for both   MT4 and MT5   platforms. It innovatively integrates 6 classic technical indicators—MACD, KDJ, RSI, LWR, BBI, and MTM—into a single sub-window, displaying bull/bear power comparison in real-time through a visual dot matrix. When all 6 indicators point in the same direction simultaneously, the system issues high-probability resonance signals, helping traders quickly identif
Product Overview Triple Divergence Hunter is a multi-indicator divergence detection sub-window indicator designed specifically for both   MT4 and MT5   platforms. It deeply integrates three classic momentum indicators—MACD, KDJ, and RSI—using rigorous crossover and extreme value comparison algorithms to precisely capture top and bottom divergences between price and indicators. Additionally, the indicator features a built-in custom K88/D88 momentum trend system, helping traders identify reversal
Product Overview Five Dimension Resonance System is a five-dimensional resonance trading main chart indicator designed specifically for both   MT4 and MT5   platforms. It innovatively integrates 5 independent trading systems—trend following, volatility breakout, range breakout, divergence reversal, and momentum scoring—into one unified framework. Through a strict resonance filtering mechanism, high-probability resonance entry alerts are triggered only when at least 2 out of the 5 systems simult
Product Overview Peak Valley Hunter (HZ88) is a comprehensive main chart trend-following and swing reversal indicator designed specifically for both   MT4 and MT5   platforms. By constructing a triple composite moving average system (Trade Line and Trend Line), combined with dynamic support/resistance tracking algorithms and candlestick pattern recognition technology, it provides traders with comprehensive trading signals ranging from trend confirmation and momentum explosion to local reversals
Product Overview Multi Dimensional Bottom Finder is an advanced sub-window oscillator and multi-dimensional resonance indicator designed specifically for both   MT4 and MT5   platforms. Breaking through the limitations of traditional single KDJ or RSI indicators, it constructs a highly in-depth bottom-hunting system by integrating multi-period stochastic oscillator algorithms, CCI extreme value analysis, volume anomaly detection, and bias rate recovery models. This indicator keenly captures mom
Product Overview Low Buy High Sell Radar is an all‑in‑one main‑chart trend‑following and swing‑trading indicator designed for both the   MT4 and MT5   platforms. By building a dynamic trend‑line color‑switching system and combining multi‑period oscillator algorithms (TSI and RSI), a volume‑price momentum model, and a signal‑cooldown filter, it delivers a full range of trading signals covering trend confirmation, overbought/oversold detection, and precise entry and exit. With rigorous logic, cle
Product Overview MACD Trend Visualizer System is a main‑chart MACD trend visualization and bullish/bearish switching indicator designed for both the   MT4 and MT5   platforms. It draws a four‑period moving‑average system (MA5, MA10, MA30, MA60) on the main chart, internally calculates the MACD histogram value, and fuses three conditions — MACD bullish/bearish momentum, moving‑average alignment, and price position — to automatically determine whether the current market is in a bullish or bearish
필터:
리뷰 없음
리뷰 답변