Pro Scalp Dot
- 지표
-
Andrey Kozak
 Laboratory of Automatic Systems (LAS) - more than 10 years, we have been developing, testing and programming automatic trading robots for the forex market.
 - 버전: 1.0
- 활성화: 20
Professional Indicator for Scalping, Intraday Trading and Multi-Timeframe Analysis
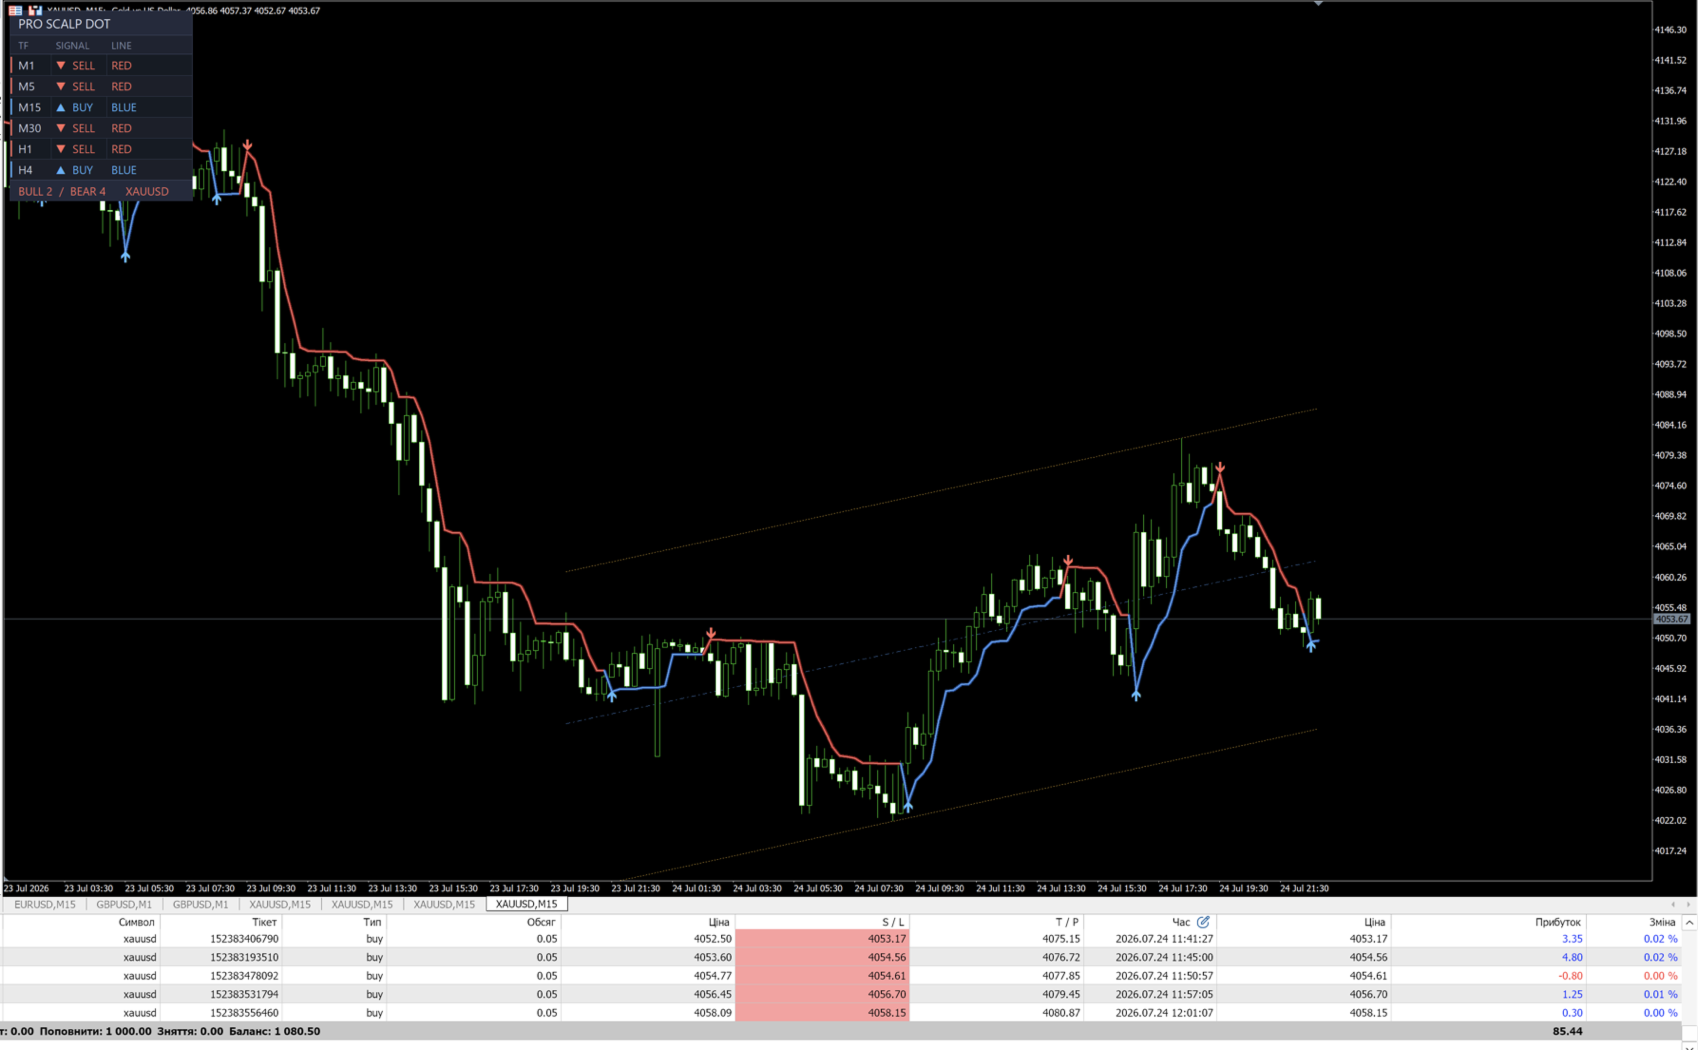
ProScalpDOT Pro is a professional trend-following indicator for MetaTrader 5, designed specifically for active traders. It combines high sensitivity to market changes, intelligent price tracking, and a powerful multi-timeframe analysis system, allowing traders to make informed decisions based on the overall market picture rather than a single chart.
Built on an advanced trend-following concept enhanced with proprietary analytical methods, ProScalpDOT Pro helps identify the beginning of new price impulses, follow existing trends, and locate high-quality entry opportunities while filtering out unnecessary market noise.
The indicator is ideal for:
- Scalping
- Intraday trading
- Trend-following strategies
- Trading after pullbacks
- Position management
- Multi-timeframe market analysis
Intelligent Trend Line
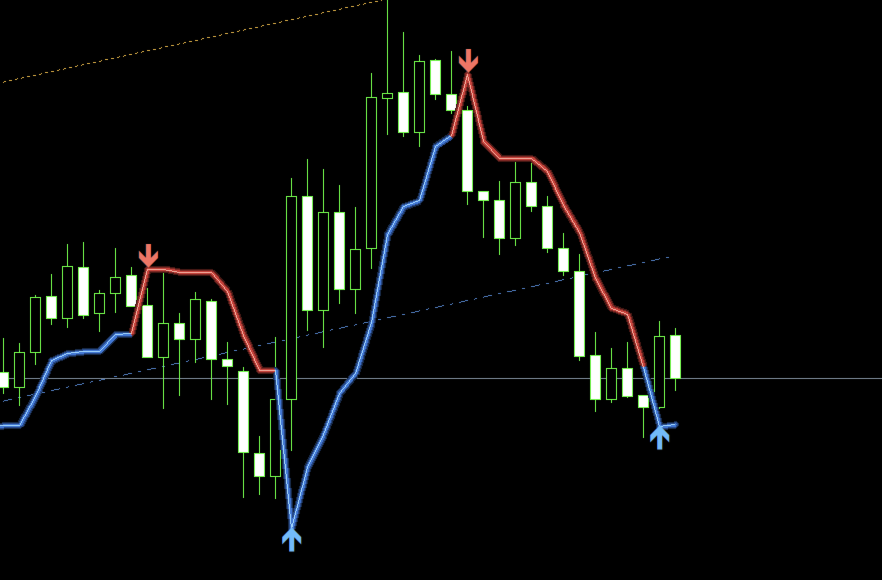
The main trend line dynamically follows market price, making it easy to identify the current market direction.
Whenever the market changes direction, the line automatically switches its position and color, providing a clear visual representation of the current trend without requiring additional analysis.
Unlike traditional trend indicators, the line offers a smooth appearance while maintaining a fast response to changing market conditions.
Buy and Sell Signals
Whenever a new trend begins, the indicator generates Buy and Sell arrows.
These signals help traders identify the start of new price impulses and can be used either as standalone entry signals or as additional confirmation within an existing trading strategy.
The signals are particularly effective after market pullbacks and corrections.
Dynamic Trend Channel
One of the unique features of ProScalpDOT Pro is its built-in trend channel.
The channel is calculated using the most recent price bars and helps traders:
- Identify the dominant market direction
- Evaluate trend strength
- Understand the current price position within the trend
- Distinguish trending markets from ranging conditions
- Use the channel as an additional trade filter
This provides a fast and convenient overview of market structure without requiring additional technical analysis tools.
A compact information panel is displayed in the upper-left corner of the chart, showing the indicator status across multiple timeframes simultaneously.
The panel displays information for:
- M1
- M5
- M15
- M30
- H1
- H4
For each timeframe, the panel shows:
- Current signal direction
- Trend line status
- Overall market direction
This allows traders to evaluate the broader market context instantly without switching between multiple charts.
One of the most effective ways to use ProScalpDOT Pro is to trade in the direction of the higher timeframe trend.
Recommended workflow:
- Check the Multi-Timeframe Information Panel.
- Identify the dominant trend across the higher timeframes.
- Wait for a pullback on your trading timeframe.
- Enter a position only after a Buy or Sell signal appears in the direction of the higher timeframe trend.
This approach helps reduce counter-trend trades and allows traders to focus on higher-probability trading opportunities.
ProScalpDOT Pro was specifically designed with active traders in mind.
It performs exceptionally well on lower timeframes, including:
- M1
- M5
- M15
The indicator helps traders quickly identify:
- The beginning of new market impulses
- The end of pullbacks
- Local trend reversals
- Strong momentum movements
At the same time, the integrated Multi-Timeframe Panel provides continuous confirmation from higher timeframes, helping traders filter out lower-quality signals and trade in the direction of the dominant market trend.
This combination of local entry signals and higher timeframe confirmation creates a disciplined and highly effective trading workflow.
Signal
ATR Period
Defines the volatility calculation period.
Lower values make the indicator more responsive and generate earlier signals.
Higher values reduce market noise and produce a smoother, more stable trend line.
Multiplier
Controls the overall sensitivity of the indicator.
Higher values produce fewer, more conservative trading signals.
Lower values increase sensitivity and allow the indicator to react more quickly to market changes.
Hug Price
Controls how closely the trend line follows the current market price.
Lower values produce smoother price tracking.
Higher values make the trend line react more aggressively to strong market movements.
Smooth
Defines the smoothing level of the trend line.
Lower values produce faster signals.
Higher values provide better filtering of short-term market fluctuations.
Show Arrows
Enables or disables Buy and Sell signal arrows.
Show Panel
Enables or disables the Multi-Timeframe Information Panel.
Panel X
Horizontal position of the information panel.
Panel Y
Vertical position of the information panel.
Font
Font used for displaying panel information.
Font Size
Text size of the information panel.
Show Channel
Enables or disables the trend channel.
Channel Bars
Defines the number of recent bars used to calculate the trend channel.
The default value of 100 bars provides an excellent balance between responsiveness and trend stability.
Channel Color
Color of the trend channel.
Channel Style
Line style of the trend channel.
✔ Advanced proprietary trend-following algorithm.
✔ Clear identification of new market movements.
✔ Accurate Buy and Sell signals.
✔ Intelligent price tracking.
✔ Built-in dynamic trend channel.
✔ Integrated Multi-Timeframe Information Panel.
✔ Simultaneous analysis of six different timeframes.
✔ Higher timeframe trend confirmation for signal filtering.
✔ Clean and lightweight chart visualization.
✔ Suitable for all financial markets, including:
- Forex
- Indices
- Precious Metals
- Cryptocurrencies
- CFDs
- Stocks
- Futures