Tick Candles Live Seconds Chart
- 지표
- 버전: 3.36
- 업데이트됨: 17 7월 2026
- 활성화: 20

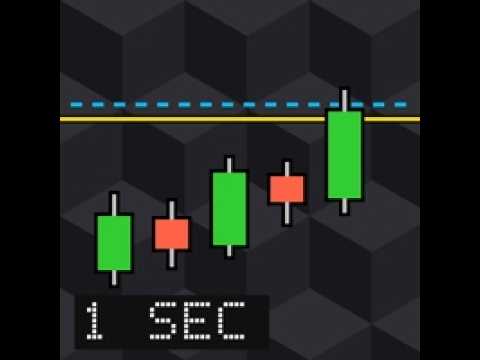
MetaTrader 5 has no native second charts. Tick Candles fills that gap: true second-based candles (default 1 second), built directly from your broker's tick stream, in their own subwindow on any chart and symbol. TradingView-style wheel zoom, drag pan and crosshair readout, deep zoom that never compacts the data, a tick-count volume pane, live bid and ask lines with a spread readout, and one-key CSV export. No custom symbols, no offline charts, no setup: attach it to any chart and it backfills instantly.
What makes it different
- The data stays raw. Zooming out never converts your seconds into a higher timeframe. Below 1 pixel per candle it switches to pixel-column rendering (each column shows the high-low range of the candles behind it), so you can see hours of 1-second data and zoom right back in to every candle.
- It reads like a modern charting app: mouse wheel zooms, dragging pans, the newest candle sits where you want it (configurable right margin), and a LIVE button snaps back to the edge. END follows live, HOME jumps to the oldest data.
- It is honest about data quality. Seconds without ticks are drawn grey, never faked as price movement. When the feed goes quiet (market closed) the chart says so instead of inventing candles.
Features
- Candle-size buttons on the chart: 1s, 2s, 5s, 10s, 15s, 30s, 1m — one click, instant rebuild (any 1–60 s via the inputs)
- Up to 7 days of candles kept in memory (default 12 hours); tick-history backfill covers up to 24 hours, the rest fills live
- Instant backfill on attach from the broker tick history, in memory-safe chunks
- Tick-count volume pane under the price chart (direction-colored, scales with every zoom level)
- Crosshair with time, O/H/L/C, percentage change and tick-count readout of the candle under the cursor
- TradingView-style free chart: drag the price scale (or scroll over it) to stretch or flatten the vertical scale; then drag anywhere to move the view in any direction; LIVE or END snaps back to auto-fit
- Crosshair price label on the scale shows the percentage distance from the current price
- Live bid line with price label, optional ask line with a live spread readout in points
- Optional spread alert: set a points threshold, get at most one alert per minute
- Press E to export every kept candle (time, open, high, low, close, tick count) to a CSV file in the MQL5 Files folder — always the same file name per symbol, easy to find back; an on-chart banner and an alert confirm every save
- Zoom level is remembered across timeframe switches
- Per-candle tick counter in the header
- Works on symbols that quote bid/ask and on exchange symbols that only stream last-trade prices
- Self-healing rendering: survives window resizes, subwindow layout changes, long minimizes and market reopens without needing a timeframe switch
- Colors fully configurable, dark-theme default
How to use
1. Attach to any chart (the chart timeframe does not matter).
2. Scroll the mouse wheel inside the subwindow to zoom, drag to pan, click a size button (1s–1m) to change the candle size.
3. Drag or scroll the right price scale to stretch or flatten the chart vertically; then drag anywhere to move the view in any direction. END or the LIVE button returns to auto-fit and follows the live edge; HOME jumps to the oldest kept candle.
4. Hover for the crosshair readout; press E to export the kept candles to a CSV (the journal shows the file name).
Good to know
- History is limited to the configured ring (default 12 hours). The tool shows what your broker's tick feed delivers; it does not download external data.
- Candles are built from bid prices (or last-trade prices on exchange symbols). The ask line is live only.
- This is a visual tool in an indicator subwindow. It does not trade and it does not place objects on your main chart.
Free demo
The free demo runs in the Strategy Tester (MetaTrader trials cannot be attached to a live chart). For a good demo run: set the modelling to Every tick, pick a short date range of a day or two, and use a slow visual speed. A one second chart over a long range flies past even though the rendering is smooth. On a real chart the full version builds its candles live from your broker's tick stream, which is where the tool shines.
Why I built this
After switching to MetaTrader 5, I was disappointed it had no 1-second chart, or any sub-minute chart at all, so I built my own. It is inspired by the 1-second chart on MEXC, which I always liked the feel of.
Real-chart version
Want the seconds candles on a full-size real chart instead of a subwindow, so you can attach EAs and templates to them? That's my Tick Candles Seconds Chart Generator MT5: https://www.mql5.com/en/market/product/185807
Questions in the Comments tab are answered within 24 hours on trading days. Reported issues get fixed quickly.
Introductory price. Early buyers receive all future updates, and the price will rise as the indicator grows.
What makes it different
- The data stays raw. Zooming out never converts your seconds into a higher timeframe. Below 1 pixel per candle it switches to pixel-column rendering (each column shows the high-low range of the candles behind it), so you can see hours of 1-second data and zoom right back in to every candle.
- It reads like a modern charting app: mouse wheel zooms, dragging pans, the newest candle sits where you want it (configurable right margin), and a LIVE button snaps back to the edge. END follows live, HOME jumps to the oldest data.
- It is honest about data quality. Seconds without ticks are drawn grey, never faked as price movement. When the feed goes quiet (market closed) the chart says so instead of inventing candles.
Features
- Candle-size buttons on the chart: 1s, 2s, 5s, 10s, 15s, 30s, 1m — one click, instant rebuild (any 1–60 s via the inputs)
- Up to 7 days of candles kept in memory (default 12 hours); tick-history backfill covers up to 24 hours, the rest fills live
- Instant backfill on attach from the broker tick history, in memory-safe chunks
- Tick-count volume pane under the price chart (direction-colored, scales with every zoom level)
- Crosshair with time, O/H/L/C, percentage change and tick-count readout of the candle under the cursor
- TradingView-style free chart: drag the price scale (or scroll over it) to stretch or flatten the vertical scale; then drag anywhere to move the view in any direction; LIVE or END snaps back to auto-fit
- Crosshair price label on the scale shows the percentage distance from the current price
- Live bid line with price label, optional ask line with a live spread readout in points
- Optional spread alert: set a points threshold, get at most one alert per minute
- Press E to export every kept candle (time, open, high, low, close, tick count) to a CSV file in the MQL5 Files folder — always the same file name per symbol, easy to find back; an on-chart banner and an alert confirm every save
- Zoom level is remembered across timeframe switches
- Per-candle tick counter in the header
- Works on symbols that quote bid/ask and on exchange symbols that only stream last-trade prices
- Self-healing rendering: survives window resizes, subwindow layout changes, long minimizes and market reopens without needing a timeframe switch
- Colors fully configurable, dark-theme default
How to use
1. Attach to any chart (the chart timeframe does not matter).
2. Scroll the mouse wheel inside the subwindow to zoom, drag to pan, click a size button (1s–1m) to change the candle size.
3. Drag or scroll the right price scale to stretch or flatten the chart vertically; then drag anywhere to move the view in any direction. END or the LIVE button returns to auto-fit and follows the live edge; HOME jumps to the oldest kept candle.
4. Hover for the crosshair readout; press E to export the kept candles to a CSV (the journal shows the file name).
Good to know
- History is limited to the configured ring (default 12 hours). The tool shows what your broker's tick feed delivers; it does not download external data.
- Candles are built from bid prices (or last-trade prices on exchange symbols). The ask line is live only.
- This is a visual tool in an indicator subwindow. It does not trade and it does not place objects on your main chart.
Free demo
The free demo runs in the Strategy Tester (MetaTrader trials cannot be attached to a live chart). For a good demo run: set the modelling to Every tick, pick a short date range of a day or two, and use a slow visual speed. A one second chart over a long range flies past even though the rendering is smooth. On a real chart the full version builds its candles live from your broker's tick stream, which is where the tool shines.
Why I built this
After switching to MetaTrader 5, I was disappointed it had no 1-second chart, or any sub-minute chart at all, so I built my own. It is inspired by the 1-second chart on MEXC, which I always liked the feel of.
Real-chart version
Want the seconds candles on a full-size real chart instead of a subwindow, so you can attach EAs and templates to them? That's my Tick Candles Seconds Chart Generator MT5: https://www.mql5.com/en/market/product/185807
Questions in the Comments tab are answered within 24 hours on trading days. Reported issues get fixed quickly.
Introductory price. Early buyers receive all future updates, and the price will rise as the indicator grows.