Swap Monitor MultiCurrency

Swap Monitor — Multi-Symbol Buy/Sell Swap Dashboard with Alerts

Swap Monitor is a real-time multi-symbol dashboard that displays live SELL and BUY swap rates for your entire watchlist in one compact, color-coded panel — and can alert you the instant any swap rate changes.

Key features:

  • Monitor 10, 28, 50+ symbols simultaneously from a single customizable text file
  • Auto-adaptive grid layout — the panel automatically resizes to fit however many symbols you load
  • Displays both SELL and BUY swap values per symbol side by side, refreshed continuously
  • Color-coded swap values: positive swaps shown in green, negative swaps in red, zero in neutral gray — instantly spot which symbols pay or cost you for holding overnight
  • Built-in change-detection alerts: get notified the moment a broker updates a swap rate, with popup alert, terminal log, and/or mobile push notification — fully toggleable
  • Adjustable alert sensitivity threshold to avoid noise from rounding
  • Alphabetical auto-sort option, or keep your own custom order
  • Optional symbol suffix support for brokers using non-standard naming (e.g. EURUSD.r, EURUSDm)
  • Fully customizable colors, panel position, column count, and refresh rate
  • Lightweight — minimal CPU usage even when watching 50+ symbols continuously

Ideal for swap-sensitive strategies, carry trades, or simply knowing the moment your broker adjusts overnight financing costs — across your entire symbol list, without opening a single Market Watch tab.



추천 제품
CorrelationRadarPRO
Gabriel Balbino De Oliveira
Correlation Radar PRO — Multi-Asset Correlation Dashboard for MetaTrader 5 Short Description: Eliminate market noise and spot price divergences in seconds. Correlation Radar PRO calculates historical, monthly, weekly, and real-time correlations across multiple assets and lets you overlay candles directly on your chart without switching your main symbol. Full Description: Manually switching charts to understand inter-market relationships wastes precious time and leads to missed setups. Correlatio
XFlow
Maxim Kuznetsov
XFlow shows an expanding price channel that helps determine the trend and the moments of its reversal. It is also used when accompanying transactions to set take profit/stop loss and averages. It has practically no parameters and is very easy to use - just specify an important moment in the history for you and the indicator will calculate the price channel. DISPLAYED LINES ROTATE - a thick solid line. The center of the general price rotation. The price makes wide cyclical movements around the
The Market Structures Pro indicator finds and displays 5 (five) patterns of the Smart Money Concepts (SMC) system on the chart, namely: Break Of Structures (BoS)       Change of character (CHoCH) Equal Highs & Lows Premium, Equilibrium and Discount zones with Fibo grid High-high, Low-low, High-low and Low-high extremes Patterns are displayed for two modes - Swing and Internal and are easily distinguished by color on the chart. Internal mode features higher contrast colors, finer lines, and smal
Breakout Index
Waleed Saleem
Monster Breakout Index V2 is a clean, visual momentum indicator engineered to spot potential breakout opportunities by evaluating extreme price extensions against median historical range channels. Overview The indicator continuously monitors the median price across a configurable lookback window and compares it against current high and low extremes. When price expansion breaks out of the established median bounds, MBI V2 immediately plots distinct histogram bars in a separate window, allowing tr
ShortBS
Yan Qi Zhu
ShortBS是一个很好的短线交易指示器,能很好与 BestPointOfInitiation ( https://www.mql5.com/zh/market/product/96671 )配合,能让你找到最合适的buy和sell位置,指标不含有未来函数,不会重新绘制。是一个针对(如果你感觉到这个指标能够帮助你进行更准确的交易,请帮忙给个好评,希望我的作品能够帮助更多有需要的人) ===================参数列表===================== maPeriod: 25 slowPeriod:20 fastPeriod:10 stepPeriod:5 =================参考使用方法=================== 此指标可以适用于任何交易品种,能够用在任何周期。
Tread Performance Dashboard
Nutthaluk Sirichayanan
Tread Performance Dashboard MT5 [Save 50% from $49] Available until the end of September 2026 Review your trading performance directly on your MetaTrader 5 chart. Tread Performance Dashboard combines account statistics, a monthly profit calendar, performance charts, and optional pending order notifications in one interface. Designed for manual traders and Expert Advisor users, the dashboard lets you review results by period, symbol, and magic number. It reads the currently connected account and
Start Midas Fibo Bands
Ricardo Almeida Branco
Here we have the Start Midas Fibo Bands , I confess that it is an indicator that excited me enough to operate because I was able to find more defined rules. Well, the indicator has the functions of the other indicators of the Start line , which is a possibility to plot several Midas on the screen, you can move the anchor point using keyboard shortcuts and use the legend to differentiate one anchor from another. The rules that I have analyzed for my possible setup are recommended to the entry, st
Confluence Dashboard
Allan Aparece Ninal
Confluence Dashboard is a dashboard indicator for MetaTrader 5. One row per symbol shows six checks (EMA, ADX, MACD, RSI, SuperTrend, UT Bot) and a BUY, SELL or WAIT verdict, with alerts. You choose how many checks must agree before the verdict turns BUY or SELL, so you see at a glance which symbols line up on one timeframe. It places no orders and does not repaint. Rows use closed bars only, and one copy shows one timeframe. Standalone: everything is built in. You do not need to buy or install
StructureLens
Jacopo Monti
StructureLens - Smart Money Concepts for MT5: Market Structure, Order Blocks, Fair Value Gaps, Liquidity StructureLens draws the market structure the way Smart Money traders read it, on any symbol and timeframe. Everything is calculated on closed candles: once a label is drawn it never changes. Market structure - Swing points HH, HL, LH and LL. A swing is confirmed only after "Swing length" candles on each side (default 10), so it never repaints. - BOS (break of structure, solid line) when pr
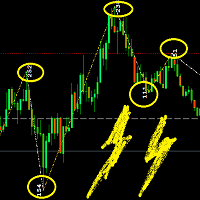
This Indicator adding power to traditional zigzag indicator. With High-Low numbers in vision it will be easier to estimate change of trend by knowing the depth of each wave. Information including points, pips, percentage%, and #bars can be displayed based on configuration. All information is real-time update. This indicator is especially useful in sideway market to buy low sell high.
RSIScalperPro
PATRICK WENNING
RSIScalperPro를 소개합니다 - 메타트레이더 5용 RSI 기반의 혁신적인 인디케이터로, 1분 차트에서의 스캘핑에 최적화되어 있습니다! RSIScalperPro를 사용하면 정확한 진입 및 청산 신호를 제공하는 강력한 도구를 손에 넣을 수 있습니다. RSIScalperPro는 서로 다른 두 가지 RSI 지표를 사용하여 과매수 및 과매도 레벨에 대한 명확한 신호를 제공합니다. 2개의 RSI의 시간 프레임 및 제한 값을 원하는 대로 조정하여 트레이딩 전략에 최적화된 결과를 얻을 수 있습니다. 차트 상의 개별 화살표는 거래 진입 및 청산 타이밍을 쉽게 파악하는 데 도움이 됩니다. 또한 RSIScalperPro의 특징 중 하나는 사용자 정의 가능한 3개의 이동 평균선입니다. 이를 통해 트렌드의 방향을 판단하고 강력한 거래 신호를 확인하는 데 도움이 됩니다. 이를 통해 조기에 트렌드를 감지하고 수익성 높은 거래에 참여할 수 있습니다. 뿐만 아니라 RSIScalperPro는 새로운 거래
Orderflow Footprint with Delta and Trade Bubbles 는 MetaTrader 5(MT5)용 주문 흐름 지표입니다. 이 지표는 모든 캔들을 주문 흐름 차트(클러스터 차트라고도 함)로 변환하여 각 가격대에서 거래된 거래량을 매수량(호가)과 매도량(매수호가)으로 구분하여 보여줍니다. 각 캔들에는 델타, 거래량 프로필 및 제어점도 표시됩니다. 버블 창에는 거래가 발생하는 순간을 보여주므로 주문 흐름을 틱 단위로 관찰할 수 있습니다. 거래량 지표는 브로커의 틱 데이터를 기반으로 생성됩니다. 거래소 종목의 경우 실제 거래량을 사용하고, 일반적으로 거래량이 없는 외환 및 CFD 종목의 경우 틱 수를 계산합니다. 아래 "거래량 측정 방법" 섹션에서 자세히 설명합니다. 매수 및 매도 거래량을 포함한 시장 점유율 차트 각 캔들은 가격 행으로 나뉩니다. 각 행에는 매수호가 x 매도호가, 델타 또는 총 거래량이 표시될 수 있으며, 행 색상은 거래량 히트맵, 델타 또는 우
Smart Volatility Squeeze MT5 Smart Volatility Squeeze MT5 is a volatility compression and momentum expansion indicator for MetaTrader 5. It builds on John Carter's Volatility Squeeze framework and extends the usual single-tier squeeze into three compression tiers, so you can see not only whether the market is compressed but how tightly it is compressed before it expands. The indicator opens in a separate window and draws two elements: a linear regression momentum histogram and a row of coloured
VWAP 편차 지표 (VWAP Deviation Indicator) VWAP 편차 지표 는 거래량을 기반으로 가격을 분석하는 도구로, 현재 가격과 동적으로 계산되는 VWAP 기준선 및 편차 수준 사이의 관계를 분석하도록 설계되었습니다. 단순 이동평균과 달리 이 지표는 틱 거래량(Tick Volume) 가중 방식 을 사용합니다. 이를 통해 거래 활동이 높은 가격 수준이 VWAP 계산에서 더 큰 가중치를 갖게 됩니다. 이 지표는 중앙의 VWAP Basis 와 함께 2배 및 3배 편차 밴드 를 표시하여 현재 가격의 위치, 잠재적인 과도한 가격 확장 및 평균 회귀 가능 영역을 동적으로 분석할 수 있도록 합니다. 주요 기능 거래량 가중 VWAP 선택한 계산 기간의 틱 거래량을 사용하여 사용자 지정 VWAP를 계산합니다. 동적 편차 밴드 VWAP를 중심으로 다음 4개의 편차 수준을 표시합니다. Upper Dev 2 — VWAP + 2× 편차 Upper Dev 3 — VWAP + 3× 편차 Lo
Phantom Stat-Arb Scanner (Institutional Arbitrage)  The "Unfair Advantage" Prop Firms & Hedge Funds Use Phantom Stat-Arb Scanner- is an institutional-grade utility that brings Statistical Arbitrage (Stat-Arb) to the MetaTrader 5 platform. While retail traders struggle with single-pair indicators, Hedge Funds and Prop Firms thrive on "Mean-Reversion Divergence"—trading the spread between highly correlated assets. Our scanner tracks up to 20 currency pairs in real-time, building a dynamic corre
Volume Trade Levels
Mahmoud Sabry Mohamed Youssef
The idea behind this indicator is very simple , First it contains 2 mechanisms to place your trades: 1- Enter the Pips you want to duplicate to price levels. 2- Automatically let the indicator specify the largest Buy / Sell Volume Candle and place duplicated levels based on the candle itself. How it works: 1- Enter the Pips you want to duplicate to price levels:    1- once the indicator is loaded you will need first to Specify the number of pips in the indicator Configuration window ,you can g
Professional Non-Repainting TMA Channel Indicator for MetaTrader 5 TMA Channel PRO Non Repaint is a professional trend and volatility channel indicator designed for traders who work with dynamic support/resistance zones, trend continuation, reversals, and channel-based trading systems. MAIN FEATURES • Non-Repainting Logic • Dynamic TMA Channel • Vertical Histogram Cloud • Median Trend Lines • Buy & Sell Signal Zones • Adaptive Volatility Structure • Multi-Timeframe Compatibility • Suita
Kill Zones MT5
Diego Arribas Lopez
MT4 Version Kill Zones Kill Zones allows you to insert up to 3 time zones in the chart. The visual representation of the Kill Zones in the chart together with an alert and notification system helps you to ignore fake trading setups occurring outside the Kill Zones or specific trading sessions. Using Kill Zones in your trading will help you filter higher probability trading setups. You should select time ranges where   the market   usually reacts with high volatility. Based on   EST time zone, fo
Quantified Trendline Strength (QTS) Overview Quantified Trendline Strength is a technical analysis tool that automatically detects and evaluates trendlines based on price swing structures. It provides a visual and quantitative way to understand how significant each trendline may be, allowing traders to make more structured observations of market behavior. Indicator Type Category: Trend / Level Detection Display: Chart window (overlay indicator) Purpose: Identify and evaluate trendlines, support
Ict institutional zones
Marrion Netondo Wabomba
SMC VALID EA (MT5) Version: 1.10 Author: Marrion Brave Wabomba Category: Smart Money Concepts (SMC) and  ICT concepts ICT Smart Money Daily Zones (SMC Pro)  ICT Smart Money Daily Zones (SMC Pro) – ICT Daily Buy & Sell Zones Pro is a professional-grade Smart Money Concepts (SMC) / ICT trading indicator for MetaTrader 5, designed to clearly map institutional daily levels and guide traders with high-probability decision zones . This indicator automatically analyzes the Daily timeframe (PDH / PD
가격이 유동성을 탐색할 수 있는 위치 파악 Liquidity Reaction Map MT5는 확인된 가격 구조를 기반으로 잠재적인 매수측 및 매도측 유동성 영역을 식별하는 차트 기반 시장 분석 지표입니다. 스윙 포인트, 동일 고점과 동일 저점, 전일 및 전주 레벨, 세션 고점과 저점, 심리적 라운드 가격을 하나의 정리된 유동성 지도에 결합합니다. 서로 가까운 레벨은 하나로 병합할 수 있으며 강도, 현재 가격과의 거리, 여러 출처의 일치 정도에 따라 순위가 결정됩니다. 이 지표는 가격이 유동성 영역에 접근하거나, 해당 유동성을 스윕하거나, 거부되거나, 돌파할 수 있는 위치를 분석하는 데 도움을 줍니다. 거래를 개시하거나 관리하지 않습니다. 유동성 출처 유동성 지도는 다음 항목을 기반으로 유동성을 식별할 수 있습니다. 확인된 스윙 고점과 저점 동일 고점과 동일 저점 전일 고점과 저점 전주 고점과 저점 완료된 세션의 고점과 저점 심리적 라운드 가격 레벨 설정 가능한 여러 시간대 매수측 유
Axis Reversionn
Vaghasiya Kartik Sanjaybhai
Axis Reversionn: Multi-Asset Strength & Reversal Matrix Pinpoint market extremes and anticipate potential reversions with Axis Reversionn . This advanced dashboard for MetaTrader 5 provides an institutional-grade view of the market, allowing you to see which assets are over-extended and ripe for a reversion to their mean. Instead of following the crowd, identify where the crowd has pushed too far. Axis Reversionn gives you the data-driven edge to trade against market extremes with confidence. Ke
Quant Kelly Trader
Christian Alexander Foehl
Quant Kelly Trader EA는 정교한 시장 구조 신호와 켈리 공식을 기반으로 한 수학적 리스크 관리 기법을 결합합니다. S&P500 (US500) M15 차트를 위해 설계되었으며, 빠른 자본 성장과 통제된 리스크를 동시에 제공합니다. 세계 최고의 퀀트 및 투자자들의 전략에서 영감을 얻었습니다. 축적 국면에 초점을 맞추고 조정된 켈리 공식을 적용하여, 이 EA는 성장 잠재력을 활용하면서 리스크를 관리하려는 트레이더들에게 전문적인 도구를 제공합니다. 전략 EA는 주요 시장 참여자들이 포지션을 쌓는 축적 국면을 식별합니다. 이 구역에서 진입하고 이후 전체 추세를 따릅니다. 오픈 포지션은 체계적으로 보호되어 손실을 줄이고 이익을 효율적으로 확대합니다. 세션, 요일 및 추세 필터는 고품질의 신호만 거래되도록 보장합니다. 내장된 트레일링 스톱은 이익을 확대하면서 손실을 꾸준히 제한합니다. 켈리 공식 기반 리스크 관리 켈리 공식은 수십 년 동안 자본 성장을 효율적으로 달성하기 위한
Nyra Pulse AI
Prabir Sarkar
NYRA PULSE AI — LIMITED LAUNCH ACCESS A volatility-lifecycle and momentum-transition engine for traders who want to recognize when market energy is building, releasing, sustaining, retracing, or fading. FIRST 3 BUYERS — ONLY $42 FIRST 3 BUYERS $42 NEXT PRICE TIER $55 THIRD PRICE TIER $69 FINAL LAUNCH TIER $105 PLANNED STANDARD PRICE $249 Launch pricing increases automatically: after the first three copies at $42 are sold, NYRA moves to the next listed tier. Completed tiers are not planned to
AlphaPrime
Richard Horlock
AlphaPrime AlphaPrime is a discretionary market analysis indicator for MetaTrader 5 designed to provide multi time frame directional bias and structural context . It supports decision making by highlighting market structure, key levels, and higher time frame alignment. AlphaPrime does not execute trades and does not provide guaranteed signals. It is intended for traders who want a clear analytical framework rather than automated entries. Key Features • Multi time frame directional bias visualiz
ScalpMatrix Algo
Rochmad Ilham Saifudin
ScalpMatrix Algo: Advanced SMC & Confluence Engine ScalpMatrix Algo is a premium all-in-one indicator specifically designed for scalpers and day traders seeking high-precision market execution. Combining the precision of Smart Money Concepts (SMC) with a multi-filter confirmation algorithm, this indicator automates your daily chart analysis and provides objective signals based purely on probability and market structure. No more spending hours manually analyzing charts. ScalpMatrix Algo dissects
ModGod Trend Scalp Pullback
Egon Henrique Portolani
ModGod Scalp Pullback - Precision Trend & Reversion Engine LAUNCH PROMOTION: Only $49 for the first 10 copies! The official price will be $490. Buy before the price goes up! The   ModGod Scalp Pullback   is an advanced, all-in-one indicator designed for professional scalpers and day traders. It combines the extreme smoothness of Triangular Moving Averages (TMA) with Heikin-Ashi trend filtering to provide highly accurate pullback entries and extreme exhaustion reversals. By mapping the natu
ToolBox 360 is the swiss knife of all indicators. It is full packed with useful tools to help you with your trading. It can be used to find best entry and exit points and help you to decide if you should open a trade or not. It shows market trends, candlestick formations outside / inside bars and you can sett time based allerts. Main features: Time based Fibonacci lines Choose a start and end time and the indicator shows you Fibonacci lines within the selected time range including range high a
Phoenix Trend Strength Suite
PHOENIX GLOBAL INVESTMENTS LTD
추세가 모든 시간대에서 동일한 방향으로 움직이는 경우는 드뭅니다. 15분(M15) 차트에서 강세 추세가 나타나더라도, 이는 단순히 4시간(H4) 차트의 약세 추세 내에서 발생하는 조정일 수 있습니다. 더 넓은 범위의 추세를 확인하지 않고 단기적인 차트만 보고 거래하면, 겉보기에는 좋아 보이는 진입점이 실제 추세와 반대되는 거래로 이어질 수 있습니다. Phoenix Trend Strength Suite는 5가지 시간대의 추세 방향과 강도를 한 번에 분석하여 결과를 단일 대시보드에 표시하므로, 거래를 실행하기 전에 현재 시간대의 추세가 실제 큰 그림과 일치하는지 확인할 수 있습니다. 이 도구는 XAUUSD 및 외환 쌍을 포함한 모든 종목에서 작동합니다. 단일 시간대 분석만 필요한 트레이더에게는 무료인 Phoenix Trend Strength Meter가 더 적합합니다. 주요 기능 M15, H1, H4, D1, W1에 걸친 다중 시간대 트렌드 그리드 조정 가능한 임계값을 기준으로 ‘약함(
Pivot Monster EA
Alexandre Vincent Traber
PIVOT MONSTER EA 개요 PIVOT MONSTER는 일일 피봇 레벨(Classic, Camarilla 또는 Woodie)과 전일 고가/저가 돌파를 결합하여 거래합니다. Bounce(반등), Breakout(돌파), Combo(합류) 세 가지 상호 교체 가능한 전략을 실행하며, 하루에 한 번 예약 주문을 배치하고 ATR 배수 또는 가격 대비 백분율로 통일된 SL/TP 산정 방식을 사용합니다. 고정된 인디케이터 오버레이가 아닌, 완전히 최적화 가능한 규칙 기반 피봇 시스템을 원하는 트레이더를 위해 설계되었습니다. 작동 방식 매 거래일 시작 시, EA는 전일 고가/저가/종가를 기반으로 피봇 레벨(PP, R1-R3, S1-S3)을 계산하고 전일 고가와 저가를 기록합니다. 선택한 전략에 따라 S1/R1 근처에 Buy Limit/Sell Limit 주문(Bounce), 전일 고가/저가를 초과하는 위치에 Buy Stop/Sell Stop 주문(Breakout), 또는 피봇 레벨과 전
FREE
이 제품의 구매자들이 또한 구매함
Trend Sniper X
Sarvarbek Abduvoxobov
4.86 (43)
Trend Sniper X 는 트레이더가 추세 방향과 잠재적 반전 지점을 명확하고 정확하게 포착할 수 있도록 도와주는 MetaTrader 5용 멀티 타임프레임 추세 추종 지표입니다. MT4용: https://www.mql5.com/en/market/product/193245 가격 정보: 현재 가격은 프로모션 할인가이며, 향후 업데이트 및 새로운 기능이 출시됨에 따라 변동될 수 있습니다. 보너스 혜택: 본 지표 전용 무료 자동매매 Assistant EA를 받으시려면 구매 후 작성자에게 메시지를 보내주시기 바랍니다. Code2Profit 채널 멀티 타임프레임 분석으로 시장을 마스터하세요! Trend Sniper X로 승률을 극대화하는 방법: 핵심 규칙 및 세션 팁 기술 사양 플랫폼 MetaTrader 5 지표 유형 멀티 타임프레임 추세 지표 운용 타임프레임 모든 차트 타임프레임 지원, 독립적으로 선택 가능한 상위 타임프레임(M1–MN1) 주요 상품 외환, 금(XAUUSD) 및 기타 C
Smart Trend Trading System — MetaTrader 5 구매 후 MQL5에서 저에게 메시지를 보내시면 Smart Universal Expert Advisor를 무료로 받으실 수 있으며, 온라인 강좌, PDF 매뉴얼 및 비공개 그룹 이용 권한도 함께 제공됩니다. STTS는 추세 방향, 진입·청산 신호, 반전 구간, 주요 가격 수준을 차트에 모아 보여줍니다. 시스템을 참고해 수동으로 거래하거나, 별도의 호환 EA를 연결하여 선택한 설정에 따라 자동으로 거래를 실행할 수 있습니다. 하나의 시스템, 네 가지 트레이딩 접근법 STTS의 트레이딩 접근법은 크게 네 가지로 나뉩니다. • 스캘핑 — 단기 신호와 시장 움직임을 살펴봅니다. • 추세 매매 — 방향을 평가하고 추세 안에서 기회를 찾습니다. • 반전 매매 — 잠재적인 전환 구간과 방향 변화를 파악합니다. • 거래량 매매 — 거래량 기반 정보로 시장 활동을 평가합니다. 진입·청산 화살표, 추세 정보, 지지·저항 수
새로운 왕의 등장 - 인디케이터 + 주문 관리 표시(TP1 + TP2 + TP3) + 선택형 텔레그램 시그널 전송 기능 포함 (무료) (완전한 트레이딩 및 시그널 시스템) 골드를 위한 최고의 EA: Gold Slayer 이 인디케이터는 고급 전략, 사용자 지정 가능한 주문 관리 시스템, 그리고 엔벨로프 확장을 결합한 평균 회귀(mean reversion) 시스템을 포함하고 있습니다. 또한 RSI와 같은 여러 지능형 확인 필터를 통해 높은 확률의 반전 진입 구간을 포착하여 BUY 및 SELL 시그널을 제공합니다. 단순히 거래 방법만 배우는 것이 아니라, 여러 포지션을 효과적으로 관리하고 이전에 수익 중인 오픈 포지션으로 손실 거래를 커버하는 방법까지 익힐 수 있습니다. M5 전용으로 설계 및 최적화되었으며, 유동성이 풍부해 시그널이 더 깔끔하고 신뢰도 높은 BTCUSD와 XAUUSD에서 뛰어난 성능을 발휘합니다. 이 인디케이터는 ATR 기반으로 자동 계산된 진입가, 손절가, 익절가와
M5 Sniper
MeanFX
5 (3)
당신의 트레이딩 우위를 한눈에 확인하세요! M5 Sniper 는 MeanFX의 새로운 지표입니다. 정확한 트레이딩 신호 와 적응형 TP/SL 레벨 을 결합하여, 결과적으로 가능한 최고의 통계적 트레이딩을 만들어냅니다! 5회 구매마다 가격이 인상되며, 다음 가격은 69$입니다. 구매 후 저에게 메시지를 보내주시면 팁/가이드와 보너스 EA를 제공해 드립니다. 무엇이 이 지표를 특별하게 만들까요? Gold XAUUSD에서 검증된 통계적 성과 ( 거의 모든 자산에서 작동 하며, 일관된 결과 없이 모든 것을 다루려고 하기보다는 하나의 타임프레임을 완전히 익히는 데 집중합니다) 각 심볼당 하루 1~8회의 트레이드 와 높은 승률을 제공하며, 모든 통계적 우위를 우리의 편으로 가져갑니다. 차트에는 확인된 BUY 및 SELL 신호만 표시됩니다. 각 트레이드에 대해 지표가 생성하는 적응형 TP 및 SL 레벨 평균 승률 75%+ 평균 Signal Ratio 최소 1.1+ 알람 및 알림이 휴대폰 으로도
SuperScalp Pro
Van Minh Nguyen
4.54 (37)
SuperScalp Pro - Professional Multi-Layer Confluence Scalping System SuperScalp Pro는 기존 Supertrend에 여러 지능형 확인 필터를 추가하여 기능을 강화한 고급 스캘핑 지표입니다. 잘못된 신호를 크게 줄이면서 성공 가능성이 더 높은 Buy/Sell 거래 기회를 식별하는 데 도움을 줍니다. 명확한 Buy 및 Sell 화살표가 차트에 직접 표시되며, ATR 기반 Stop Loss 및 Take Profit 레벨도 실시간으로 자동 계산됩니다. 구매 후 MQL5 메시지로 저에게 연락하시면 SuperScalp Pro Auto Trader EA를 무료로 받으실 수 있으며, 사용자 가이드와 비공개 그룹 이용 권한도 제공됩니다. 권장 설정 파일 다운로드: [Set File] 전체 문서는 제품 블로그에서 확인할 수 있습니다: [User Guide] 업데이트를 받으려면 공식 채널에 참여하세요: [Official Channel]
Entry Points Pro for MT5
Yury Orlov
4.52 (152)
2019년, 저는 이 지표가 무엇을 할 수 있는지 전 세계에 보여 주었습니다. 실계좌에서 지표의 시그널에 따라 수동으로, 모두가 볼 수 있게 공개적으로 거래했습니다 — 계좌는 Myfxbook에서 모니터링되었고, 저는 이 실험을 Facebook에 자세히 공유했습니다. 결과: 4개월 만에 10,000달러가 941,411달러가 되었습니다. 리스크는 의도적으로 극단적이었습니다 — 드로다운은 54%까지 이르렀습니다. 우리 직업에서 수익과 리스크는 언제나 함께 가기 때문입니다. Myfxbook 스크린샷은 갤러리의 첫 번째 이미지입니다. 아무래도 축하드려야 할 것 같습니다: 여러분의 탐색은 이제 끝났습니다. Entry Points Pro는 진입에서 추측을 없애고, 모든 트레이더가 찾는 것 — 확신과 평온함을 줍니다. 이 지표는 정말로 작동하고, 시그널을 절대 리페인팅하지 않으며, 그 결과를 여러분의 차트에서 곧바로 금액으로 보여 주기 때문입니다. 수많은 창과 서른 가지 설정, 그리고 작동하지도
Ultra Indicator
Ihor Otkydach
5 (1)
ULTRA는 “올인원” 방식으로 작동하는 기술적 지표로, 시장을 독자적으로 분석하고, 매매 신호를 생성하며, 손절매 주문 설정 수준을 표시하고, 이익을 실현하거나 손실을 최소화하기 위해 포지션을 청산해야 할 시점을 제안합니다. 다시 말해, 시장을 분석하는 법을 모르거나, 가격 수준(손절매를 어디에 설정할지)을 파악하지 못하거나, 자금 관리에 어려움을 겪더라도 상관없습니다. ULTRA가 그 모든 것을 대신 해줄 테니까요! 구매자 특전 : ULTRA 지표를 구매하신 후, 저에게 비공개 메시지를 보내주시면 “ULTRA BOT”을 무료 선물로 드립니다. 이 도구는 해당 지표의 신호를 바탕으로 개설한 거래를 관리하는 데 도움을 주는 특별한 도구입니다(각 거래에 대해 손절매를 설정하고, 최상의 결과를 얻을 수 있도록 전략의 규칙에 따라 거래를 자동으로 청산해 줍니다).  또한 구매자분들께 다양한 자산에 바로 적용할 수 있는 설정값을 제공해 드리고 있으며, 이를 통해 지표가 최대 효율로 작동할
SMC Intraday Formula
VividMind Digital Solutions
5 (26)
먼저 솔직하게 말하겠습니다. 어떤 인디케이터도 단독으로 당신을 수익성 있게 만들어주지 않습니다. 누군가 그렇게 말한다면, 그는 당신에게 꿈을 파는 것입니다. 완벽한 매수/매도 화살표를 보여주는 모든 인디케이터는 완벽하게 보이도록 만들 수 있습니다 — 단지 올바른 과거 구간을 확대하고 승리한 거래만 캡처하면 됩니다. 우리는 그렇게 하지 않습니다.  SMC Intraday Formula는 도구입니다. 시장 구조를 읽고, 가장 높은 확률의 가격 구간을 표시하며, 현재 스마트 머니의 흐름이 어떻게 보이는지 아주 단순한 언어로 보여줍니다. 최종 결정은 여전히 당신이 합니다. 실행도 당신이 합니다. 하지만 이제는 희망이 아니라 정확성으로 거래하게 됩니다. 우리는 이 인디케이터를 지난 약 3년 동안 골드(XAUUSD) 및 주요 외환 통화쌍의 데이 트레이딩 스캘핑에 사용해 왔습니다. M1, M5, M15, M30에서 우리의 핵심 도구입니다. 이 도구는 미래를 예측하려 하지 않습니다 — 지금 형성
Gann Made Easy MT5
Oleg Rodin
5 (13)
Gann Made Easy 는 mr.의 이론을 사용하여 최고의 거래 원칙을 기반으로 하는 전문적이고 사용하기 쉬운 Forex 거래 시스템입니다. W.D. 간. 이 표시기는 Stop Loss 및 Take Profit Levels를 포함하여 정확한 BUY 및 SELL 신호를 제공합니다. PUSH 알림을 사용하여 이동 중에도 거래할 수 있습니다. 구매 후 거래 방법 안내 및 유용한 추가 지표를 무료로 받으시려면 저에게 연락주세요! 아마도 Gann 거래 방법에 대해 이미 여러 번 들었을 것입니다. 일반적으로 Gann의 이론은 초보자 거래자뿐만 아니라 이미 거래 경험이 있는 사람들에게도 매우 복잡한 것입니다. Gann의 거래 방식은 이론적으로 적용하기 쉽지 않기 때문입니다. 나는 그 지식을 연마하고 Forex 지표에 최고의 원칙을 적용하기 위해 몇 년을 보냈습니다. 표시기는 적용하기가 매우 쉽습니다. 차트에 첨부하고 간단한 거래 권장 사항을 따르기만 하면 됩니다. 지표는 지속적으로 시장 분석
M1 Sniper MT5
Oleg Rodin
5 (7)
M1 SNIPER 는 사용하기 쉬운 거래 지표 시스템입니다. M1 시간대에 맞춰 설계된 화살표 지표입니다. 이 지표는 M1 시간대 스캘핑을 위한 단독 시스템으로 사용할 수 있으며, 기존 거래 시스템의 일부로도 사용할 수 있습니다. 이 거래 시스템은 M1 시간대 거래용으로 특별히 설계되었지만, 다른 시간대에도 사용할 수 있습니다. 원래는 XAUUSD와 BTCUSD 거래를 위해 이 방법을 설계했지만, 다른 시장 거래에도 유용하다는 것을 알게 되었습니다. 이 지표의 신호는 추세 방향과 반대로 거래될 수 있습니다. 저는 지표의 신호를 활용하여 양방향으로 거래할 수 있도록 돕는 특별한 거래 기법을 알려드립니다. 이 방법은 특별한 동적 지지선과 저항선 가격 영역을 활용하는 것을 기반으로 합니다. 구매하시면 M1 SNIPER 화살표 지표를 바로 다운로드하실 수 있습니다. 또한, 아래 스크린샷에 표시된 Apollo Dynamic SR 지표는 M1 SNIPER 도구를 사용하는 모든 사용자에게 무료로
Auto Optimized SpeedAngle 은 지속적인 워크포워드 최적화(Walk-Forward Optimization, WFO)를 통해 곡선 적합(curve-fitting)을 제거한 기관 수준의 모멘텀 벡터화 시스템입니다. 시장 체제가 바뀔 때 성능이 떨어지는 정적 입력에 의존하는 대신, 이 지표는 표본 외(Out-of-Sample, OOS) 검증을 사용하여 매개변수를 동적으로 재보정하며, 표시되는 신호가 과거의 우연이 아닌 진정한 통계적 우위를 나타내도록 보장합니다. 핵심 기관용 프레임워크 워크포워드 최적화 엔진: 핵심 알고리즘은 수천 가지의 룩백(lookback) 및 임계값 조합을 지속적으로 스캔하며, 데이터를 인샘플(in-sample)과 표본 외(out-of-sample) 세트로 엄격하게 분리합니다. 미지의 데이터 환경에서 수학적 우수성이 증명된 경우에만 새로운 매개변수 구성을 채택합니다. 정량적 목적 함수: 순수한 총이익을 쫓는 대신, 최적화 엔진은 기관 수준의 안정성
다음 업데이트 — 버전 2.52 곧 출시! [신규] 시장 분석 및 트레이딩 워크플로를 향상시키기 위해 설계된 4가지 주요 신규 기능을 기대해 주세요. 트레이딩 요구 사항을 충족하도록 설계된 4가지 새로운 기능으로 시장 분석을 한 단계 더 발전시킵니다. 다음 기능을 소개합니다: 1. TRADE OVERVIEW DASHBOARD 2. CONFLUENCE AT ZONE 3. STRONG & WEAK HIGH/LOW 4. OTE 1. TRADE OVERVIEW DASHBOARD 시장 전체 상황을 더 쉽게 파악할 수 있도록 도와주는 대시보드입니다. 트레이딩 의사결정을 지원하는 가이드를 제공하며, 하나의 화면에서 시장을 분석하고 체계적으로 트레이딩을 계획할 수 있도록 도와줍니다. 멀티 타임프레임 시장 개요 (Multi-Timeframe Market Overview) 시장 방향과 가격 구조를 더욱 명확하게 파악 시장 상황을 빠르게 확인 체계적인 시장 분석 및 진입 계획을 위한 가이드 2. CO
Atomic Analyst MT5
Issam Kassas
4.5 (64)
Atomic Analyst — MetaTrader 5 구매 후 MQL5에서 저에게 메시지를 보내시면 Smart Universal Expert Advisor를 무료로 받으실 수 있으며, 온라인 강좌, PDF 매뉴얼 및 비공개 그룹 이용 권한도 함께 제공됩니다. Atomic Analyst는 가격 움직임 분석, 추세 방향, 진입·청산 신호, 손절 수준, 여러 익절 수준을 차트에 모아 보여줍니다. 신호를 확인하고 매매 상황을 이해하세요 Atomic Analyst는 분석 결과를 명확한 시각 정보로 정리합니다. • 잠재적인 진입 기회를 확인할 수 있는 매수·매도 화살표. • 거래 계획에 도움이 되는 손절 수준과 여러 익절 수준. • 시장 방향을 평가할 수 있는 추세, 강도, 모멘텀 수치. • 더 넓은 시장 맥락을 비교할 수 있는 여러 시간대 분석. • 변화하는 시장 상황을 따라갈 수 있는 색상별 캔들과 알림. 신호와 보조 분석을 함께 검토한 다음, 해당 매매 상황이 자신의 거래 규칙에
Boba Analysis Suite
Trade Ready Solutions LLC
5 (2)
Boba Analysis Suite Boba Analysis Suite는 MetaTrader 5용 분석 지표입니다. 시장 구조, 주요 가격 영역, 전반적인 시장 상황을 하나의 차트 화면에 통합하여 표시합니다. 트레이더이자 트레이딩 코치로서의 실무 경험을 바탕으로 개발되었으며, 시장 방향 평가, 주요 가격 수준 식별, 여러 시간대의 종합적인 분석 등 체계적인 분석 과정을 지원합니다. 시장 맥락을 고려한 분석 개별 신호의 의미는 시장 상황에 따라 달라집니다. Boba Analysis Suite는 현재 차트 상황을 더 넓은 시장 구조와 연결하고, 사전에 정한 규칙에 따라 매매 아이디어를 검토할 수 있도록 돕습니다. 주요 분석 기능은 다음과 같습니다. 추세 및 시장 구조: 시장 방향과 관련 구조적 맥락을 평가합니다. 주요 가격 영역 및 수준: 추가 분석이 필요한 중요한 영역을 차트에 시각적으로 표시합니다. 여러 시간대: 서로 다른 시간대의 정보를 통합하여 전반적인 시장 상황을 평가합니다.
Azimuth Pro
Ottaviano De Cicco
5 (7)
Azimuth Pro V2: Synthetic Fractal Structure and Confirmed Entries for MT5 Overview Azimuth Pro is a multi-level swing structure indicator by Merkava Labs . Four nested swing layers, swing-anchored VWAP, ABC pattern detection, three-timeframe structural filtering, and closed-bar confirmed entries — one chart, one workflow from micro-swings to macro-cycles. This is not a blind signal product. It is a structure-first workflow for traders who care about location, context, and timing. Halloween P
Zain Gold Scalping
Ahmed Gamal Abdel Nasser Mohamed
A complete price-action analysis tool built around dual independent entry logic, each confirmed against a volatility band, combined with a configurable set of nine optional confirmation filters that let you shape exactly how conservative or aggressive the tool's signals behave. Core Strategy Two independent entry setups, each triggering only when price moves outside a dynamic volatility band — giving two distinct ways to spot potential reversal points, which can be used together or separately.
FiboSniper Pro
Van Minh Nguyen
5 (4)
FiboSniper Pro – Multi-Filter Fibonacci System with Auto SL/TP and Control Panel FiboSniper Pro는 동적 Fibonacci Envelopes와 여러 확인 필터를 결합하여 선별된 Buy 및 Sell 신호를 생성하는 기술적 지표입니다. Fibonacci 레벨은 Moving Average와 ATR을 기반으로 계산된 후 ADX, EMA, RSI, ATR, Volume, Time 및 Candle 구조를 통해 필터링됩니다. 이 지표는 ATR 기반의 자동 Stop Loss 및 Take Profit 레벨을 차트에 직접 표시하며, 빠른 설정 조정을 위한 인터랙티브 Control Panel을 제공합니다. 구매 후 MQL5 메시지로 저에게 연락하시면 Auto Trader X를 무료로 받으실 수 있으며, 이 지표의 거래 신호를 자동화하는 방법에 대한 안내도 제공됩니다. User Guide 및 Set Files: [Click here
Power Candles MT5
Daniel Stein
4.58 (12)
Power Candles V3 - 자체 최적화 강도 지표 파워 캔들 V3는 적용된 모든 차트에서 통화 및 상품의 강세를 실행 가능한 거래 계획으로 전환합니다. 단순히 캔들에 색상을 입히는 대신, 백그라운드에서 실시간 자동 최적화를 수행하여 현재 보고 있는 종목에 대한 최적의 손절매, 익절 및 신호 임계값을 제공합니다. 한 번의 클릭으로 실시간 거래에 적용할 수 있으며, 진입점, 손절매 및 익절 선이 정확한 가격에 맞춰 차트에 표시되고, 방향과 함께 알림이 발령됩니다. 이 도구는 Stein Investments 에코시스템의 일부입니다. 18개 이상의 도구와 함께 당신의 1대1 AI 트레이딩 멘토 Max.  항상 대기 중, 모든 인디케이터를 깊이 있게 이해, 무언가를 차근차근 생각해보고 싶은 순간에 도움을 줍니다.  https://stein.investments 에서 만나보세요 매 종가 바마다 3,000회 이상의 트레이딩 시뮬레이션. 9가지 강도 상태. 2가지 전략을 병렬로 테스트.
Quantum TrendPulse
Bogdan Ion Puscasu
5 (26)
SuperTrend   ,   RSI   ,   Stochastic   의 힘을 하나의 포괄적인 지표로 결합하여 트레이딩 잠재력을 극대화하는 궁극의 트레이딩 도구   인 Quantum TrendPulse를   소개합니다. 정밀성과 효율성을 추구하는 트레이더를 위해 설계된 이 지표는 시장 추세, 모멘텀 변화, 최적의 진입 및 종료 지점을 자신 있게 식별하는 데 도움이 됩니다. 주요 특징: SuperTrend 통합:   주요 시장 추세를 쉽게 따라가고 수익성의 물결을 타세요. RSI 정밀도:   매수 과다 및 매도 과다 수준을 감지하여 시장 반전 시점을 파악하는 데 적합하며 SuperTrend 필터로 사용 가능 확률적 정확도:   변동성이 큰 시장에서 숨겨진 기회를 찾기 위해 확률적 진동   을 활용하고 SuperTrend의 필터로 사용 다중 시간대 분석:   M5부터 H1 또는 H4까지 다양한 시간대에 걸쳐 시장을 최신 상태로 유지하세요. 맞춤형 알림:   맞춤형 거래 조건이 충족되면
Adaptive Price Action Engine 지표를 구매하면 EA(자동매매 프로그램)가 무료 멀티 타임프레임 기반 자기 최적화 추세 & 캔들 패턴 분석 시스템 시장은 끊임없이 변화하며, 모든 Price Action 패턴이 모든 시장 환경에서 동일한 가치를 가지는 것은 아닙니다. Adaptive Price Action Engine 은 변화하는 시장 환경에 적응할 수 있도록 설계되었으며, 추세 구조, 멀티 타임프레임 분석, 캔들 패턴 및 통계적 최적화 를 하나의 분석 프레임워크로 결합합니다. 두 가지 적응형 모드 Dual Alpha Trend Mode 낮은 타임프레임과 높은 타임프레임에서 적합한 Alpha Trend 파라미터를 자동으로 탐색하여, 최근 시장 움직임에 맞춰 추세 분석을 조정합니다. Candlestick + Alpha Mode Alpha Trend를 통한 시장 국면 분석과 22개의 상승 및 하락 캔들 패턴 을 결합합니다. 모든 패턴을 동일하게 취급하는 대신, 다양
Superhero
Ihor Otkydach
5 (3)
SUPERHERO 지표는 “올인원” 방식으로 설계된 다중 통화 거래 시스템입니다. 이 지표는 시장을 독자적으로 분석하여 포지션을 개설하고 청산할 시점에 대한 신호를 제공합니다. 손절매(Stop Loss) 및 익절(Take Profit) 주문을 활용하며, 위험 대비 수익 비율(R:R)은 1:1입니다. 이 시스템은 스마트폰으로 푸시 알림을 전송할 수 있으므로, PC에 묶여 있을 필요 없이 “이동 중에도” 매매를 할 수 있습니다. 이는 자체 거래 전문 회사에 안성맞춤입니다. 모든 고객님께 드리는 특별 혜택: 이 지표를 구매하시는 모든 분께는 제가 특별히 준비한 유틸리티를 선물로 드릴 예정이며, 이 유틸리티는 다음과 같은 기능을 제공합니다: 손절매 및 익절 주문을 자동으로 설정합니다 가격이 목표 수준에 도달하면 자동으로 포지션을 청산합니다 미결제 주문 거래를 지원합니다 평균화 거래 모드를 지원합니다 이 훌륭하고 매우 편리한 유틸리티를 선물로 받고 싶으시다면, SUPERHERO 지표를 구매하
Trend Catcher ind mt5
Ramil Minniakhmetov
5 (18)
트렌드 캐처 인디케이터 트렌드 캐처 인디케이터는 개발자가 자체 개발한 맞춤형 적응형 트렌드 분석 지표들을 조합하여 시장 가격 움직임을 분석합니다. 단기적인 노이즈를 제거하고 근본적인 모멘텀 강도, 변동성 확대, 가격 구조 움직임에 집중하여 진정한 시장 방향을 파악합니다. 또한 이동 평균, RSI, 변동성 필터와 같은 맞춤형 지표들을 활용하여 가격을 평활화하고 트렌드를 필터링합니다. 실제 운영 모니터링 및 기타 제품은 다음 링크에서 확인하실 수 있습니다:   https://www.mql5.com/en/users/mechanic/seller 텔레그램에서는 EA나 설정 파일을 판매하지 않습니다. 사기이니 주의하세요. 모든 설정 파일은 블로그에서 무료로 제공됩니다. 중요! 구매 후 즉시 연락 주시면 사용 방법 및 보너스를 드립니다!
Dynamic Forex28 Navigator MT5
Bernhard Schweigert
5 (1)
다중 통화 강도 및 모멘텀 지표 MT5 Dynamic Forex28 Navigator는 오랫동안 사랑받아 온 저희 지표의 진화 버전으로, 세 가지 기능을 하나로 결합했습니다: Advanced Currency Strength28 Indicator (리뷰 700개) Advanced Currency IMPULSE with ALERT (리뷰 530개) CS28 Combo Signals (최근 보너스) 두 이전 지표는 MQL5 Market에서 합계 1,200개가 넘는 리뷰를 받았으며 2016년부터 MT4 커뮤니티의 필수품이었습니다. Dynamic Forex28 Navigator MT5는 검증된 동일한 로직을 그대로 이어갑니다. MetaTrader 5를 위해 완전히 다시 제작 – MT5의 네이티브 다중 심볼 아키텍처를 최대한 활용하도록 설계되었습니다. 사용 설명서: https://www.mql5.com/en/blogs/post/758844 MT4 버전을 찾고 계신가요? 여기를 클릭하세요: ht
Apex Patterns PRO 인디케이터 구매 시 - 기반 Expert Advisor 무료 제공. 자체 최적화 차트 패턴 및 브레이크아웃 분석 시스템 기존의 패턴 스캐너는 고정된 파라미터에 의존하므로 시장 변동성과 구조가 변화할 때 성능이 저하되는 경우가 많습니다. Apex Patterns PRO는 구조적 차트 패턴 인식, 모멘텀 필터링, 통계적 자체 최적화를 하나의 분석 프레임워크로 결합하여 변화하는 시장 환경에 적응하도록 설계되었습니다. 적응형 스캐닝 엔진 자체 최적화 패턴 모드 최근 과거 데이터를 바탕으로 적절한 패턴 파라미터를 자동으로 탐색하여, 정적인 설정 대신 현재 시장 행보에 맞춰 인디케이터의 구조 감지 방식을 적응시킵니다. 스마트 브레이크아웃 필터링 클래식 패턴 인식과 모멘텀, 거래량, 프라이스 액션 지표를 결합합니다. 모든 브레이크아웃을 동일하게 다루는 대신, 시장의 기저 구조를 평가하여 현재 통계적 환경에 부합하는 셋업을 식별합니다. 주요 기능 리페인트 없는 고
Crystal Heikin Ashi Signals
Muhammad Jawad Shabir
5 (5)
Crystal Heikin Ashi Signals—Professional Trend & Signal Detection Indicator Advanced Heikin Ashi Visualization with Intelligent Signal System for Manual & Automated Trading Final Price: $149 ---------> Price goes up $10 after every 10 sales . Limited slots available — act fast . Overview User Guide PDF Crystal Heikin Ashi Signals is a professional-grade MetaTrader 5 indicator that combines pure Heikin Ashi candle visualization with an advanced momentum-shift detection system. Designed for both m
Neuro Poseidon MT5
Daria Rezueva
4.75 (52)
Neuro Poseidon is a new indicator by Daria Rezueva. It combines precise trading signals with adaptive TP/SL levels - creating best possible trades as a result! Message me and get  Neuro Poseidon Assistant  as a gift to automize your trading process! What makes it stand out? 1. Proven profitability on all assets and timeframes 2. Only confirmed BUY and SELL signals present on the chart 3. Adaptive TP & SL levels generated by the software for each trade 4. Easy to understand - suitable for al
Break and Retest Hunter
Mohamed Hassan
4 (4)
Break and Retest Hunter is a powerful MetaTrader 5 indicator designed to automatically identify support and resistance levels, breakout structures, and potential retest opportunities in real time. Bonus Indicator: After purchasing Break and Retest Hunter , contact me to receive Trade Indicator Assistant EA completely free as a bonus utility. $65 for the next 10 copies . Next price is $120.  Combining adaptive market analysis, clear BUY/SELL signals, Fibonacci-based profit targets, and a premiu
Unix Scalper
Issam Kassas
4 (4)
Unix Scalper — MetaTrader 5 구매 후 MQL5에서 저에게 메시지를 보내시면 Smart Universal Expert Advisor를 무료로 받으실 수 있으며, 온라인 강좌, PDF 매뉴얼 및 비공개 그룹 이용 권한도 함께 제공됩니다. 매매 기회를 찾고, 거래 계획을 확인하고, 실행 방법을 선택하세요. UNIX Scalper는 시장 분석, BUY/SELL/WAIT 판단, Entry, Stop Loss, TP1 및 TP2 가격 수준을 하나의 정돈된 패널에 제공합니다. 신호와 거래 계획을 한눈에 • 명확한 판단: BUY, SELL 또는 WAIT. • 구체적인 가격 수준: Entry, Stop Loss, TP1 및 TP2. • 다중 시간대 개요: 패널의 여러 시간대 신호를 비교하세요. • 판단을 돕는 분석: 추세, 모멘텀, 거래량, 변동성, 지지와 저항, 시장 품질. • 다양한 레이아웃: Minimized, Compact, Standard 또는 Full. 신호와
CGE Trading Suite
Carl Gustav Johan Ekstrom
5 (3)
Institutional-Grade Analytics for MT5 The full analytical edge of a professional trading desk, built into your MT5 chart. A full guided tour walks you through every feature step by step. Standard retail platforms lack the depth required for professional market analysis. The CGE Trading Suite bridges this gap, transforming MetaTrader 5 into a comprehensive workspace. By integrating 18 proprietary modules into a single, unified chart interface, the suite eliminates fragmented analysis. It provide
FX Trend MT5 NG
Daniel Stein
5 (6)
FX Trend NG: 차세대 멀티 마켓 트렌드 인텔리전스 개요 FX Trend NG 는 다중 시간 프레임 기반의 전문 트렌드 분석 및 시장 모니터링 도구입니다. 몇 초 만에 전체 시장 구조를 파악할 수 있도록 설계되었습니다. 여러 차트를 일일이 전환할 필요 없이, 어떤 종목이 추세에 있는지, 어디에서 모멘텀이 약화되고 있는지, 그리고 어떤 시간 프레임이 서로 정렬되어 있는지 즉시 확인할 수 있습니다. 출시 기념 특별 혜택 – FX Trend NG 를 $30 (6개월) 또는 $80 평생 라이선스 로 이용할 수 있습니다. 이미 Stein Investments 고객이신가요? -> 메시지를 보내 전용 고객 그룹에 참여하세요. 설정이나 사용 방법이 필요하신가요? -> Stein Investments 공식 페이지 를 방문하세요. 1. FX Trend NG가 특별한 이유 3단계 추세 로직 – 단순한 Buy / Sell이 아닙니다 • 대부분의 지표는 Buy 또는 Sell 두 가지 상태만 제
제작자의 제품 더 보기
Edge Snap Indicator
Zbynek Liska
5 (1)
FoxWave EdgeSnap — Multi-Timeframe Reversal Scanner with Quality Filter FoxWave EdgeSnap by Fox Wave watches your symbol across every timeframe simultaneously and flags the exact moment price breaks outside its dynamic volatility envelope and snaps back inside — a well-known mean-reversion pattern — then runs each signal through a quality filter before it ever reaches your eyes, so you're not chasing every minor wobble. Key features: Multi-timeframe scan (M1 through MN1, fully toggle-able) — one
Cool iExposure
Zbynek Liska
5 (1)
If you need more information than a few numbers in the iExposure index, this indicator is for you. Better iExposure indicator is an improvement over the original information, such as: Separate profit column for BUY and SELL Separate SL column for BUY and SELL Separate TP column for BUY and SEL Average Price as Horizontal Line in Chart Pip Value www.foxwave.eu
Basic tool Showing annual candle, range for Day, range for Week, range for Month, range for Year. Showing fibonacci for Day fibonacci for Week, fibonacci for Month, fibonacci for Year. Showing percent change for Day, percent change for Week, percent change for Month, percent change for Year. Showing distance of the current value the previous close for Day, Week, Month, Year.
What are Fibonacci Numbers and Lines? Fibonacci numbers are used to create technical indicators using a mathematical sequence developed by the Italian mathematician, commonly referred to as "Fibonacci," in the 13th century. The sequence of numbers, starting with zero and one, is created by adding the previous two numbers. For example, the early part of the sequence is 0, 1, 1, 2, 3, 5, 8, 13, 21, 34, 55, 89,144, 233, 377, and so on. The Fibonacci sequence is significant because of the so-calle
This is a simple and very effective utility for closing in profir or in loss. Constant overview of daily Draw Down, Current profit and Daily profit This utility will save your deposit in case of a sharp market change. Just add it to any free chart and use it for your daily trading. Thanks to the minimal set of parameters, you can easily set up the utility for any symbol in MT4
Edge Snap MT4
Zbynek Liska
oxWave EdgeSnap — Multi-Timeframe Reversal Scanner with Quality Filter FoxWave EdgeSnap by Fox Wave watches your symbol across every timeframe simultaneously and flags the exact moment price breaks outside its dynamic volatility envelope and snaps back inside — a well-known mean-reversion pattern — then runs each signal through a quality filter before it ever reaches your eyes, so you're not chasing every minor wobble. Key features: Multi-timeframe scan (M1 through MN1, fully toggle-able) — one
FOX WAVE — EDGESNAP EA Catch the reversal before everyone else. FOX WAVE – EdgeSnap EA is a fully automated multi-symbol Expert Advisor that continuously scans your entire trading universe for high-quality reversal opportunities. Instead of monitoring dozens of charts, EdgeSnap does the work for you. It ranks every valid setup, calculates the correct position size from your predefined account risk, manages trades automatically from entry to exit, and displays everything on a real-time dashboard
Exposure Command Center EA If you need more information than a few numbers in the iExposure index, this indicator is for you. Better iExposure indicator is an improvement over the original information, such as: Separate profit column for BUY and SELL Separate SL column for BUY and SELL Separate TP column for BUY and SEL Average Price as Horizontal Line in Chart Pip Value Profit https://www.facebook.com/groups/prop4y iExposure will show the opening of trading positions in tabular form in the s
Easy EA for closing positions with profit or loss. All positions of chart's symbol are counted separately. Settings: TPforSymbol — set profit amount to indicate when to close every positions for the symbol of the chart. Swap and commission are decreasing your profit. SLforSymbol — set SL amount to indicate SL for every positions for the symbol of the chart. Swap and commission are increasing your loss. SLforSyblol is always below/equal zero.
This multi-currency annual dashboard analyzes the nearest high and low to the current price for a chosen number of recent years. It displays how many pips away the price is from the nearest high or low. You can set a pip threshold, and the alert will notify you when the price gets close to the specified levels. In real-time, the dashboard also provides an overview of the closest high or low values for each specific year, helping you make informed trading decisions.
Key level analysis : The indicator tracks the nearest annual high and low to the current price over a chosen number of years. Proximity alerts : It triggers an alert when the price reaches a specified number of pips from the nearest high or low. Customizable notification intervals : You can set how often alerts repeat, for example, every 30 minutes. Historical perspective : Enables long-term tracking of market levels and effective planning of trading strategies. Multi-currency support : This ind
iExposure Fox Wave – Comprehensive Position Monitoring Indicator iExposure Fox Wave is an advanced MetaTrader indicator designed to provide detailed monitoring of all open trading positions in a clear, tabular format. This tool is perfect for traders who want all essential trade information in one place. Key Features: Symbol: Displays the instruments (currency pairs or other symbols) with open positions. Deals: Number of open trades (transactions) for each symbol. Buy lots & Buy price: Total vol
RangeDashboard – Multi-symbol Daily, Weekly, and Monthly Range Overview with Alerts RangeDashboard is a powerful and user-friendly indicator that displays the current range (high-low) of selected currency pairs or instruments over a chosen timeframe (D1, W1, MN1) directly on the chart. It allows you to input a customizable list of symbols, add suffixes if needed, and select the timeframe from which the ranges are calculated. Key Features: Dynamic calculation of ranges for any number of symbols o
Fox Wave PSAR – PSAR Dashboard for Multiple Symbols and Timeframes Description: Fox Wave PSAR is a powerful indicator for MetaTrader 5 that allows you to monitor the Parabolic SAR (PSAR) across multiple symbols and timeframes directly in a clear and convenient dashboard. It is ideal for scalping, intraday, and long-term trading strategies. Key Features: Clear dashboard with a list of symbols and their current PSAR status. Supports any number of symbols and customizable suffixes (e.g., ".m"). Di
New High / Low Dashboard Scanner is not a common indicator. It is a market-structure control system designed to monitor, in real time, the creation of new Highs and Lows across Daily, Weekly, Monthly, and Yearly time horizons — while simultaneously measuring the exact distance of price from these critical levels in pips. This tool is built for traders who do not want to react late, but instead want to stand at the origin of market movement . What the system does The dashboard continuously scan
Short Description Fox Wave Account Nexus is a professional dashboard for real-time monitoring of multiple MetaTrader 5 accounts across different terminals from a single chart. Full Description  Fox Wave Account Nexus Professional Multi-Account Monitoring Dashboard for MetaTrader 5 Fox Wave Account Nexus is a powerful visual dashboard designed for traders who operate multiple MT5 accounts simultaneously and need instant, centralized control . The indicator collects live data from all con
Fox Wave Pro Copier - Professional Multi-Master Trade Copier Copy trades from multiple Master accounts simultaneously with advanced risk management Key Features Multi-Master Architecture Copy from unlimited master accounts simultaneously Automatic master account detection or manual configuration Real-time trade synchronization via file system Independent risk management for each master Advanced Risk Management Individual risk settings per master account Automatic lot size calculation based
TREND SCANNER PRO - Multi-Timeframe Trend Analysis Dashboard Professional real-time trend scanner that monitors up to 15 currency pairs across 8 timeframes simultaneously. Get instant market overview with epic visual dashboard, smart alerts, and zero lag performance. KEY FEATURES
Professional Averaging Calculator - Essential Risk Management Tool for Every Trader Whether you're a beginner learning position averaging or a professional managing complex grid strategies, this calculator is your must-have tool. Beginners instantly see how averaging works, understand maximum loss scenarios, and learn proper risk management before entering trades - no more "I didn't know I could lose that much" surprises. Professionals save time and eliminate calculation errors with instant simu
SMC Pro — Smart Money Concepts All-in-One The only indicator you need to trade like the institutions. SMC Pro combines five core Smart Money Concepts tools into a single, clean, and fully customizable indicator for MetaTrader 5. No repainting. No clutter. Everything you need to read the market the way banks and hedge funds do. What it does Order Blocks Automatically detects bullish and bearish Order Blocks — the price zones where institutional orders were placed before a major move. The indic
Calculate the exact entry price or lot size needed to reach your target average — directly on the chart. Full description A lightweight MT5 indicator that solves a common trading problem: if I add to my position at market price, what volume do I need to reach my target average? Or the reverse: if I want to add a fixed lot size, at what price must I enter? The panel reads your open positions automatically, displays the current average entry price with a dashed line on the chart, and lets you s
Spread Recorder — Multi-Symbol Max/Min Dashboard Spread Recorder is a real-time multi-symbol dashboard that continuously monitors live spreads across your entire watchlist and permanently records the maximum and minimum spread ever seen for each symbol — with timestamps. Key features: Monitor 10, 28, 50+ symbols simultaneously from a single customizable text file Auto-adaptive grid layout — the panel automatically resizes its rows and columns to fit however many symbols you load, from a handful
Volume Suite
Zbynek Liska
FoxWave Volume Suite combines three essential volume-based tools into a single indicator: a horizontal Volume Profile with Point of Control and Value Area, a real-time volume spike detector with instant alerts, and a buy/sell pressure delta gauge. No need to run three separate indicators — everything you need to read volume is in one clean Fox Wave panel. What it does Volume Profile (POC / VAH / VAL) Builds a horizontal histogram showing how much volume traded at each price level over your cho
FoxWave SMC Trend Suite  SHORT DESCRIPTION  Smart Money Concepts trend tool: Market Structure (BOS/CHoCH), Order Blocks, FVG and EQH/EQL — fully toggleable, with alerts. FULL DESCRIPTION FoxWave SMC Trend Suite brings the four foundational building blocks of Smart Money Concepts trading into a single, clean indicator: Market Structure shifts (Break of Structure / Change of Character), Order Blocks, Fair Value Gaps, and Equal Highs/Equal Lows liquidity pools. Every component can be switched on or
Fox Wave Pattern Scanner  SHORT DESCRIPTION  Multi-timeframe candlestick pattern scanner: 24 patterns across M5-D1, live dashboard, on-chart markers, one-click TF toggles, alerts. FULL DESCRIPTION Fox Wave Pattern Scanner continuously reads your chart's symbol across six timeframes at once and reports every candlestick pattern it finds in a clean dark dashboard — so you never have to manually flip through timeframes looking for a setup again. Instead of scrolling between M5, M15, M30, H1, H4 and
Profit Loss Tracker A clean, draggable on-chart panel that shows your floating profit/loss in real time — one symbol at a time or your entire account at once — with permanent high/low watermark history and one-click close. Stop scrolling through the Trade tab or doing mental math. zProfit Loss Tracker keeps your floating P/L, your best and worst moments on every symbol, and your account health always visible in a compact, modern panel — and lets you close positions with a single click, right whe
Edge Snap
Zbynek Liska
One purchase. Two professional trading tools. Buy EdgeSnap EA today and receive this Edge Snap Indicator  as a complimentary bonus. Simply contact me on MQL5 after your purchase, and I'll send it to you personally. FOX WAVE — EDGESNAP EA A fully automated multi-symbol trading robot that scans your entire Market Watch for price-reversal setups, sizes every trade from account risk with built-in margin and volume safety caps, manages partial profit-taking and trailing on its own, and shows you e
FoxWave EdgeSnap Multi-Symbol — Scan Every Pair for Reversal Setups at Once FoxWave EdgeSnap Multi-Symbol by Fox Wave takes the same quality-filtered reversal detection from EdgeSnap and runs it across every symbol you trade at once — Market Watch or a custom list, one timeframe, one panel — so instead of flipping through 20+ charts looking for a setup, the setup finds you. Key features: Scans your entire Market Watch automatically, or a custom symbol list with broker-suffix support (up to 60 sy
Quant Analytics  Short description (for the product summary field) Quant Analytics turns your raw trade history into a full quantitative performance report — right inside MetaTrader 5. A dark, on-chart P/L calendar for daily use, plus a one-click HTML export with the same depth of analysis you'd expect from a dedicated trading journal: drawdown, Monte Carlo, Kelly, Omega, MAE/MFE, rolling Sharpe, and more. Full description See your trading the way a quant would — without leaving MetaTrader 5. Mo
DYNAMIC TARGET AND SL MATRIX REAL-TIME FOREX DISTANCE ENGINE Stop guessing your SL and TP distance. Start measuring it. Dynamic Target and SL Matrix is a professional Forex analytical tool designed to calculate and display a dynamic distance framework for SL and TP planning directly from live market conditions. The engine continuously analyzes the current BID and converts the market state into a dynamic pip-distance reference, which is then expanded through a configurable multiplier matr
필터:
리뷰 없음
리뷰 답변