Volume Spread Flow Activity MT5
- 지표
- 버전: 4.0
- 활성화: 10

Volume tells you how much activity is taking place. Spread tells you how much price is actually moving. The relationship between the two can tell you much more.
Volume Spread Flow Activity MT5 is a professional Relative Volume and Relative Spread indicator designed to reveal how current market activity compares with its recent normal behavior.
Instead of displaying raw volume alone, the indicator normalizes both Volume and candle Spread around a common 1.0 baseline, making unusual activity, expansion and contraction immediately visible.
The result is a clean analytical subwindow that helps you answer a simple but important question:
Is the price movement proportional to the activity behind it?
Relative Volume + Relative Spread
Volume Spread Flow Activity analyzes two complementary measurements:
Relative Volume
Compares the current volume with its recent average.
Volume Ratio = Current Volume / Average Volume
Relative Spread
Compares the current candle range ( High - Low ) with its recent average.
Spread Ratio = Current Spread / Average Spread
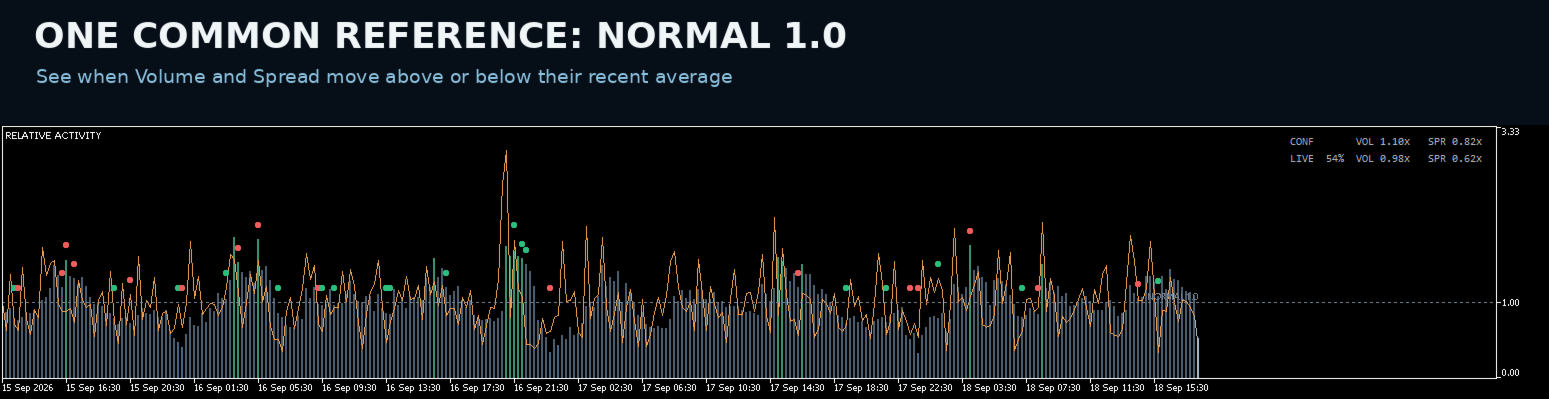
Both measurements are normalized around the same reference:
1.00 = NORMAL
This makes the indicator easy to interpret across different symbols and timeframes.
For example:
Volume 1.50x means activity is approximately 50% above its recent average.
Spread 0.70x means the candle range is approximately 30% below its recent average.
The real information comes from reading these measurements together.
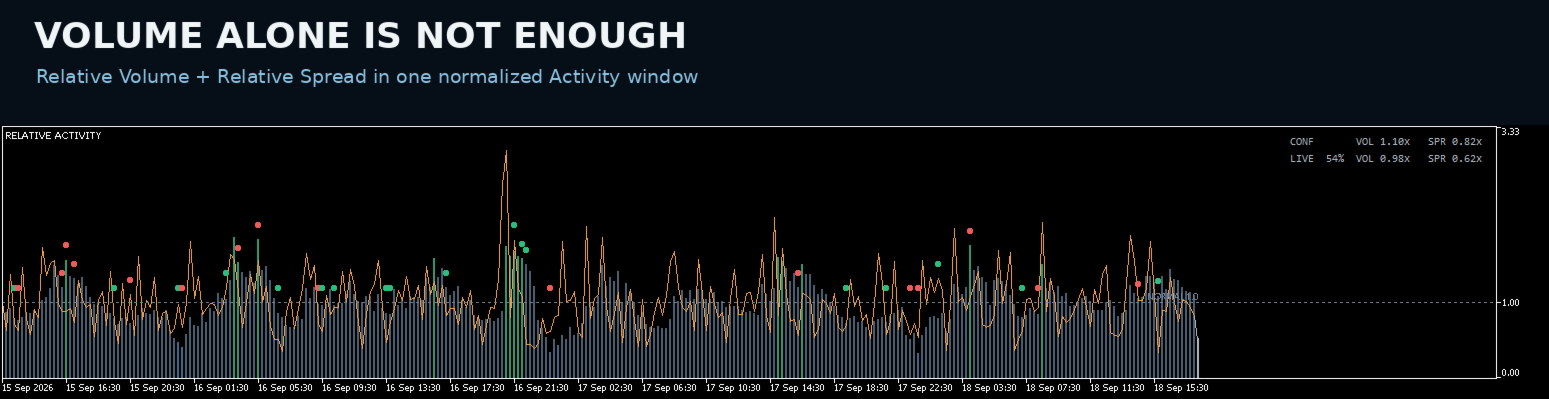
Volume alone is not enough
Two candles can show exactly the same relative volume while representing very different market conditions.
Consider:
Volume 1.80x + Spread 1.70x
versus
Volume 1.80x + Spread 0.65x
Both show elevated activity.
But in the first case, increased activity is accompanied by a large price range.
In the second, high activity produces a relatively limited price range.
Volume Spread Flow Activity makes this relationship immediately visible instead of forcing you to compare raw values manually.
A clear visual representation
The indicator uses a dedicated subwindow to keep the price chart clean.
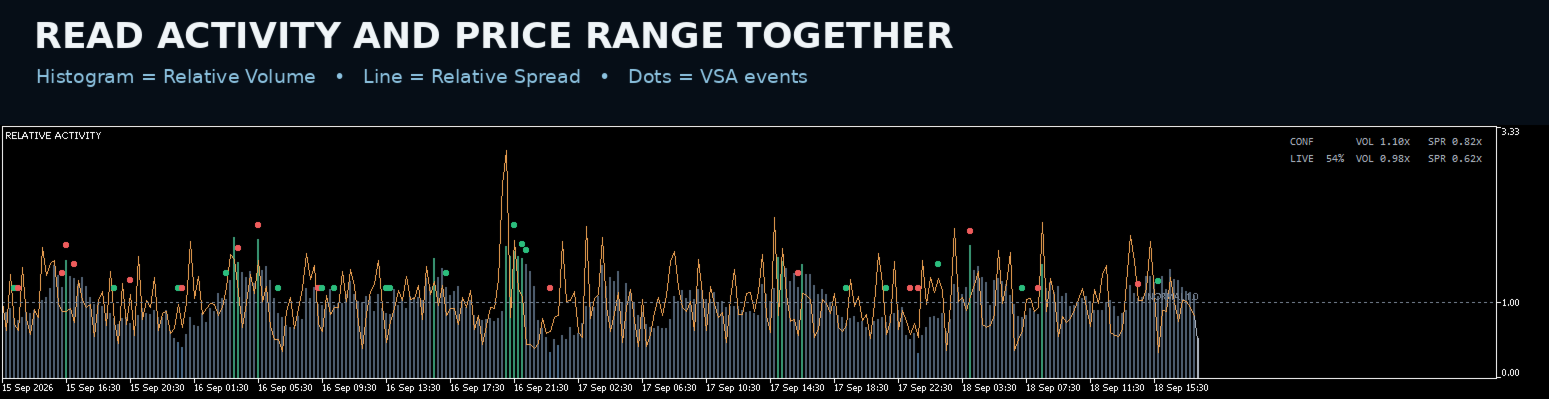
Volume Ratio is represented by a histogram, providing an immediate view of relative market activity.
Spread Ratio is represented by a separate line, allowing you to compare price-range expansion or contraction with Volume.
A permanent NORMAL 1.0 baseline provides the reference for both measurements.
This creates a simple visual framework:
Above 1.0 → above recent average
Around 1.0 → normal recent activity
Below 1.0 → below recent average
CONFIRMED and LIVE analysis
One of the key features of Volume Spread Flow Activity is the separation between completed and developing information.
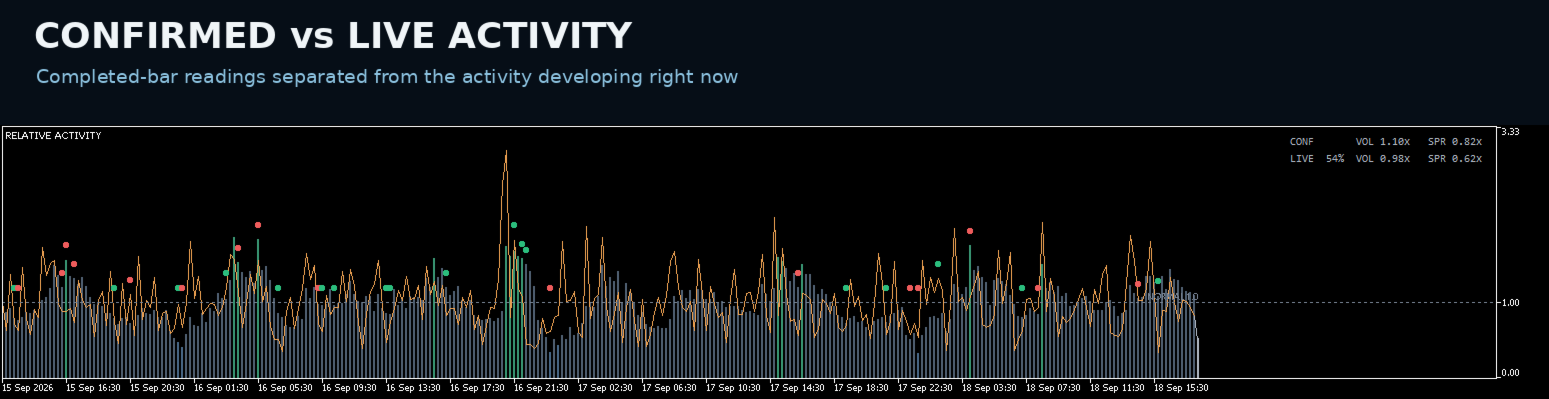
CONF shows the Relative Volume and Relative Spread readings of the last completed candle.
These values are final and no longer changing.
LIVE monitors the candle currently forming and provides an evolving view of its activity.
The percentage displayed next to LIVE indicates the progress of the current bar, helping distinguish developing activity from confirmed information.
This allows you to monitor what is happening now without confusing an unfinished candle with a completed observation.
Detect unusual activity faster
The normalized representation makes it easier to identify situations such as:
- unusually high or low market activity;
- expanding price ranges;
- contracting price ranges;
- elevated volume with limited price movement;
- strong price expansion accompanied by increased activity;
- quiet market conditions;
- changes in the relationship between activity and price movement.
The indicator does not decide what these conditions mean for your trading strategy. It makes them easier to identify and compare.
Strength and Weakness markers
Volume Spread Flow Activity can also display compact Strength and Weakness event markers within the Relative Activity window.
These markers provide additional VSA context without transforming the indicator into a conventional Buy/Sell signal generator.
They are intended to highlight analytical conditions that can then be evaluated together with Relative Volume, Relative Spread and price action.
Strength does not automatically mean Buy.
Weakness does not automatically mean Sell.
The final interpretation always belongs to the trader.
Designed for multiple markets and timeframes
Because Volume and Spread are expressed relative to their own recent averages, the indicator is designed to adapt naturally to different instruments and chart periods.
Rather than asking whether a raw volume value is "high" or "low", Volume Spread Flow Activity asks whether that value is high or low relative to the recent behavior of that specific market and timeframe.
This makes the information considerably easier to compare.
Main Features
✓ Relative Volume analysis
✓ Relative candle Spread analysis
✓ Normalized 1.0 reference level
✓ Volume Ratio histogram
✓ Spread Ratio line
✓ CONFIRMED readings for completed bars
✓ LIVE monitoring of the developing bar
✓ Current-bar progress indication
✓ Strength and Weakness event markers
✓ Clean dedicated subwindow
✓ Designed for multi-symbol and multi-timeframe analysis
✓ No automatic Buy/Sell signals
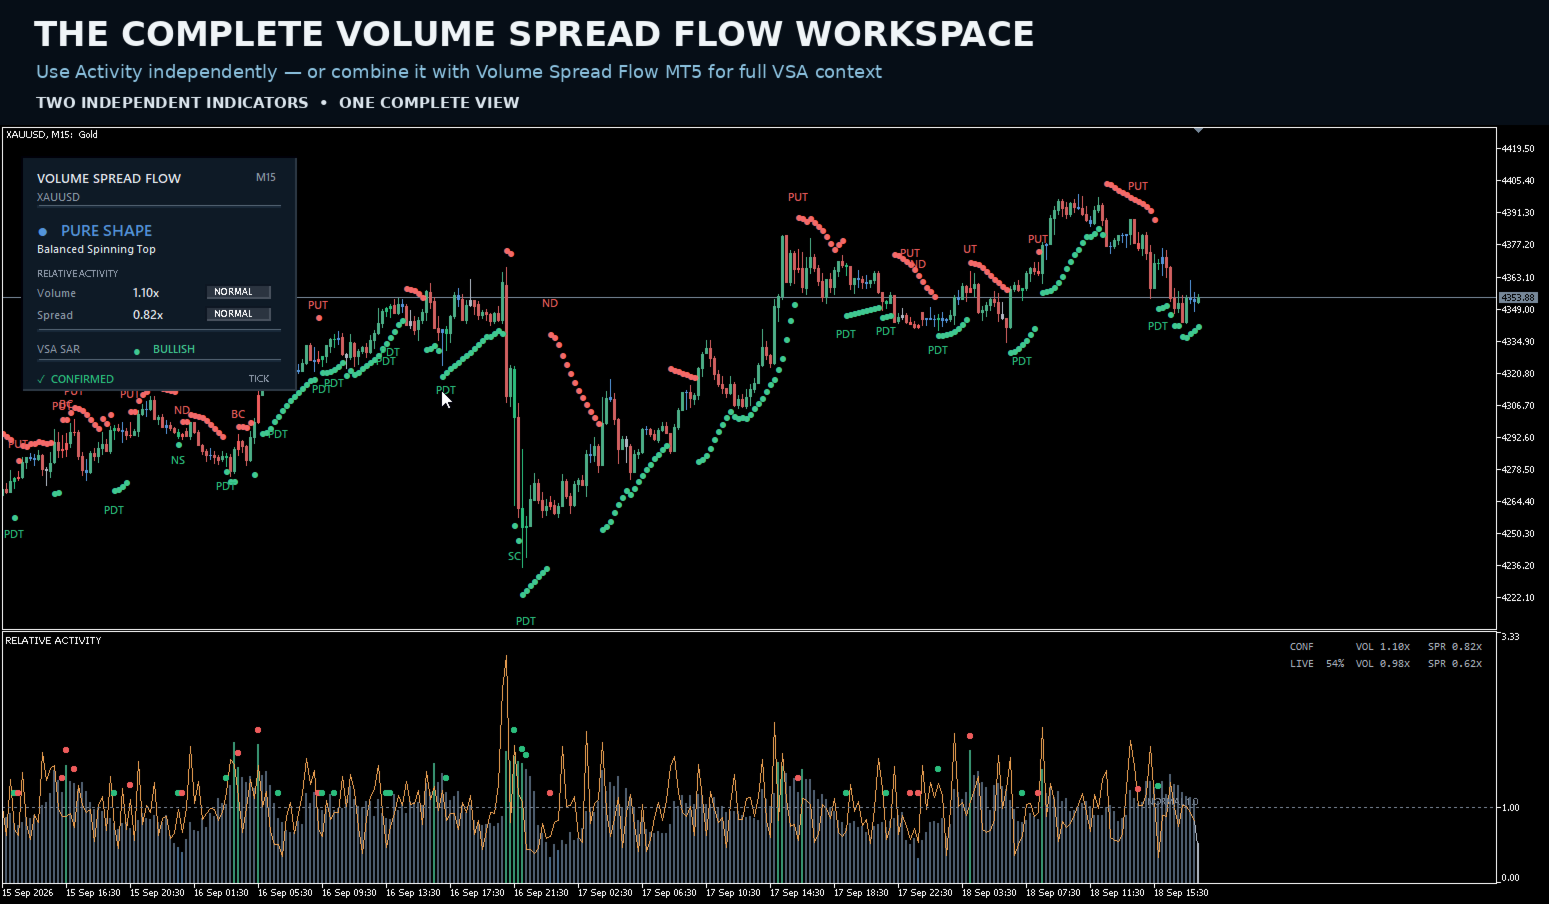
Use it independently or build the complete VSF workspace
Volume Spread Flow Activity MT5 is a completely independent indicator.
It can be used on its own by traders who want a focused view of Relative Volume and Relative Spread.
For a more complete Volume Spread Analysis workspace, it can also be combined with Volume Spread Flow MT5, which adds VSA pattern recognition, Strength/Weakness classification, VSA SAR and the main-chart analytical dashboard.
Together, the two indicators provide two complementary perspectives:
Volume Spread Flow MT5
→ What VSA condition is appearing on price?
Volume Spread Flow Activity MT5
→ How unusual are Volume and Spread right now?
Two independent indicators. One complete Volume Spread Analysis workspace.
Important
Volume Spread Flow Activity MT5 is an analytical tool and does not provide guaranteed trading signals or predictions of future market direction.
Relative Volume, Relative Spread, Strength and Weakness conditions should always be interpreted within the broader market context and according to your own trading methodology.