Pattern Scanner
- 유틸리티
- 버전: 1.0
- 활성화: 10

Multi-symbol candlestick pattern scanner with AI-powered signal strength scoring.
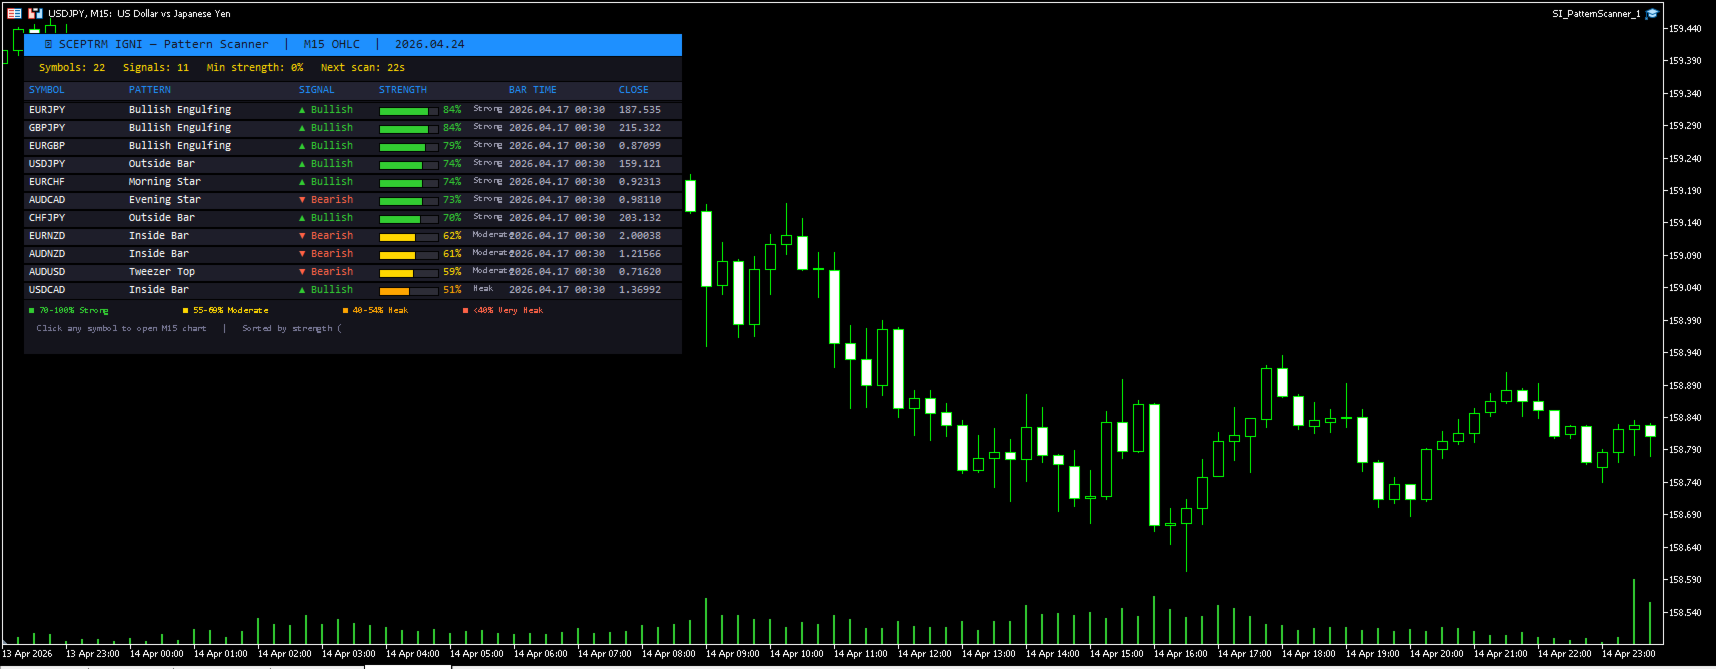
Stop checking charts one by one. The SI Pattern Scanner runs on a single chart and automatically scans every symbol in your Market Watch, detecting 21 professional candlestick patterns across your chosen timeframe. Results are displayed in a clean live dashboard, sorted by signal strength so the best opportunities always appear at the top.
How It Works
The scanner runs on a configurable timer, pulling OHLC data for every symbol in your Market Watch and running the full pattern detection engine across each one. When patterns are found, each signal is scored from 1 to 100 using a multi-factor strength algorithm — not just a raw pattern match. Results update automatically and the dashboard refreshes in real time.
Clicking any symbol row instantly opens that symbol's chart at the scanned timeframe, so you can move from signal to execution in seconds.
21 Patterns Detected
Reversal patterns: Bullish Engulfing, Bearish Engulfing, Morning Star, Evening Star, Three White Soldiers, Three Black Crows, Piercing Line, Dark Cloud Cover, Tweezer Bottom, Tweezer Top, Bullish Harami, Bearish Harami
Single-bar patterns: Hammer, Shooting Star, Pin Bar (Bullish & Bearish), Marubozu (Bullish & Bearish), Doji
Price action patterns: Inside Bar, Outside Bar
Signal Strength Scoring
Every detected pattern receives a strength score from 1 to 100, calculated using six dynamic factors:
- Base reliability — each pattern starts with a score derived from historical back-test consensus. Three White Soldiers and Three Black Crows start at 82, Morning/Evening Star at 78, Engulfing patterns at 72.
- Volume confirmation — signal bar volume compared to the 2-bar average. High volume on the signal bar adds up to 8 points. Low volume deducts up to 4.
- Body dominance — a large body relative to the total candle range signals conviction. Small indecisive bodies reduce the score.
- Wick quality — for bullish signals, a tight upper wick scores higher. For bearish signals, a tight lower wick scores higher.
- Engulf dominance — how much the signal bar's body dwarfs the prior bar, rewarding strong momentum candles.
- Trend context — reversal signals appearing against the prevailing 3-bar trend score higher than continuation signals.
Scores are bucketed into labels: Very Strong (85–100), Strong (70–84), Moderate (55–69), Weak (40–54), Very Weak (<40).
Each signal row displays a visual fill bar coloured green, gold, orange, or red corresponding to the strength bucket, so you can read the dashboard at a glance.
Dashboard
The live dashboard draws directly on your chart and shows:
- Symbol, pattern name, direction (▲ Bullish / ▼ Bearish / ◆ Neutral)
- Strength bar with percentage and bucket label
- Bar time and close price
- Total symbols scanned and signals found
- Countdown to next scan
- Colour-coded legend
Results are sorted highest strength first by default. A minimum strength filter lets you hide weaker signals — set MinStrength to 55 to show only Moderate and above.
Timeframes
Choose from four scan timeframes in the input settings:
- M5 — 5 Minute
- M15 — 15 Minute (default)
- H1 — 1 Hour
- H4 — 4 Hour
Higher timeframes produce fewer but higher quality signals. The H1 and H4 settings are recommended for swing traders. M5 and M15 suit intraday and scalping approaches.
Alerts
When new patterns are detected the scanner can:
- Display a popup alert in MT5
- Send a push notification to your mobile device
- Send an email alert
- Play a sound (disabled by default)
Alerts include the symbol name, pattern, direction, and strength percentage for the top signals found.
Settings Reference
| Parameter | Default | Description |
|---|---|---|
| ScanTimeframe | M15 | Timeframe to scan |
| ScanIntervalSeconds | 30 | How often to rescan (seconds) |
| BarsToAnalyse | 5 | Bars to look back per symbol |
| MinStrength | 0 | Minimum strength % to display |
| SortByStrength | true | Sort results highest first |
| AlertPopup | true | Popup alert on new signal |
| AlertPush | false | Push notification |
| AlertEmail | false | Email alert |
| SoundAlert | false | Sound on new signal |
| MaxRows | 25 | Maximum rows shown in dashboard |
Setup
- Attach the EA to any chart — the symbol and timeframe of the host chart do not matter.
- Ensure Allow Algo Trading is enabled in the EA settings.
- Add the symbols you want scanned to your Market Watch. The scanner reads exactly what is visible there.
- Select your preferred timeframe and set a minimum strength filter if desired.
- The dashboard will populate on the first scan cycle.
Notes
- Designed for low CPU usage. OHLC data is used rather than tick data, which is the correct data for candlestick pattern detection.
- The scanner uses a timer-based approach rather than OnTick to avoid unnecessary CPU load across large Market Watch lists.
- Compatible with all symbols and instruments available in your broker's Market Watch.
© SCEPTRM IGNI LLC — All rights reserved.