Candle Timer and Spread Display

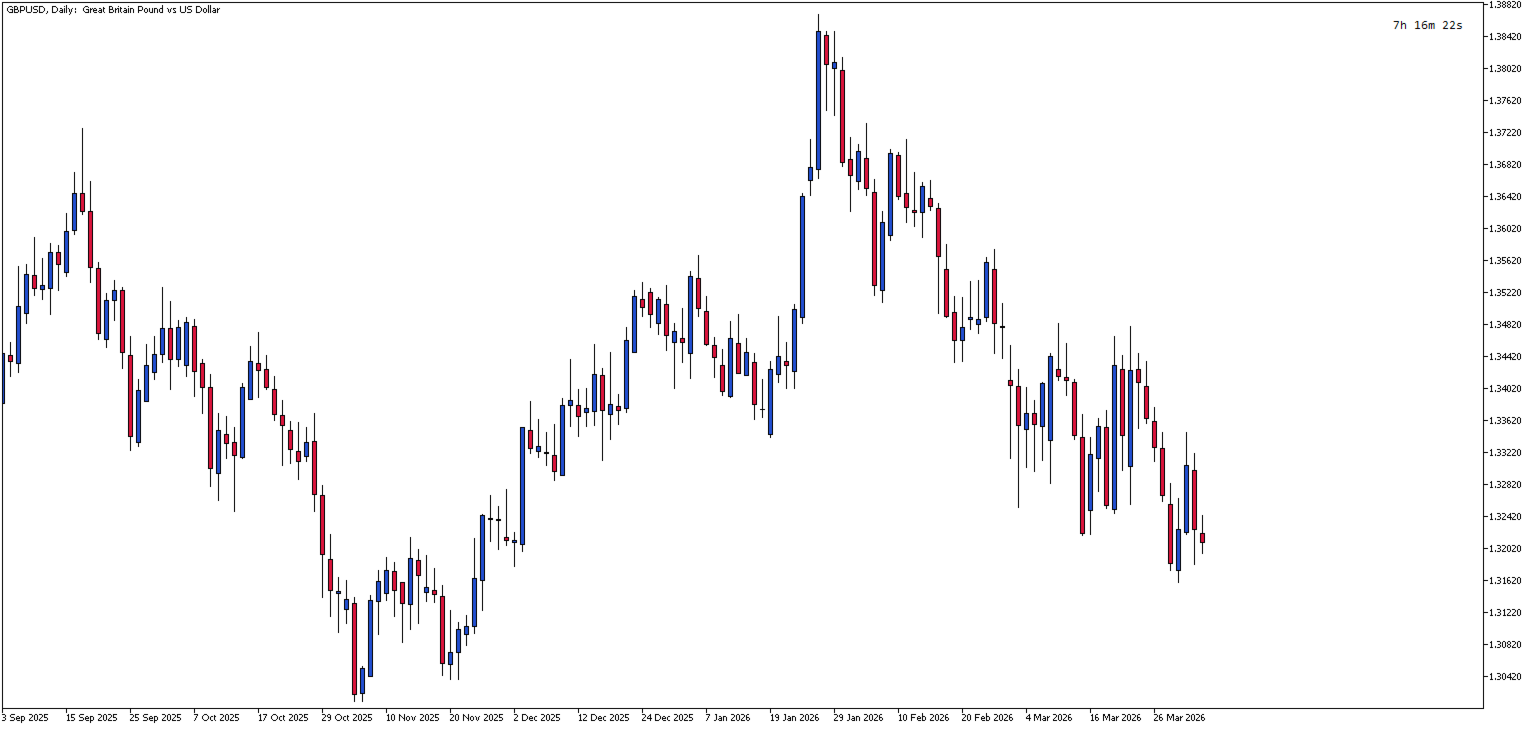
Candle Timer and Spread Display is a lightweight MetaTrader 5 indicator that shows the remaining time until the current candle closes, with an optional spread display. The indicator helps traders track candle timing and monitor spread conditions directly on the chart.

Key Features:

  • Real-time countdown timer showing hours, minutes, and seconds until candle close
  • Spread monitoring with live pip/point value display
  • Flexible positioning - place the display in any of the four chart corners
  • Customizable appearance - adjust font size, color, and type
  • Manual offset control - fine-tune exact X/Y positioning when needed
  • Clean, non-intrusive design - doesn't interfere with chart analysis
  • Multi-timeframe support - works on all timeframes from M1 to Monthly
  • Low resource consumption - optimized for minimal CPU usage

Use Cases:

  • Scalpers who need precise timing for entries and exits
  • News traders monitoring spread conditions during volatile periods
  • Day traders managing position timing before candle closes
  • Any trader who wants to avoid entering positions just before candle close
Input Parameters:

  • Show Spread (default: `false`) — Enables/disables the spread display. When enabled, shows the current spread in points below the timer. Useful for monitoring broker spreads during news events or volatile market conditions.
  • Manual Offset (default: `false`) — Enables manual positioning mode. When set to `true`, uses custom X/Y offset values instead of automatic positioning. Allows fine-tuned placement to avoid overlap with other chart objects or indicators.
  • X_Offset (default: `90`) — Horizontal distance in pixels from the selected corner. Only active when `ManualOffset` is `true`. Increase to move the display further from the corner edge; decrease to move it closer.
  • Y_Offset (default: `15`) — Vertical distance in pixels from the selected corner. Only active when `ManualOffset` is `true`. Adjust to position the display higher or lower relative to the corner.
  • Font Size (default: `9`) — Font size in points for both timer and spread text. Use smaller values for compact display or larger values for better visibility on high-resolution screens.
  • Font Color (default: `clrBlack`) — Text color for both timer and spread display. Choose a color that contrasts with your chart background for optimal readability.
  • Font Name (default: `Consolas`) — Font family for the display text. Monospace fonts (Consolas, Courier New, Lucida Console) provide consistent character width and alignment.
  • Corner (default: `CORNER_RIGHT_UPPER`) — Screen corner for display placement. Options: `CORNER_LEFT_UPPER`, `CORNER_RIGHT_UPPER`, `CORNER_LEFT_LOWER`, `CORNER_RIGHT_LOWER`. Timer always displays above the spread in all corners.

추천 제품
This indicator customizes the volume candles to match the color of the price candle. If it's a bullish candle, the volume candle will be green... And if it's a bearish candle, the volume candle will be red... Very useful for seeing the dominant trend at a glance... You can customize the color of the volume candles, their thickness, style, and even the timeframes you want them displayed on... It's like the default MT5 Volume indicator, but this one has the option to customize colors and styles...
CoioteOscilator
Alexandre Moraes De Souza Lima
CoioteOscilator é um rastreador de tendência e padrões de estruturas gráficas. O Indicador é composto de 3 elementos. oscilador principal lento: histograma com nível de 0 até 50 e 4 cores, 2 compradoras, de 0 até 30 e acima de 30 e duas vendedoras, de 0 até 30 e acima de 30.   oscilador principal  rápido: linha magenta com nível de -50 até 50. gatilho:  linha amarela com nível de -50 até 50. O  oscilador principal lento  é um rastreador de tendência primaria. O  oscilador   principal  rápido é u
A Média Móvel é um indicador que faz parte da Análise Técnica. Com ela, é possível identificar o equilíbrio dos preços no mercado, observando tendências de alta, neutra ou baixa. Este indicador customizado traz opções extras pera definir o método de cálculo podendo-se esclolher entre SMA,EMA,SSMA,LWMA,JJMA,JurX,ParMA,T3,Vidya,AMA,HULL MA. Também conta com varias opções para escolher o método de cálculo para o preço base a ser usado no cáculo da média.
Prime Flow
Simon Draxler
DRX PRIME FLOW 는 시장 구조와 변동성 변화를 차트에서 직접 시각화하도록 설계된 자동 적응형 시장 분석 시스템입니다. 가이드 및 매뉴얼: 여기를 클릭하세요 수동 보정 대신, 이 시스템은 백그라운드에서 현재 자산의 변동성에 적응하는 동적 알고리즘을 사용합니다. 골드, 암호화폐, 통화 및 지수에서 파라미터 튜닝 없이 원활하게 작동합니다. 핵심 기능 자동 적응형 존(Zones): 지표는 시장 변동성에 따라 확장 및 수축하는 동적 밴드를 표시합니다. 내부 존: 시장이 균형 상태입니다. 외부 존: 시장이 과매수/과매도 상태 – 반전 또는 풀백(Pullback) 가능성. 스마트 배경 시각화: 차트 배경색을 사용하여 시장 단계를 알립니다. 색상 A (예: 녹색): 가격이 하단 극단에 도달 (잠재적 매수 구간). 색상 B (예: 적색): 가격이 상단 극단에 도달 (잠재적 매도 구간). 중립: 가격이 정상 범위 내에 있습니다. 대시보드 패널: 중앙 HUD 패널이 현재 추세 방향과 흐름 상
CCI Fixed Dual
Edoardo Centorame
CCI FIXED DUAL이란 무엇인가 CCI FIXED DUAL은 전문적인 Trend Direction Filter로서, 다음 요소를 정확하게 식별하도록 설계되었습니다. 시장의 지배적인 방향 움직임의 구조적 품질 주요 추세와 가속 구간 사이의 일관성 이것은 직접적인 진입 지표가 아닙니다. 이것은 전통적인 오실레이터가 아닙니다. 이것은 컨텍스트 도구로서, 트레이더가 언제 거래해야 하고 언제 거래하지 말아야 하는지를 결정하도록 돕기 위해 설계되었으며, 시장의 노이즈와 해석 오류를 크게 줄여줍니다. CCI FIXED DUAL의 기본 철학 CCI FIXED DUAL이 기반으로 하는 원칙은 단순하지만 강력합니다. 신호는 시장 구조와 일치할 때만 가치가 있습니다. 이러한 이유로 이 지표는 단일 값을 사용하지 않습니다 가격에 충동적으로 반응하지 않습니다 억지 반전 지점을 찾지 않습니다 대신 다음 요소를 기반으로 계층적인 추세 해석을 구축합니다. Typical Price 기반 CCI 서로 다른
XOATRHIST 5
Ainur Sharipov
3 (1)
Version for MetaTrader 5. The indicator is based on point and figure chart, but their period is equal to ATR indicator values. Displays in the form of steps. Steps above zero indicate an uptrend. Below zero on a downtrend. Parameters: ATRPeriod - ATR period for calculation of steps. Note: The indicator uses closes price, thus it is recommended to consider completed bars.
Daily Variation Indicator Daily Variation Indicator shows the percentage difference between the current price and the previous day close. The indicator displays the daily market movement directly on the chart, allowing traders to quickly identify whether the market is moving up or down during the current trading session. It is designed to be lightweight, minimal, and highly configurable while providing clear information about the daily price variation. Features • Displays daily percentage variat
SMC Osw
William Oswaldo Mayorga Urduy
Smart Money Osw: 기관 알고리즘의 심장 Smart Money Osw는 스마트 머니 개념(SMC) 방법론을 전문적인 정밀도로 자동화하도록 설계된 고급 구조 분석 도구입니다. 이 지표는 시장의 주요 변곡점을 자동으로 식별하고 구조 붕괴, 성격 변화 및 기관 공급 및 수요 구역을 실시간으로 감지하여 트레이더가 대형 은행 및 투자 펀드와 동일한 시각으로 운영할 수 있도록 합니다. 전문화된 매개변수 가이드 ZZDepth: 가장 중요한 구조적 지지 및 저항 수준을 식별하기 위해 스캔 깊이를 설정합니다. ZZDesviation: 시장 노이즈를 필터링하고 실제 움직임에 집중하기 위해 가격 변동성에 대한 민감도를 정의합니다. ZZBackStep: 기관 구조에서 새로운 고점 또는 저점을 검증하는 데 필요한 최소 되돌림을 결정합니다. AlertBOS: 추세 지속을 나타내는 구조 붕괴(BOS) 신호를 활성화하거나 비활성화합니다. AlertCHOCH: 주요 추세 반전 가능성을 알리는 성격
FlagTrend TF
Dorival Cardozo
FlagTrendTF Free Indicator for MetaTrader 5 FlagTrendTF is a free MetaTrader 5 indicator designed to help traders identify market trends across multiple timeframes quickly and visually. It is ideal for confirming whether the market direction is aligned from higher timeframes down to the trading timeframe. How FlagTrendTF Works The indicator allows you to monitor up to 4 timeframes simultaneously , displaying easy-to-read arrows: Green arrow : bullish trend Red arrow : bearish trend This fa
FREE
Session Map Visual Trading Sessions
Alejandro Yesid Linero Montropez
Know exactly when the market is active. Session Map displays the major Forex trading sessions directly on your chart and in a live panel. WHAT IT SHOWS ON THE CHART: - Colored background boxes for each session: Tokyo (blue), London (green), New York (orange) - London and New York overlap highlighted in yellow — the most volatile period of the day - Draws the last 3 days automatically so you can compare session behavior WHAT THE PANEL SHOWS: - Live server time clock updated every second - Stat
FREE
Order Book, known also as Market Book, market depth, Level 2, - is a dynamically updated table with current volumes of orders to buy and to sell specific financial instument at price levels near Bid and Ask. MetaTrader 5 provides the means for receiving market book from your broker, but in real time only, without access to its history. The indicator OrderBook Cumulative Indicator accumulates market book data online and visualizes them on the chart. In addition, the indicator can show the market
Boleta de negociação, adiciona automáticamente as ordens Take Profit e Stop Loss quando excutada uma ordem de compra ou venda. Ao apertar as teclas de atalho (A, D, ou TAB), serão inseridas duas linhas de pre-visualização, representando as futuras ordens de take profit (azul) e stop loss (vermelho), as quais irão manter o distanciamento especificado pelo usuário. Ditas ordens só serão adicionadas ao ser executada a ordem inicial. Ao operar a mercado, as ordens pendentes de take profit, e stop lo
Reactivity
Vincent Jose Proenca
반응성 지표 – MT5용 경제 이벤트 시장 반응 측정 반응성 지표 는 경제 캘린더 이벤트에 대한 시장 반응을 실시간으로 분석하고 정량화합니다. 주요 경제 발표 후 10초, 30초, 60초 시점의 가격 변동(핍 단위)을 자동으로 측정합니다. 주요 기능  이벤트 자동 수집 MT5 기본 캘린더 API와 통합되어 외부 설정이 필요 없음.  뉴스 후 변동성 정밀 측정 뉴스 발표 후 가격 움직임 속도(핍/분)를 계산.  비교 분석 국가 및 이벤트 유형별로 유사 이벤트의 과거 시장 반응과 비교.  사전 시장 평가 이벤트 15분 전 시장 상태(스프레드, 변동성, 예상 영향)를 분석.  사용자 정의 알림 시스템 사운드, 팝업, 이메일, 푸시 알림 지원.  데이터 저장 모든 측정값을 CSV 형식으로 자동 저장하여 후속 분석 가능.  지능형 필터링 중요도(1~3성) 및 관련 통화별 이벤트 필터링 가능. 실용성 이 지표는 트레이더가 경제 뉴스에 대한 시장 반응을 객관적으로 정량화 하고, 역사
AUTO RISK MANAGER PRO: 포렉스 거래에서 당신의 파트너! AUTO RISK MANAGER PRO_MT4 — MT4용 버전 데모 버전 + 자세한 설명 감정 때문에 돈을 잃는 것을 멈추세요! 이제 전문가 알고리즘에게 리스크 관리를 맡길 때입니다. 한번 상상해 보세요: 시장이 갑자기 당신의 포지션  으로 움직이는데, 그 순간 당신은 잠을 자거나, 일하거나, 가족과 시간을 보내고 있습니다. 익숙한 이야기인가요? Auto Risk Manager Pro — 더 이상 그렇지 않습니다! 장점 혁신적인 리스크 관리 접근 방식 24/7 자동 자본 보호 당신이 컴퓨터 앞에 없을 때도 작동 정확한 이익 목표 — 필요한 순간에 수익 고정 엄격한 손실 제한 — 치명적인 손실을 차단 멀티통화 지원 — 모든 거래 상품과 호환 차트를 닫아 EA까지 함께 언로드 가능 컨트롤 패널 Control Panel Settings PanelColor = clrDarkSlateGray; — 패널 색상
Micro Volume
Aleksandr Goryachev
Volumes  ******************* Volumes для платформы секундных графиков Micro . ********************* Секундный график на порядок увеличит точность ваших входов и выходов. Секундный период , в привычном формате,   позволит увидеть то, что ранее было скрыто. Бесплатные индикаторы, дополнят визуальную картину, что, в совокупности выведет вашу торговлю на новый уровень. Идеально подходит как скальперам, так и трейдерам торгующим внутри дня.  Индикатор Volumes  для платформы Micro. Входные парам
FREE
Real-Time Spread Display Tool A   real-time spread display tool   is a specialized software or application designed to provide traders and investors with instant, live data on the   spread —the difference between the bid price (the price at which buyers are willing to purchase an asset) and the ask price (the price at which sellers are willing to sell it)—for various financial instruments. This tool is critical in markets such as forex (FX), stocks, futures, and cryptocurrencies, where price f
1. Overview Thank you for choosing the SuperTrend Suite for MT5. This package provides a set of powerful tools for trend analysis, designed to integrate seamlessly into your MetaTrader 5 platform. This suite includes two components: SuperTrend Indicator : A robust trend-following indicator that displays the current market trend directly on your chart, complete with entry signals and alerts. SuperTrend Screener EA : A multi-symbol dashboard that scans a user-defined list of instruments in the bac
FREE
CurvedSmoothChannel_Enhanced - Enhanced Price Channel Indicator **CurvedSmoothChannel_Enhanced** is a powerful and visually appealing price channel indicator designed for MetaTrader 5 that helps you identify trends, potential reversals, and key price levels with precision. This enhanced version combines the power of the Hull Moving Average (HMA) and John Ehlers' Super Smooth Filter, creating a dynamic, adaptive channel that adjusts to market conditions across multiple time frames. #### Key Fea
MultiSession Volume Profile is a professional volume profile indicator for MetaTrader 5 that builds separate POC, VAH, VAL and volume histograms for multiple custom trading sessions on the same chart. It helps you see where volume truly concentrated in each part of the day (RTH, Globex, Asia, London, etc.), so you can identify key intraday levels, ranges, and magnets that many standard tools miss. ​ Main advantages Multi-session profiles Build up to 5 fully independent sessions with custom times
Wolf Countdown
Tiziano Zambelli Sopalu
Wolf Countdown helps you not to waste the right amount of time, it gives you back the time remaining until the candle closes. How to use: Download and install the  Wolf Countdown Indicator on your MetaTrader 5. Apply the indicator to your favorite chart. this works on any timeframe... Thanks to this indicator you will never miss the right moment to enter your trades.
FREE
Volume Statistic
Syamsurizal Dimjati
5 (1)
Ritz Volume Statistic – Color Volume Histogram & Market Flow Insight Ritz Volume Statistic is a clean and powerful volume analysis indicator designed to visualize bullish and bearish market pressure through a dynamic color-graded volume histogram . The indicator transforms raw tick volume into an intuitive color spectrum , allowing traders to instantly identify volume expansion, exhaustion, and dominance shifts between buyers and sellers. A built-in statistical panel summarizes total volume, bul
FREE
Price Position Indicator
Lamont Simone Reynecke
Price Position Indicator.... This indicator tells you exactly when to buy or sell in the market with alerts, it works on any time frame and with any market of your choice, it is highly accurate and is definitely worth the investment, this indicator performs well with the moving average indicator i also have for sale, be sure to check out my profile to see my products. it gives out buy and sell signals based on where the current price is, it follows the trend as well.
ICT Fair Value Gap Indicator
David Muriithi
4.64 (11)
An ICT fair value gap is a trading concept that identifies market imbalances based on a three-candle sequence. The middle candle has a large body while the adjacent candles have upper and lower wicks that do not overlap with the middle candle. This formation suggests that there is an imbalance where buying and selling powers are not equal. Settings Minimum size of FVG (pips) -> FVGs less than the indicated pips will be not be drawn Show touched FVGs Normal FVG color -> color of FVG that hasn't
FREE
Smart Trend Targets MT5
Bruno Fernandes Dos Santos
Smart Trend Targets MT5 Smart Trend Targets MT5 is a professional trend-following indicator with automatic volatility-based targets (ATR). It was designed for traders who want clear entries, clean chart visualization and automatic target projections without complexity. The indicator combines: Dynamic trend line Colored candles based on direction Visual BUY and SELL signals Two automatic target levels Optional trading session filter Pop-up, Sound and Mobile alerts HOW IT WORKS The system uses ATR
Tick Bars
Henrique Helmuth Kreutz Pfeifer
Indicator that show candlestick bars with an different sampling method than time fixed. Real time data is sourced to the indicator and it may be used as substitute of the default graph. Each bar is formed when a predefined amount of ticks is received, showing in the graph the OHLC of this clusteri of ticks. The input variable is the amount of ticks of each bar. It's a different approach of sampling, the amount of bars is proportional to the amount of negotiations insted of a sample in a fixed am
FREE
WinWiFi Ultra Signal
Nirundorn Promphao
"We have developed a highly accurate trading signal system applicable to all assets on the 15-minute (M15) timeframe. Calibrated against actual Gold price behavior, this system allows users to trade every candlestick effectively, regardless of market conditions—whether the market is trending, moving sideways, or reversing. The system features real-time arrows and color-coded indicators that signal immediate Buy or Sell entry points. This allows traders to use it as a reliable confirmation tool t
FREE
Power Signal
Medina Cortez Edison Armando
Este indicador es una herramienta avanzada de análisis técnico de confluencias diseñada para MetaTrader 5. Su objetivo principal es identificar puntos de reversión o continuación de alta probabilidad mediante la alineación precisa de osciladores clásicos y la acción del precio. 1. Concepto Operacional A diferencia de los indicadores que analizan señales aisladas, este sistema solo genera una señal cuando existe una "alineación perfecta" entre el impulso, la fuerza relativa y la tendencia dentr
FREE
Buy Sell Smart
Syamsurizal Dimjati
BUY and SELL smart The BUY and SELL Smart Indicator is a next-generation trading tool engineered for precision scalpers, intraday strategists, and professional analysts who demand both speed and clarity in market visualization. It seamlessly integrates smart candle-based analytics, adaptive ATR logic, and real-time economic event awareness — giving you a fully synchronized view of market volatility and momentum. Through an elegant and optimized interface, FlashScalp delivers   instant signal fee
Wedge Pattern MT5
Sathit Sukhirun
Korean 이 보조지표는 차트 패턴 거래를 즐기는 트레이더를 위한 고급 차트 분석 비서 역할을 합니다. 시각적 분석의 부담을 줄이고 수익 창출의 정확성을 높이도록 설계되었습니다. 실제 사용 관점에서 본 이 보조지표의 주요 장점과 특징입니다: 1. 자동 패턴 감지 (Automated Pattern Detection) 시간 절약 및 편향(Bias) 감소: 수동으로 추세선을 그릴 필요가 없습니다. 인디케이터가 가격 스윙(Pivot High/Low)을 검색하고 가격 구조가 조건에 부합할 때 라이징 웨지(Rising Wedge, 상승 쐐기형) 및 폴링 웨지(Falling Wedge, 하락 쐐기형) 구조를 자동으로 그립니다. 모든 상황 포괄: 패턴이 형성되는 중, 브레이크아웃(돌파), 심지어 실패한 패턴까지 감지할 수 있어 시장의 전반적인 흐름을 명확하게 파악할 수 있습니다. 2. 내장된 목표가 및 피보나치 익절 (Built-in Targets & Fibonacci TP) 자동 목표가 계산:
Let us introduce the Heikin Ashi RSI Oscillator! This indicator combines the concepts of Heikin Ashi candles with the RSI (Relative Strength Index) to produce an oscillator-like format that can be used to filter out some of the noise associated with standard RSI readings. This provides traders with a smoother representation of market conditions. Here are some articles to read more about the RSI and Heikin Ashi candles: https://www.investopedia.com/terms/r/rsi.asp https://www.investopedia.com/ter
이 제품의 구매자들이 또한 구매함
SuperScalp Pro
Van Minh Nguyen
4.63 (24)
SuperScalp Pro – 고급 멀티 필터 스캘핑 지표 시스템 SuperScalp Pro는 클래식 Supertrend와 여러 지능형 확인 필터를 결합한 고급 스캘핑 지표로, 거래 기회를 식별하는 데 도움을 줍니다. M1부터 H4까지 다양한 시간대에서 효율적으로 작동하며, XAUUSD, BTCUSD 및 주요 Forex 통화쌍에 최적화되어 있습니다. 이 지표는 명확한 매수 및 매도 신호를 제공하며, ATR 기반으로 진입가, 손절가, 익절가를 자동 계산하여 보다 효과적인 리스크 관리를 지원합니다. Fibonacci Take Profit 기능은 중요한 가격 구간에서 더 빠르게 포지션을 청산할 수 있도록 하며, 해당 수준 도달 시 알림을 전송합니다. 기본 설정은 Fibonacci Take Profit이 활성화된 상태로 최적화되어 있으며, 보다 안정적이고 일관된 거래 경험에 중점을 둡니다. 차트에 적용하는 것만으로 즉시 사용할 수 있습니다. 고급 사용자를 위해 모든 파라미터는 자유롭게 사용
Divergence Bomber
Ihor Otkydach
4.9 (89)
이 지표를 구매하신 분께는 다음과 같은 혜택이 무료로 제공됩니다: 각 거래를 자동으로 관리하고, 손절/익절 수준을 설정하며, 전략 규칙에 따라 거래를 종료하는 전용 도우미 툴 "Bomber Utility" 다양한 자산에 맞게 지표를 설정할 수 있는 셋업 파일(Set Files) "최소 위험", "균형 잡힌 위험", "관망 전략" 모드로 설정 가능한 Bomber Utility의 셋업 파일 이 전략을 빠르게 설치, 설정, 시작할 수 있도록 돕는 단계별 영상 매뉴얼 주의: 위의 모든 보너스를 받기 위해서는 MQL5 개인 메시지 시스템을 통해 판매자에게 연락해 주세요. 독창적인 커스텀 지표인 “Divergence Bomber(다이버전스 봄버)”를 소개합니다. 이 지표는 MACD 다이버전스(괴리) 전략을 기반으로 한 올인원(All-in-One) 거래 시스템입니다. 이 기술 지표의 주요 목적은 가격과 MACD 지표 간의 다이버전스를 감지하고, **향후 가격이 어느 방향으로 움직일지를 알려주는
ARIPoint
Temirlan Kdyrkhan
1 (1)
ARIPoint is a powerful trading companion designed to generate high-probability entry signals with dynamic TP/SL/DP levels based on volatility. Built-in performance tracking shows win/loss stats, PP1/PP2 hits, and success rates all updated live. Key Features: Buy/Sell signals with adaptive volatility bands Real-time TP/SL/DP levels based on ATR Built-in MA Filter with optional ATR/StdDev volatility Performance stats panel (Success, Profit/Loss, PP1/PP2) Alerts via popup, sound, push, or email Cu
Entry In The Zone and SMC Multi Timeframe is a real-time 2-in-1 market analysis tool that combines market structure analysis and a No Repaint BUY / SELL signal system into a single indicator, built on Smart Money Concepts (SMC) — a widely adopted framework used by professional traders to understand market structure. This indicator helps you see the market more clearly, make decisions based on structure rather than guesswork, and focus on high-probability zones where price is more likely to react
SignalTech MT5
Yue Wang
5 (21)
SignalTech MT5 is an unique fully rule based trading system for EURUSD, USDCHF, USDJPY, AUDUSD, NZDUSD, EURJPY, AUDJPY, NZDJPY, CADJPY.  All the winning trades with chart setups are published on the comments page. 2026-05 3173 Pips (Until 05-18 NY Closed) 2026-04 2243 Pips 2026-03 2165 Pips 2026-02 2937 Pips 2026-01 2624 Pips 2025-12 1174 Pips It can generate signals with Buy/Sell Arrows and Pop-Up/Sound Alerts. Each signal has clear Entry and Stop Loss levels, which should be automatically flag
Power Candles MT5
Daniel Stein
5 (8)
Power Candles V3 - 자체 최적화 강도 지표 파워 캔들 V3는 적용된 모든 차트에서 통화 및 상품의 강세를 실행 가능한 거래 계획으로 전환합니다. 단순히 캔들에 색상을 입히는 대신, 백그라운드에서 실시간 자동 최적화를 수행하여 현재 보고 있는 종목에 대한 최적의 손절매, 익절 및 신호 임계값을 제공합니다. 한 번의 클릭으로 실시간 거래에 적용할 수 있으며, 진입점, 손절매 및 익절 선이 정확한 가격에 맞춰 차트에 표시되고, 방향과 함께 알림이 발령됩니다. 이 도구는 Stein Investments 에코시스템의 일부입니다. 18개 이상의 도구와 함께 당신의 1대1 AI 트레이딩 멘토 Max.  항상 대기 중, 모든 인디케이터를 깊이 있게 이해, 무언가를 차근차근 생각해보고 싶은 순간에 도움을 줍니다.  https://stein.investments 에서 만나보세요 매 종가 바마다 3,000회 이상의 트레이딩 시뮬레이션. 9가지 강도 상태. 2가지 전략을 병렬로 테스트.
이 지표를 구매하면 제 프로페셔널 트레이드 매니저를 무료로 드립니다. 우선 이 거래 시스템이 리페인팅, 리드로잉 및 레이그 인디케이터가 아니라는 점을 강조하는 것이 중요합니다. 이는 수동 및 로봇 거래 모두에 이상적인 것으로 만듭니다. 온라인 강좌, 설명서 및 프리셋 다운로드. "스마트 트렌드 트레이딩 시스템 MT5"은 새로운 및 경험이 풍부한 트레이더를 위해 맞춤형으로 제작된 종합적인 거래 솔루션입니다. 10개 이상의 프리미엄 인디케이터를 결합하고 7개 이상의 견고한 거래 전략을 특징으로 하여 다양한 시장 조건에 대한 다목적 선택이 가능합니다. 트렌드 추종 전략: 효과적인 트렌드 추이를 타기 위한 정확한 진입 및 손절 관리를 제공합니다. 반전 전략: 잠재적인 트렌드 반전을 식별하여 트레이더가 범위 시장을 활용할 수 있게 합니다. 스캘핑 전략: 빠르고 정확한 데이 트레이딩 및 단기 거래를 위해 설계되었습니다. 안정성: 모든 인디케이터가 리페인팅, 리드로잉 및 레이그가 아니므로 신뢰
SMC Intraday Formula
Kareem Abbas
5 (9)
먼저 솔직하게 말하겠습니다. 어떤 인디케이터도 단독으로 당신을 수익성 있게 만들어주지 않습니다. 누군가 그렇게 말한다면, 그는 당신에게 꿈을 파는 것입니다. 완벽한 매수/매도 화살표를 보여주는 모든 인디케이터는 완벽하게 보이도록 만들 수 있습니다 — 단지 올바른 과거 구간을 확대하고 승리한 거래만 캡처하면 됩니다. 우리는 그렇게 하지 않습니다.  SMC Intraday Formula는 도구입니다. 시장 구조를 읽고, 가장 높은 확률의 가격 구간을 표시하며, 현재 스마트 머니의 흐름이 어떻게 보이는지 아주 단순한 언어로 보여줍니다. 최종 결정은 여전히 당신이 합니다. 실행도 당신이 합니다. 하지만 이제는 희망이 아니라 정확성으로 거래하게 됩니다. 우리는 이 인디케이터를 지난 약 3년 동안 골드(XAUUSD) 및 주요 외환 통화쌍의 데이 트레이딩 스캘핑에 사용해 왔습니다. M1, M5, M15, M30에서 우리의 핵심 도구입니다. 이 도구는 미래를 예측하려 하지 않습니다 — 지금 형성
Gann Made Easy MT5
Oleg Rodin
5 (4)
Gann Made Easy 는 mr.의 이론을 사용하여 최고의 거래 원칙을 기반으로 하는 전문적이고 사용하기 쉬운 Forex 거래 시스템입니다. W.D. 간. 이 표시기는 Stop Loss 및 Take Profit Levels를 포함하여 정확한 BUY 및 SELL 신호를 제공합니다. PUSH 알림을 사용하여 이동 중에도 거래할 수 있습니다. 구매 후 거래 방법 안내 및 유용한 추가 지표를 무료로 받으시려면 저에게 연락주세요! 아마도 Gann 거래 방법에 대해 이미 여러 번 들었을 것입니다. 일반적으로 Gann의 이론은 초보자 거래자뿐만 아니라 이미 거래 경험이 있는 사람들에게도 매우 복잡한 것입니다. Gann의 거래 방식은 이론적으로 적용하기 쉽지 않기 때문입니다. 나는 그 지식을 연마하고 Forex 지표에 최고의 원칙을 적용하기 위해 몇 년을 보냈습니다. 표시기는 적용하기가 매우 쉽습니다. 차트에 첨부하고 간단한 거래 권장 사항을 따르기만 하면 됩니다. 지표는 지속적으로 시장 분석
소개       Quantum Breakout PRO   , 브레이크아웃 존 거래 방식을 변화시키는 획기적인 MQL5 지표! 13년 이상의 거래 경험을 가진 숙련된 트레이더 팀이 개발한       퀀텀 브레이크아웃 PRO       혁신적이고 역동적인 브레이크아웃 존 전략으로 거래 여정을 새로운 차원으로 끌어올리도록 설계되었습니다. Quantum Breakout Indicator는 5개의 이익 목표 영역이 있는 브레이크아웃 영역의 신호 화살표와 브레이크아웃 상자를 기반으로 한 손절 제안을 제공합니다. 초보자 거래자와 전문 거래자 모두에게 적합합니다. Quantum EA 채널:       여기를 클릭하세요 중요한! 구매 후 설치 매뉴얼을 받으려면 개인 메시지를 보내주십시오. 추천: 기간: M15 통화쌍: GBPJPY, EURJPY, USDJPY,NZDUSD, XAUUSD 계정 유형: 스프레드가 매우 낮은 ECN, Raw 또는 Razor 브로커 시간: GMT +3 중개인 :
Trend Screener Pro MT5
STE S.S.COMPANY
4.85 (104)
트렌드 표시기, 트렌드 트레이딩 및 필터링을 위한 획기적인 고유 솔루션, 하나의 도구 안에 내장된 모든 중요한 트렌드 기능! Forex, 상품, 암호 화폐, 지수 및 주식과 같은 모든 기호/도구에 사용할 수 있는 100% 다시 칠하지 않는 다중 시간 프레임 및 다중 통화 표시기입니다. Trend Screener는 차트에 점이 있는 화살표 추세 신호를 제공하는 효율적인 지표 추세 추종 지표입니다. 추세 분석기 표시기에서 사용할 수 있는 기능: 1. 트렌드 스캐너. 2. 최대 이익 분석이 있는 추세선. 3. 추세 통화 강도 측정기. 4. 경고가 있는 추세 반전 점. 5. 경고가 있는 강력한 추세 점. 6. 추세 화살표 Trend Screener Indicator가 있는 일일 분석 예, 일일 신호 성능...등은 여기에서 찾을 수 있습니다. 여기를 클릭하십시오. LIMITED TIME OFFER : Trend Screener Indicator는 50$ 및 평생 동안만 사용할 수 있습니다.
Azimuth Pro
Ottaviano De Cicco
5 (7)
Azimuth Pro V2: Synthetic Fractal Structure and Confirmed Entries for MT5 Overview Azimuth Pro is a multi-level swing structure indicator by Merkava Labs . Four nested swing layers, swing-anchored VWAP, ABC pattern detection, three-timeframe structural filtering, and closed-bar confirmed entries — one chart, one workflow from micro-swings to macro-cycles. This is not a blind signal product. It is a structure-first workflow for traders who care about location, context, and timing. V2 Launch Offe
Meridian Pro
Ottaviano De Cicco
5 (2)
Meridian Pro 2.00: Professional Multi-Timeframe Trend Matrix for MT5 Meridian Pro 2.00 is a professional adaptive trend matrix for MetaTrader 5. It combines the original Meridian trend engine, a clean chart ribbon, closed-bar signal arrows, an 8-timeframe dashboard, Fuel momentum, weighted consensus, synthetic HTF processing and chart-native higher-timeframe context lines. The goal is simple: read current trend, multi-timeframe structure, strength, momentum and EA-ready state from one discipline
우선적으로, 이 거래 도구는 전문적인 거래에 이상적인 비-다시 그리기 및 지연되지 않는 지표입니다.  온라인 강좌, 사용자 매뉴얼 및 데모. 스마트 가격 액션 컨셉트 인디케이터는 신규 및 경험 많은 트레이더 모두에게 매우 강력한 도구입니다. Inner Circle Trader Analysis 및 Smart Money Concepts Trading Strategies와 같은 고급 거래 아이디어를 결합하여 20가지 이상의 유용한 지표를 하나로 결합합니다. 이 인디케이터는 스마트 머니 컨셉트에 중점을 두어 대형 기관의 거래 방식을 제공하고 이동을 예측하는 데 도움을 줍니다.  특히 유동성 분석에 뛰어나 기관이 어떻게 거래하는지 이해하는 데 도움을 줍니다. 시장 트렌드를 예측하고 가격 변동을 신중하게 분석하는 데 탁월합니다. 귀하의 거래를 기관 전략에 맞추어 시장의 동향에 대해 더 정확한 예측을 할 수 있습니다. 이 인디케이터는 시장 구조를 분석하고 중요한 주문 블록을 식별하고 다양
FX Trend MT5 NG
Daniel Stein
5 (4)
FX Trend NG: 차세대 멀티 마켓 트렌드 인텔리전스 개요 FX Trend NG 는 다중 시간 프레임 기반의 전문 트렌드 분석 및 시장 모니터링 도구입니다. 몇 초 만에 전체 시장 구조를 파악할 수 있도록 설계되었습니다. 여러 차트를 일일이 전환할 필요 없이, 어떤 종목이 추세에 있는지, 어디에서 모멘텀이 약화되고 있는지, 그리고 어떤 시간 프레임이 서로 정렬되어 있는지 즉시 확인할 수 있습니다. 출시 기념 특별 혜택 – FX Trend NG 를 $30 (6개월) 또는 $80 평생 라이선스 로 이용할 수 있습니다. 이미 Stein Investments 고객이신가요? -> 메시지를 보내 전용 고객 그룹에 참여하세요. 설정이나 사용 방법이 필요하신가요? -> Stein Investments 공식 페이지 를 방문하세요. 1. FX Trend NG가 특별한 이유 3단계 추세 로직 – 단순한 Buy / Sell이 아닙니다 • 대부분의 지표는 Buy 또는 Sell 두 가지 상태만 제
Market Structure Order Block Dashboard MT5는 시장 구조와 주요 가격 반응 구역을 차트에서 직접 읽고자 하는 트레이더를 위해 설계된 MT5 지표입니다. BOS, ChoCH, 오더 블록, Fair Value Gap (FVG), 유동성, Kill Zones, Volume Profile 그리고 빠른 분석을 위한 콤팩트한 대시보드를 결합합니다. 이 지표는 시장 구조, ICT 및 Smart Money 개념을 의사결정 프레임워크로 사용하는 트레이더를 대상으로 합니다. 추세 지속, 가능한 반전, 가격 불균형, 유동성 타겟 및 관심 구역을 보다 체계적으로 식별하는 데 도움을 줄 수 있습니다. 구매자를 위한 포함 리소스 구매 후 MQL5 개인 메시지로 요청하시면 완전한 PDF 사용 설명서와 파라미터 설정 팁을 제공해 드립니다. MQL5 개인 메시지를 통한 직접 기술 지원. 1.20 버전은 두 가지 주요 추가 기능을 제공합니다: Pending BOS / Pending
KT Alpha Hunter Arrows MT5
KEENBASE SOFTWARE SOLUTIONS
대부분의 화살표 인디케이터는 신호만 보여주고, 나머지 판단은 모두 트레이더에게 맡깁니다. KT Alpha Hunter Arrows는 완성된 트레이딩 플랜을 제공합니다. 각 신호 화살표가 표시될 때마다 진입선, 손절선, 네 개의 익절 목표, 그리고 현재 심볼과 시간대가 지금 거래할 가치가 있는지 알려주는 실시간 엣지 판정이 함께 그려집니다. 포함된 Trade Manager EA는 사용자가 직접 진입한 뒤의 실행 관리를 맡아, 시장이 흔들리고 감정이 개입되기 쉬운 상황에서도 거래 원칙을 유지할 수 있도록 도와줍니다. 리페인트 없음. 종가 확정 후 신호만 표시. Forex, Gold, Indices 및 사용자가 거래하는 다양한 MT5 지원 상품에 맞게 설계되었습니다. 주요 기능 캔들이 마감된 후에만 표시되는 리페인트 없는 매수 및 매도 화살표. 각 신호마다 진입선, 구조적 손절선, 네 개의 익절 목표 표시. 현재 차트에서 매수와 매도 셋업을 별도로 평가하는 Edge Dashboard.
Gem SIGNAL
Shengzu Zhong
5 (1)
GEM Signal Pro GEM Signal Pro는 MetaTrader 5용 추세추종형 지표로, 차트에서 더 명확한 신호, 더 구조적인 트레이드 설정, 그리고 더 실용적인 리스크 관리를 원하는 트레이더를 위해 설계되었습니다. 단순한 화살표만 표시하는 것이 아니라, GEM Signal Pro는 전체 트레이드 아이디어를 더 깔끔하고 읽기 쉬운 방식으로 보여줍니다. 조건이 확인되면 진입가, 손절가, 목표가를 차트에 표시하여 트레이더가 설정을 더 효율적으로 검토할 수 있도록 도와줍니다. 작동 방식 이 지표는 먼저 내부 로직에 따라 유효한 초기 신호를 식별합니다. 확인 조건이 충족되면, GEM Signal Pro는 차트에 전체 설정을 표시합니다. 이를 통해 트레이더는 거래 구조를 더 명확하게 보고, 수동 분석 작업을 줄일 수 있습니다. 차트에 표시되는 거래 레벨 확인된 신호에 대해, GEM Signal Pro는 다음을 표시할 수 있습니다. 진입가 손절가 목표가 1 목표가 2 목표가 3 손
Entry Points Pro for MT5
Yury Orlov
4.48 (138)
다시 색을 칠하지 않고 거래에 진입할 수 있는 정확한 신호를 제공하는 MT5용 지표입니다. 외환, 암호화폐, 금속, 주식, 지수 등 모든 금융 자산에 적용할 수 있습니다. 매우 정확한 추정값을 제공하고 매수와 매도의 가장 좋은 시점을 알려줍니다. 하나의 시그널로 수익을 내는 지표의 예와 함께 비디오 (6:22)시청하십시오! 대부분의 거래자는 Entry Points Pro 지표의 도움으로 첫 거래 주 동안 트레이딩 결과를 개선합니다. 저희의   Telegram Group 을 구독하세요! Entry Points Pro 지표의 좋은점. 재도색이 없는 진입 신호 신호가 나타나고 확인되면(시그널 캔들이 완성된 경우) 신호는 더 이상 사라지지 않습니다. 여타 보조지표의 경우 신호를 표시한 다음 제거되기 때문에 큰 재정적 손실로 이어집니다. 오류 없는 거래 게시 알고리즘을 통해 트레이드(진입 또는 청산)를 할 이상적인 순간을 찾을 수 있으며, 이를 통해 이를 사용하는 모든 거래자의 성공률이
Basic Harmonic Patterns Dashboard MT5
Mehran Sepah Mansoor
4.36 (11)
이 대시보드는 선택한 심볼에 대해 사용 가능한 최신 고조파 패턴을 표시하므로 시간을 절약하고 더 효율적으로 사용할 수 있습니다 /   MT4 버전 . 무료 인디케이터:   Basic Harmonic Pattern 인디케이터 열 Symbol :   선택한 심볼이 나타납니다 Trend :   강세 또는 약세 Pattern :   패턴 유형(가틀리, 나비, 박쥐, 게, 상어, 사이퍼 또는 ABCD) Entry :   진입 가격 SL:   스톱로스 가격 TP1:   1차 테이크프로핏 가격 TP2:   2차 테이크프로핏 가격 TP3:   3차 테이크프로핏 가격 Current price:   현재 가격 Age (in bars):   마지막으로 그려진 패턴의 나이 주요 입력 Symbols :   "28개 주요 통화쌍" 또는 "선택한 심볼" 중에서 선택합니다. Selected Symbols :   쉼표로 구분하여 모니터링하려는 원하는 심볼("EURUSD,GBPUSD,XAUUSD")을 선택
Btmm state engine pro
Garry James Goodchild
5 (4)
BTMM State Engine Pro is a MetaTrader 5 indicator for traders who use the Beat The Market Maker approach: Asian session context, kill zone timing, level progression, peak formation detection, and a multi-pair scanner from a single chart. It combines cycle state logic with a built-in scanner dashboard so you do not need the same tool on many charts at once. What it does Draws the Asian session range; session times can follow broker server offset or be set in inputs. Tracks level progression (L
Quantum TrendPulse
Bogdan Ion Puscasu
5 (25)
SuperTrend   ,   RSI   ,   Stochastic   의 힘을 하나의 포괄적인 지표로 결합하여 트레이딩 잠재력을 극대화하는 궁극의 트레이딩 도구   인 Quantum TrendPulse를   소개합니다. 정밀성과 효율성을 추구하는 트레이더를 위해 설계된 이 지표는 시장 추세, 모멘텀 변화, 최적의 진입 및 종료 지점을 자신 있게 식별하는 데 도움이 됩니다. 주요 특징: SuperTrend 통합:   주요 시장 추세를 쉽게 따라가고 수익성의 물결을 타세요. RSI 정밀도:   매수 과다 및 매도 과다 수준을 감지하여 시장 반전 시점을 파악하는 데 적합하며 SuperTrend 필터로 사용 가능 확률적 정확도:   변동성이 큰 시장에서 숨겨진 기회를 찾기 위해 확률적 진동   을 활용하고 SuperTrend의 필터로 사용 다중 시간대 분석:   M5부터 H1 또는 H4까지 다양한 시간대에 걸쳐 시장을 최신 상태로 유지하세요. 맞춤형 알림:   맞춤형 거래 조건이 충족되면
Trend Forecaster
Alexey Minkov
5 (7)
Trend Forecaster – Since 2023. The Trend Forecaster indicator utilizes a unique proprietary algorithm to determine entry points for a breakout trading strategy. The indicator identifies price clusters, analyzes price movement near levels, and provides a signal when the price breaks through a level. The Trend Forecaster indicator is suitable for all financial assets, including currencies (Forex), metals, stocks, indices, and cryptocurrencies. You can also adjust the indicator to work on any time
Atomic Analyst MT5
Issam Kassas
3.94 (31)
우선적으로 언급할 점은이 거래 지표가 다시 그리지 않고 지연되지 않으며 이를 통해 수동 및 로봇 거래 모두에 이상적이라는 점입니다. 사용자 매뉴얼: 설정, 입력 및 전략. Atomic Analyst는 가격의 강도와 모멘텀을 활용하여 시장에서 더 나은 이점을 찾는 PA Price Action Indicator입니다. 고급 필터를 장착하여 잡음과 거짓 신호를 제거하고 거래 잠재력을 높이는 데 도움이 됩니다. 복잡한 지표의 다중 레이어를 사용하여 Atomic Analyst는 차트를 스캔하고 복잡한 수학적 계산을 간단한 신호와 색상으로 변환하여 초보 트레이더가 이해하고 일관된 거래 결정을 내릴 수 있도록합니다. "Atomic Analyst"는 새로운 및 경험이 풍부한 트레이더를위한 종합적인 거래 솔루션입니다. 프리미엄 지표와 최고 수준의 기능을 하나의 거래 전략에 결합하여 모든 종류의 트레이더에 대한 다재다능한 선택지가되었습니다. 인트라데이 거래 및 스캘핑 전략 : 빠르고 정확한 일일
OrderFlux | MetaTrader 5용 풋프린트 오더플로우 버전 2.0 – 액티브 트레이더를 위한 실시간 Bid/Ask 시각화 OrderFlux는 MT5를 위한 풋프린트 및 오더플로우 지표입니다. 가격이 어디로 이동했는지뿐만 아니라, 그 움직임 내부에서 어떤 일이 발생하고 있는지(가격 수준별 Bid/Ask 거래량, 델타, 임밸런스, 거래량 분포)를 보여줍니다. 많은 차트가 캔들의 최종 결과만 보여줍니다. OrderFlux는 그곳에 도달하기까지의 과정을 보여줍니다. 이것이 바로 캔들 모양뿐만 아니라 시장 참여자들의 동향을 읽고자 할 때 정확히 도움이 되는 부분입니다. 라이브 차트에서 OrderFlux는 주로 다음 세 가지 질문에 답합니다: 현재 어디에서 공격적인 매수 또는 매도 압력이 시장에 진입하고 있는가? 어떤 가격 수준에서 거래량이 흡수되거나 거부되고 있는가? 현재의 움직임이 세션 컨텍스트(배경)에 어떻게 부합하는가? 인터페이스에서 제공되는 기능 메인 차트는 Canvas
FX Power MT5 NG
Daniel Stein
5 (31)
FX Power: 통화 강세 분석으로 더 스마트한 거래 결정을 개요 FX Power 는 어떤 시장 상황에서도 주요 통화와 금의 실제 강세를 이해하기 위한 필수 도구입니다. 강한 통화를 매수하고 약한 통화를 매도함으로써 FX Power 는 거래 결정을 단순화하고 높은 확률의 기회를 발견합니다. 트렌드를 따르거나 극단적인 델타 값을 사용해 반전을 예측하고자 한다면, 이 도구는 귀하의 거래 스타일에 완벽히 적응합니다. 단순히 거래하지 말고, FX Power 로 더 스마트하게 거래하세요. 1. FX Power가 거래자에게 매우 유용한 이유 통화와 금의 실시간 강세 분석 • FX Power 는 주요 통화와 금의 상대적 강세를 계산하고 표시하여 시장 역학에 대한 명확한 통찰력을 제공합니다. • 어떤 자산이 앞서고 있고 어떤 자산이 뒤처지는지 모니터링하여 보다 현명한 거래 결정을 내릴 수 있습니다. 포괄적인 멀티 타임프레임 뷰 • 단기, 중기 및 장기 타임프레임에서 통화와 금의 강세를
Grabber System MT5
Ihor Otkydach
4.83 (23)
탁월한 기술적 지표인 Grabber를 소개합니다. 이 도구는 즉시 사용 가능한 “올인원(All-Inclusive)” 트레이딩 전략으로 작동합니다. 하나의 코드 안에 강력한 시장 기술 분석 도구, 매매 신호(화살표), 알림 기능, 푸시 알림이 통합되어 있습니다. 이 인디케이터를 구매하신 모든 분들께는 다음의 항목이 무료로 제공됩니다: Grabber 유틸리티: 오픈 포지션을 자동으로 관리하는 도구 단계별 영상 매뉴얼: 설치, 설정, 그리고 실제 거래 방법을 안내 맞춤형 세트 파일: 인디케이터를 빠르게 자동 설정하여 최고의 성과를 낼 수 있도록 도와줍니다 다른 전략은 이제 잊어버리세요! Grabber만이 여러분을 새로운 트레이딩의 정점으로 이끌어 줄 수 있습니다. Grabber 전략의 주요 특징: 거래 시간 프레임: M5부터 H4까지 거래 가능한 자산: 어떤 자산이든 사용 가능하지만, 제가 직접 테스트한 종목들을 추천드립니다 (GBPUSD, GBPCAD, GBPCHF, AUDCAD, AU
RelicusRoad Pro MT5
Relicus LLC
4.96 (24)
RelicusRoad Pro: 퀀트 시장 운영 체제 70% 할인 평생 이용권 (한정 시간) - 2,000명 이상의 트레이더와 함께하세요 왜 대부분의 트레이더는 "완벽한" 지표를 가지고도 실패할까요? 진공 상태에서 단일 개념 만으로 거래하기 때문입니다. 문맥 없는 신호는 도박입니다. 지속적인 승리를 위해서는 컨플루언스(중첩) 가 필요합니다. RelicusRoad Pro는 단순한 화살표 지표가 아닙니다. 완전한 퀀트 시장 생태계 입니다. 독점적인 변동성 모델링을 사용하여 가격이 이동하는 "공정 가치 로드"를 매핑하고, 단순 노이즈와 실제 구조적 돌파를 구분합니다. 추측은 그만두세요. 기관급 로드 로직으로 거래를 시작하세요. 핵심 엔진: "Road" 알고리즘 시스템의 중심에는 시장 상황에 실시간으로 적응하는 동적 변동성 채널인 Road Algo 가 있습니다. 세이프 라인(평형) 과 가격이 수학적으로 반전될 가능성이 높은 확장 레벨 을 투영합니다. Simple Road: 일반적인 시장을 위
구매 후 연락해 주시면 이 지표를 기반으로 한 EA(자동매매 프로그램)를 무료 보너스로 제공해 드립니다. ChandraSAR Optimizer: 자가 적응형 퀀트 추세 엔진 대부분의 추세 지표가 실패하는 이유는 간단합니다. 시장은 변하지만, 정적인 매개변수(파라미터)는 변하지 않기 때문입니다. ChandraSAR Optimizer 는 단순한 신호 생성과 고급 알고리즘 테스트 사이의 격차를 해소합니다. 매우 효율적인 배열(Array) 기반의 전진 분석(Walk-Forward) 최적화 엔진을 차트에 직접 내장하여 변동성 변화 문제를 해결하는 MetaTrader 5용 동적 추세 추종 시스템입니다. 샹들리에 청산(Chandelier Exit)의 정밀도와 파라볼릭 SAR(Parabolic SAR)의 모멘텀 추적 기능을 결합한 ChandraSAR는 단순히 신호만 생성하지 않습니다. 이 지표는 지속적으로 자체 매개변수를 테스트하고 평가하여 현재 시장 체제에 맞게 조정합니다. 어떠한 수동 개입
Hydra Trend Rider is a non-repainting, multi-timeframe trend indicator that delivers precise buy/sell signals and real-time alerts for high-probability trade setups. With its color-coded trend line, customizable dashboard, and mobile notifications, it's perfect for traders seeking clarity, confidence, and consistency in trend trading. Setup & Guide:  Download  MT4 Version here. To learn how to use the Indicator: Indicator Manual & Guide -   Read Here Follow our MQL5 channel for daily market ins
제작자의 제품 더 보기
Trades History Visualizer is a MetaTrader 5 indicator that displays your trading history directly on the chart, providing a clear visual representation of past trades with additional information. Key Features: Visual trade history display with entry arrows Entry, Stop Loss, and Take Profit horizontal lines Color-coded connector lines between entry and exit points (green for profit, red for loss) Risk-Reward ratio display for each closed trade Profit/Loss amount display option Pip display option
DrillDown Timeframe is a MetaTrader 5 utility that enables seamless navigation between higher and lower timeframes with visual area highlighting. Draw a rectangle on any timeframe and instantly drill down to see the same price region on a lower timeframe. How it works: Set the Higher and Lower Timeframes in the indicator's variables (Example 1h / 15min) On the selected higher timeframe, press 'B' to create a draggable/resizable rectangle (Blue) in the visible chart area.  Select (double click o
Quick Symbol Switcher is a lightweight MetaTrader 5 indicator that provides fast, keyboard-driven symbol switching directly from your chart. Type a prefix or alias, click or navigate with arrow keys, and instantly switch to any symbol in your Market Watch. Key Features: Instant Symbol Search: Type any prefix to filter symbols in real-time Keyboard Navigation: Use arrow keys to browse, Enter to select, Escape to close Mouse Click Support: Click any item in the dropdown menu to switch instantly Ca
Center Watermark is a lightweight and unobtrusive indicator that displays a customizable watermark text in the center of your MetaTrader 5 chart. Perfect for traders who want to clearly identify the current symbol and timeframe at a glance, or for content creators who need to brand their chart screenshots and recordings. This utility runs efficiently with zero indicator buffers and automatically centers itself on any chart size. The watermark stays in the background and does not interfere with c
Apply Template to All Charts is a lightweight MetaTrader 5 utility script that instantly applies a chart template to all open charts with a single execution. Perfect for traders who manage multiple charts and want to maintain consistent visual settings, indicators, and color schemes across their entire workspace. The script automatically detects the correct template path and apply the. It provides detailed feedback including the template location, list of open charts, and success/failure counts.
Crosshair Sync is a lightweight MetaTrader 5 utility that synchronizes your crosshair position across all open charts in real-time. When analyzing multiple timeframes or symbols, simply press Shift+X to activate the synchronized crosshair, and move your mouse to see the exact same time point highlighted on every chart simultaneously. Key Features: Multi-Chart Synchronization : Automatically syncs the vertical time line across all open charts, allowing you to analyze the same time point on differ
Position Tool Visualizer is a visual trading utility for MetaTrader 5 that helps traders plan and manage their risk-reward ratios directly on the chart. The tool provides three draggable horizontal lines for Entry, Stop Loss, and Take Profit levels, along with filled rectangles showing the risk and reward zones. Key Features: Three Draggable Lines — Entry (blue), Stop Loss (red), and Take Profit (green) lines that can be moved freely on the chart Automatic RR Calculation — Displays the risk-rewa
Currency Strength Monitor is a professional multi-currency strength indicator for MetaTrader 5 that analyzes and displays the relative strength of 8 major currencies (USD, EUR, GBP, AUD, NZD, JPY, CHF, CAD) in real-time. The indicator calculates strength values by aggregating price movements across 28 currency pairs and normalizing them using ATR, providing traders with a clear visual representation of which currencies are strengthening or weakening. Key Features: Multi-Currency Analysis — Monit
Volume with EMA is a professional volume indicator for MetaTrader 5 that displays tick volume with a configurable Exponential Moving Average (EMA) overlay. The indicator enhances volume analysis by color-coding bars based on candle direction and their position relative to the EMA, providing traders with clear visual cues for volume strength and market momentum. Key Features: Volume Histogram with Candle-Matched Colors — Volume bars are color-coded based on candle direction (bullish/bearish), mak
EMA Toggle
Wael Tahar
EMA Toggle is a lightweight MetaTrader 5 indicator that displays up to 5 customizable Exponential Moving Averages (EMAs) with instant keyboard-toggle visibility. Each EMA can be independently configured with its own period, color, line width, and style, and toggled on/off using dedicated keyboard shortcuts for rapid chart customization during analysis. if you value a clean chart but still benefit from using EMAs, then this indicator is for you. Toggle on each EMA easily via the keyboard shortcut
EMA Zone
Wael Tahar
EMA Zone is a professional technical indicator for MetaTrader 5 that visualizes the relationship between two Exponential Moving Averages (EMAs) by displaying a filled zone between them. This visual representation helps traders quickly identify trend direction, momentum strength, and potential pullback continuation zones. Key Features: Dual EMA Visualization — Displays both Fast and Slow EMA lines with customizable periods Zone Fill — Automatically fills the area between the two EMAs, making tren
Volume Peak Zone is a professional MetaTrader 5 indicator that automatically identifies and visualizes high-volume price zones based on volume profile analysis. The indicator calculates volume distribution across specified price levels and highlights the zones with the highest trading activity, helping traders identify key support and resistance areas / Supply and Demand. Key Features: Dual Timeframe Support — Analyze volume zones from two independent timeframes simultaneously Flexible Range Sel
필터:
리뷰 없음
리뷰 답변