Daily ATR Range Plus

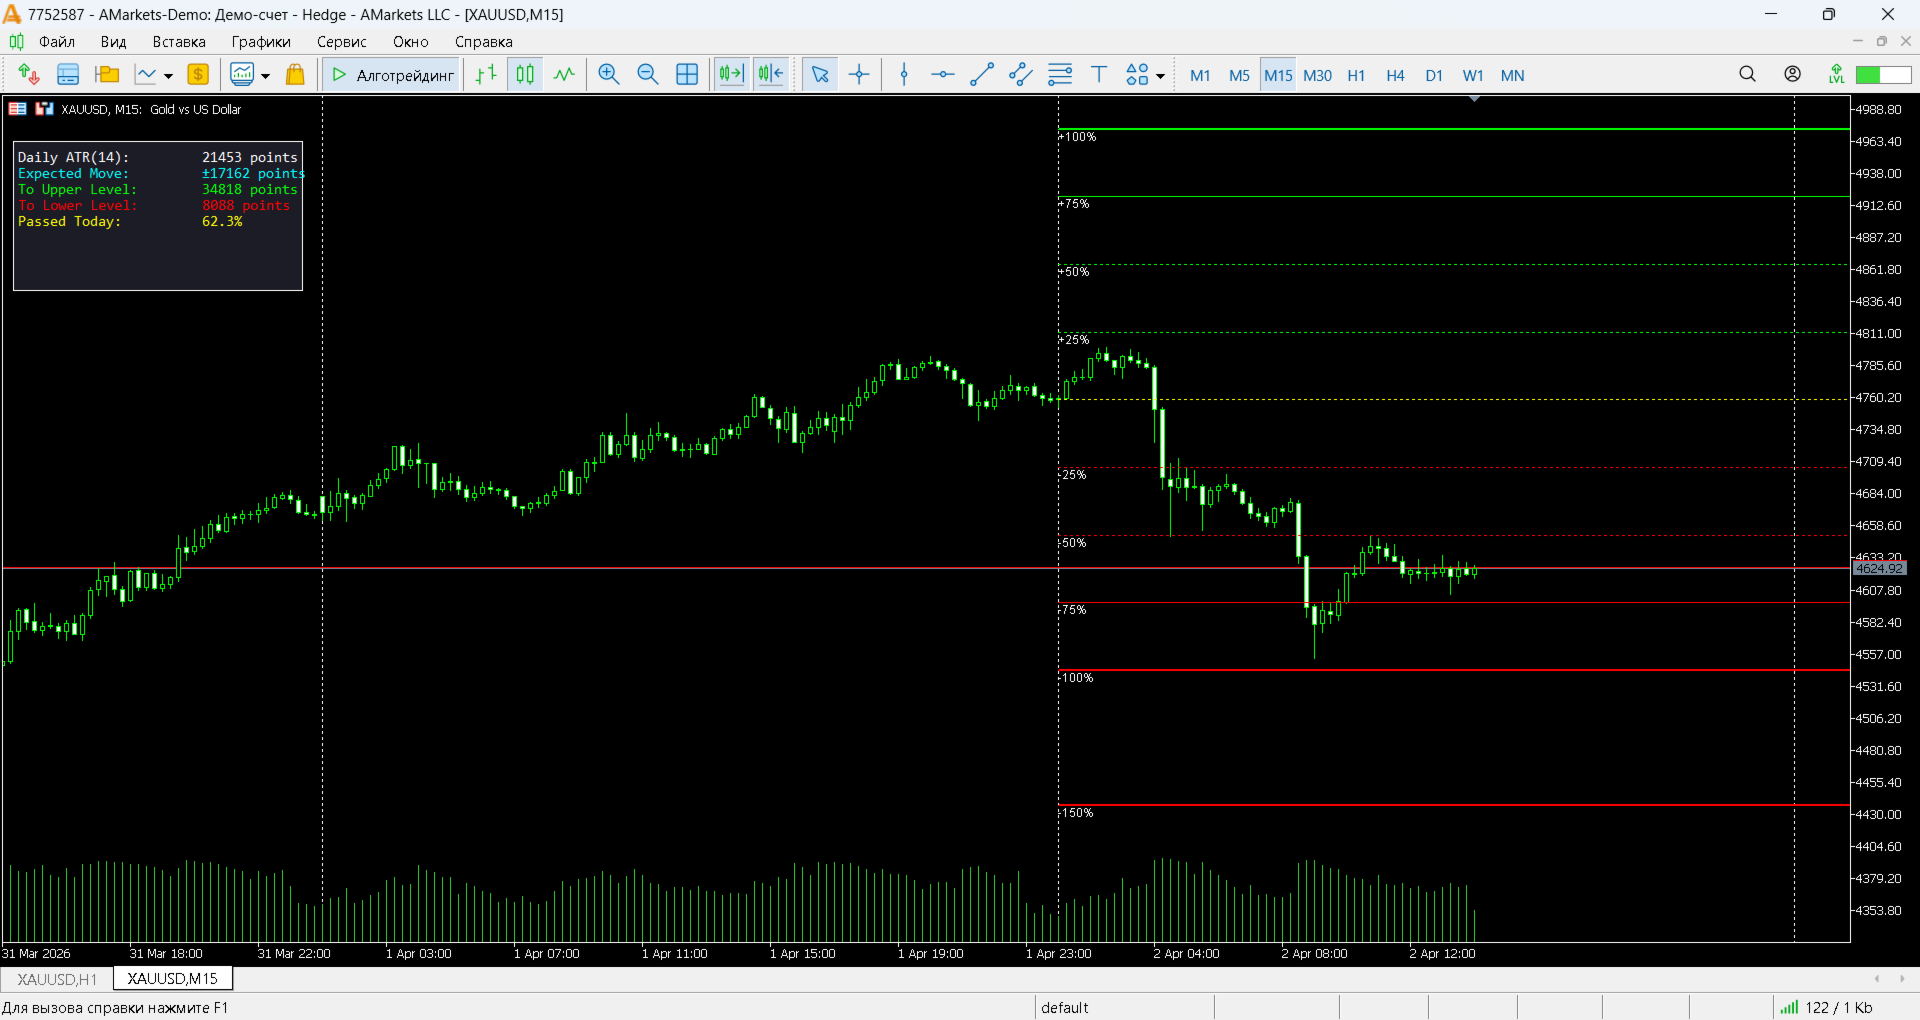
Daily ATR Range + Percent + Daily Open Professional indicator that displays dynamic price levels based on Daily Average True Range (ATR) calculated from the Daily Open price. Key Features: • Automatic Daily ATR calculation with optional outlier filter • Key percentage levels: 25%, 50%, 75%, 100%, 150% of Daily ATR • Daily Open line with customizable style and color • Clear labels positioned on the left side of each level • Informative panel showing ATR value, expected move, distance to levels and percentage passed • No flickering effect (optimized object handling) • Clean and user-friendly visual design Applications: • Identifying intraday support and resistance zones • Setting realistic daily profit targets and stop-loss levels • Intraday and swing trading strategies • Understanding current daily volatility and expected price range • Effective combination with Price Action and other technical tools Parameters: • ATR Period — period for ATR calculation (default: 14) • ATR Type — Classic ATR or No Paranormal Bars (filtered) • Show 25%, 50%, 75%, 100%, 150% levels (can be enabled/disabled individually) • Upper and Lower levels colors • Daily Open line settings (color, style, width) • Show/Hide level labels and information panel • Label font size • Outlier filter multipliers (Min and Max) Ideal tool for day traders and swing traders who want to work with statistically justified volatility-based levels. ──────────────────────────────────── Русская версия: Daily ATR Range + Percent + Daily Open Профессиональный индикатор, отображающий динамические уровни цены на основе дневного Average True Range (ATR), рассчитанного от цены открытия дня. Основные возможности: • Автоматический расчёт Daily ATR с фильтром аномальных баров • Процентные уровни: 25%, 50%, 75%, 100%, 150% от Daily ATR • Линия открытия дня (Daily Open) • Метки уровней слева от графика • Информационная панель с ключевыми данными • Отсутствие мерцания • Чистый и удобный интерфейс Применение: • Определение внутридневных зон поддержки и сопротивления • Установка реалистичных целей и стоп-лоссов • Интрадей и свинг-трейдинг • Анализ дневной волатильности Идеально подходит для трейдеров, работающих с волатильностью и Price Action.

추천 제품
Moon Rover
Askar Koibagarov
Moon Rover — 골드(XAUUSD) 전용 자동 트레이딩 전문가 조언자(EA) • 최소 입금액:       10 USD                                                                • 권장 입금액:       100 USD 이상 • 레버리지:           1:100 이상 (권장 1:500) Moon Rover는 골드(XAUUSD) 전용으로 설계된 완전 자동화 트레이딩 시스템입니다. 그 핵심에는 면밀히 설계된 로직과 비정상적인 시장 상황에 대한 다중 보호 기능이 내장되어 있습니다. 주요 특징 하나의 심볼에 대해 한 포지션만 오픈하며, 현재 거래가 종결될 때까지 시장에 재진입하지 않습니다. 포지션 종료는 오직 테이크프로핏, 스탑로스 또는 트레일링 스탑을 통해서만 이루어집니다. 타인의 주문에 간섭하지 않습니다 — 고유한 매직넘버(MagicNumber)를 사용하며 네팅 및 헤징 계정 모두에서 정상적으로 작동합니다. 최대 스프
Predictive Ranges
Lovrenc Mihelcic
A technical analysis tool that displays dynamic price levels on the chart based on market volatility measurements. Technical Features: Calculates 5 distinct price levels displayed as horizontal lines Applies a multiplier factor (default: 6.0) to scale the calculations Features an adaptive central reference line that adjusts based on price movement All levels update dynamically as new price data becomes available Visual Components: Upper Level 2   (Red): Outermost upper boundary Upper Level 1  
MTF OpenClose Levels Pro is a professional multi-timeframe indicator of support and resistance levels based on Open and Close prices of previous bars from higher timeframes. Key advantage: automatic detection of strong clusters (confluence zones) where levels from multiple timeframes (H1, H4, D1, W1, MN) are located very close to each other. Main features: • Displays Open and Close levels of previous bars (adjustable lookback — default 3 bars) • Highlights strong clusters (minimum 3 coinciding
TendecialCX
Yojhan Estiven Villalba Suarez
Ayuda a interpretar la tendencia del precio de mercado de acuerdo a las mediciones en tiempo real, ideal para reforzar los resultados mostrados por el RSI  las bandas de Bollinguer. Recuerde que el mercado de instrumentos financieros es altamente volatil, no opere con dinero que ponga en riesgo su estabilidad financiera. Solo use fondos que este dispuesto a perder. Resultados pasados no garantizan resultados futuros. Mantenga Siempre control sobre el riesgo.
Monthly Atr Range
Shavkat Ilxomov
Displays monthly expected price ranges based on ATR with percentage levels (+25% to +200%) from the current monthly open. Includes a clean information panel with key statistics. Monthly ATR Range + Percent + Monthly Open v1.1 This powerful monthly indicator helps traders visually see the expected price movement for the current month based on the Average True Range (ATR). Key Features: • Shows percentage-based levels from the Monthly Open: +25%, +50%, +80%, +100%, +150%, +200% (upper) and corres
Indicator MNK
Beyzodjon Askarov
MNK Trend Line Indicator This indicator builds a linear trend line based on the method of least squares (OLS). It helps you detect the main price trend for any symbol or timeframe. Customizable period Shows trend strength Can be used in expert advisors (via iCustom) Works on any instrument and timeframe. Индикатор по методу наименьших квадратов (МНК), также известный как Least Squares Moving Average (LSMA) , — это разновидность скользящей средней, которая использует линейную регрессию для оценки
Visual Falcon Wave Indicator
AL MOOSAWI ABDULLAH JAFFER BAQER
Visual Falcon Wave Indicator: Trade with Clarity and Confidence Are you tired of navigating the chaotic market with lagging indicators and confusing signals? Do you struggle to identify the true trend direction amidst unpredictable price swings? The Visual Falcon Wave Indicator was engineered from the ground up to solve this exact problem, providing a crystal clear, intuitive, and powerful tool for trend traders. For a one-time price of just $30, you can equip yourself with an indicator designe
Prime Flow
Simon Draxler
DRX PRIME FLOW 는 시장 구조와 변동성 변화를 차트에서 직접 시각화하도록 설계된 자동 적응형 시장 분석 시스템입니다. 가이드 및 매뉴얼: 여기를 클릭하세요 수동 보정 대신, 이 시스템은 백그라운드에서 현재 자산의 변동성에 적응하는 동적 알고리즘을 사용합니다. 골드, 암호화폐, 통화 및 지수에서 파라미터 튜닝 없이 원활하게 작동합니다. 핵심 기능 자동 적응형 존(Zones): 지표는 시장 변동성에 따라 확장 및 수축하는 동적 밴드를 표시합니다. 내부 존: 시장이 균형 상태입니다. 외부 존: 시장이 과매수/과매도 상태 – 반전 또는 풀백(Pullback) 가능성. 스마트 배경 시각화: 차트 배경색을 사용하여 시장 단계를 알립니다. 색상 A (예: 녹색): 가격이 하단 극단에 도달 (잠재적 매수 구간). 색상 B (예: 적색): 가격이 상단 극단에 도달 (잠재적 매도 구간). 중립: 가격이 정상 범위 내에 있습니다. 대시보드 패널: 중앙 HUD 패널이 현재 추세 방향과 흐름 상
CosmiCLab FIBO
Kirils Subins
CosmiCLab SMC FIBO CosmiCLab SMC FIBO is a professional trading indicator designed for traders who use Smart Money Concepts (SMC), market structure analysis and Fibonacci retracement levels. The indicator automatically detects market swings and builds Fibonacci levels based on the latest impulse movement. It also identifies market structure changes such as BOS (Break of Structure) and CHOCH (Change of Character), helping traders understand the current market direction. CosmiCLab SMC FIBO also pr
If you want test the breakeven indicator contact me here on mql5 and i send to you a demo version active for 1 week. Breakeven line is usefull tool for you trading. The aim of breakeven line is shown graphically the price level where your positions start start to be profitable. There are 2 simple functions in this breakeven indicator : 1- Is possible calculate the breakeven price only for the symbol where you attached the indicator. 2- Is possible calculate the breakeven price for all the po
Unda
Pavel Gotkevitch
The Unda indicator determines the trend direction and strength, as well as signals about trend changes. The indicator uses price extremums for the previous periods and calculates the ratio between the current price and extremums. Therefore, the only parameter is Period (default = 13), which sets the number of bars to determine extremums. The higher the Period, the less the number of signals about trend changes, but the greater the indicator delay. Uptrends are shown by blue color of the indicato
TANIN ICHIMOKU CLOUD (EA20): The Ultimate Trend Rider & Prop Firm Shield Trading the Ichimoku Kinko Hyo system manually can be complex and emotionally draining. Are you tired of getting shaken out of massive trends by market noise? Meet EA20 Tanin Ichimoku Cloud , a fully automated trend-following system. It takes the guesswork out of Ichimoku by executing sniper entries and riding the mega trends with zero emotions.   ENTER YOUR KEY HERE:   [  EA20_99999D_TANINCODER_598259741005 ] --
FREE
Pixel Minimalist Screener – 더 스마트하게 트레이딩하세요 명확함은 곧 힘입니다. 빠르게 움직이는 시장 속에서 깔끔하고 집중된 작업 환경은 승부를 가를 수 있습니다. Pixel Minimalist Screener 는 정확성, 단순함, 그리고 실질적인 정보를 한눈에 제공하는 트레이더를 위한 도구입니다. 핵심 기능 멀티 타임프레임 지원 최대 3개의 맞춤 타임프레임 을 한 화면에서 모니터링하세요. 스캘핑부터 스윙, 장기 트레이딩까지 — 시장의 전반적인 흐름을 빠르게 파악할 수 있습니다. 7가지 핵심 기술 지표 포함 불필요한 시각적 요소 없이도 충분한 정보 제공: RSI (상대 강도 지수) MACD ADX 스토캐스틱 오실레이터 패러볼릭 SAR 이동 평균선 모멘텀 모든 지표는 깔끔하게 시각화되어 빠른 판단을 도와줍니다. 실시간 대시보드 선택한 타임프레임에서 지표 상태를 실시간으로 확인할 수 있습니다. 상승(Bullish), 하락(Bearish), 중립(
Channel Creator
Ross Adam Langlands Nelson
The auto-channel indicator creates a top line and bottom line that encloses a channel within which the symbol has been trading.  The channel is created by finding high points for the top line and low points for the bottom line, these points are shown with arrows. A line of best fit is then plotted through these points and extended until the end of the chart. This indicator is useful for trading both within the channel and for breakouts. Inputs: MAPeriod - The moving average period over which the
Overview Harmonic Patterns MT5 is a technical analysis indicator designed for the MetaTrader 5 platform. It identifies and displays harmonic price patterns, such as Butterfly, Cypher, Crab, Bat, Shark, and Gartley, in both bullish and bearish directions. The indicator calculates key price levels, including entry, stop loss, and three take-profit levels, to assist traders in analyzing market movements. Visual elements and customizable alerts enhance usability on the chart. Features Detects six ha
DSProFx Trade Monitor
Donald Reeves Sihombing
DSProFx Trade Monitor (iExposure) gives you detail information of all trades in your account including total positions, lot size, average price level (Breakeven Level), floating profit, and today's maximum profit/loss. The display is simple. Each data will be separated for every symbol/chart. This indicator will help you monitoring your trades especially if you are working with multiple symbols/charts and open many orders. Just attach DSProFx Trade Monitor in one chart, and it will show all deta
The indicator detects and displays М. Gartley's Butterfly pattern. The pattern is plotted by the extreme values of the ZigZag indicator (included in the resources, no need to install). After detecting the pattern, the indicator notifies of that by the pop-up window, a mobile notification and an email. The pattern and wave parameters are displayed on the screenshots. The default parameters are used for demonstration purposes only in order to increase the amount of detected patterns. Parameters z
This indicator converted from 5 min Buy and Sell Range Filter - guikroth version on TradingView Popularity of the Range Filter The Range Filter is a very popular and effective indicator in its own right, with adjustments to the few simple settings it is possible to use the Range Filter for helping filter price movement, whether helping to determine trend direction or ranges, to timing breakout or even reversal entries. Its practical versatility makes it ideal for integrating it's signals into a
Tick StdDev
Andrej Nikitin
The Standard Deviation (StdDev) indicator drawn using a tick chart. After launching it, wait for enough ticks to come. Parameters: Period - period of averaging. Method - method of averaging. calculated bar - number of bars for the indicator calculation.
Crossfire Dashboard is an assisting visual tool that displays real-time values of selected financial instrument's key technical indicators across multiple timeframes in a single, organized table. It enables traders to quickly assess trend strength, overbought/oversold conditions, and alignment across timeframes — without switching charts or manually loading multiple indicators. This dashboard is ideal for traders who rely on momentum, trend-following, or reversal strategies and want a clean bird
Volume Bubbles MT5
Tinashe Ndarimani
Benefits and Usage of the Volume Bubble Tool This tool, (one of my favorites by Algo Alpha, from Tradingview)  provides an advanced method of volume analysis by moving beyond traditional histograms. It leverages statistical normalization (Z-score) on lower-timeframe data to identify and classify statistically significant volume events, visualizing the dynamic between "Smart Money" (institutional) and "Retail" participants. Core Benefits Intuitive On-Chart Visualization: By plotting volume as bub
Price Magnet — Price Density and Attraction Levels Indicator Price Magnet is a professional analytical tool designed to identify key support and resistance levels based on statistical Price Density. The indicator analyzes a specified historical period and detects price levels where the market spent the most time. These zones act as “magnets,” attracting price action or forming a structural base for potential reversals. Unlike traditional Volume Profile tools, Price Magnet focuses on price-time d
Multi Asset Monitor Panel
Flavio Javier Jarabeck
The Multi Asset Monitor Panel is a game-changer for traders who need to keep an eye on multiple markets simultaneously. This innovative panel allows you to monitor any symbol and any timeframe you need, all within a single, organized interface. With up to three lists of symbols and customizable MT5 templates, you can tailor your monitoring setup to fit your specific trading strategy. What sets the Multi Asset Monitor Panel apart is its flexibility and customization options. You can control the s
Gold Spread Monitor – Spread Display Utility for MetaTrader 5 Gold Spread Monitor is a lightweight utility for MetaTrader 5 that displays the current spread of the selected symbol directly on the chart. The tool is designed to help traders observe spread conditions in real time without switching between terminal windows. It provides a simple visual panel that shows the current spread value and its status based on predefined thresholds. Gold Spread Monitor is suitable for manual traders who want
Ein professioneller MACD-Indikator für MetaTrader 5 mit klarer Histogramm-Darstellung und gut lesbaren Signal- und MACD-Linien. Die visuelle Aufbereitung ist an moderne Chartstandards angelehnt und eignet sich ideal für diskretionäres Trading und regelbasierte Strategien. Dieser MACD-Indikator für MetaTrader 5 stellt die klassische MACD-Logik in einer klaren, aufgeräumten und modernen Darstellung dar. Der Fokus liegt auf Lesbarkeit , klarer Farblogik und einer sauberen Trennung von Momentum und
Wilders Moving Average
Marco Antonio Cruz Dawkins
Wilder's Moving Average (Wilder's MA) is a smoothing technique developed by J. Welles Wilder, designed to reduce the impact of short-term price fluctuations and highlight longer-term trends. Unlike the standard Exponential Moving Average (EMA), Wilder's MA uses a unique smoothing factor, which gives it a slower and more stable response to changes in price. The calculation method emphasizes a more gradual adaptation to market changes, making it particularly useful in volatile markets. It helps tr
Bybit BTC Scalper
STANTON ROUX
3.9 (10)
BTC Scalper - Automated RSI Breakout Strategy for BTCUSD Unlock the power of automated trading with BTC Scalper! This expert advisor is a fully autonomous trading strategy, designed to capitalize on fast-moving BTCUSD markets. It leverages a potent combination of RSI Breakouts and two Exponential Moving Averages (EMA) to find high-probability trade entries, ensuring optimal confluence for success. Key Features: Fully Automated Trading : Set it, forget it, and let BTC Scalper handle your trades 2
FREE
Twin Blade Trend EA – Precision Meets Patience Discover the power of precision with Twin Blade Trend - an Expert Advisor designed to cut through market noise like a razor-sharp blade. This isn’t just another trend-following bot; it uses a unique dual-layer range to identify high-probability entries with unmatched clarity. Imagine a system that patiently waits for the perfect alignment of conditions - no chasing trades, no guesswork - only clean, confident signals. When Twin Blade Trend strikes,
Fibonachchi Pro
Shokhboz Mamarasulov
EA asosiy funksiyalari (odatda bo‘ladi): Fibonacci darajalarini avtomatik chizish: Oldingi kun, hafta yoki sessiya asosida. Trend yo‘nalishiga qarab: Bullish → pastdan yuqoriga, Bearish → yuqoridan pastga. Buyurtma joylashtirish: Buyurtmalarni 23.6%, 38.2%, 50%, 61.8%, yoki 78.6% darajalariga yaqin joylashtiradi. SL (Stop Loss) va TP (Take Profit) ni navbatdagi darajalarga qo‘yadi. Lot hajmini boshqarish: Fiks lot (masalan, 0.01) Yoki risk asosida hisoblangan lot (foiz bo‘yicha) Martingale yo
Correlation Index Pro
Makarii Gubaydullin
두 심볼 간의 상관관계 값. 값 +1 은 완전한 양의 상관관계를 의미합니다; 값 -1 은 완전한 역상관관계를 의미합니다; 값 0 은 명시적인 상관관계가 없음을 의미합니다 (가격이 서로 의존하지 않거나, 상관관계가 무작위임); 다기능 유틸리티 : 66개 이상의 기능 포함  |   질문이 있으면 저에게 연락하세요   인디케이터 설정에서 다음을 구성할 수 있습니다: 심볼 (통화 쌍)을 계산에 사용할 수 있습니다. 하나의 값을 비워두면 심볼 중 하나가 항상 차트 심볼과 일치하도록 할 수 있습니다. 기간 (계산에 사용되는 시간 프레임의 바 수)。 모든 스타일, 크기 및 색상은 사용자 지정 가능합니다. 빨간 선은 음수 값을 시각화하고, 초록 선은 양수 값을 나타냅니다. 프로그램 파일은 " Indicators " 디렉토리에 배치해야 합니다.
이 제품의 구매자들이 또한 구매함
ARIPoint
Temirlan Kdyrkhan
ARIPoint is a powerful trading companion designed to generate high-probability entry signals with dynamic TP/SL/DP levels based on volatility. Built-in performance tracking shows win/loss stats, PP1/PP2 hits, and success rates all updated live. Key Features: Buy/Sell signals with adaptive volatility bands Real-time TP/SL/DP levels based on ATR Built-in MA Filter with optional ATR/StdDev volatility Performance stats panel (Success, Profit/Loss, PP1/PP2) Alerts via popup, sound, push, or email Cu
SuperScalp Pro
Van Minh Nguyen
4.63 (24)
SuperScalp Pro – 고급 멀티 필터 스캘핑 지표 시스템 SuperScalp Pro는 클래식 Supertrend와 여러 지능형 확인 필터를 결합한 고급 스캘핑 지표로, 거래 기회를 식별하는 데 도움을 줍니다. M1부터 H4까지 다양한 시간대에서 효율적으로 작동하며, XAUUSD, BTCUSD 및 주요 Forex 통화쌍에 최적화되어 있습니다. 이 지표는 명확한 매수 및 매도 신호를 제공하며, ATR 기반으로 진입가, 손절가, 익절가를 자동 계산하여 보다 효과적인 리스크 관리를 지원합니다. Fibonacci Take Profit 기능은 중요한 가격 구간에서 더 빠르게 포지션을 청산할 수 있도록 하며, 해당 수준 도달 시 알림을 전송합니다. 기본 설정은 Fibonacci Take Profit이 활성화된 상태로 최적화되어 있으며, 보다 안정적이고 일관된 거래 경험에 중점을 둡니다. 차트에 적용하는 것만으로 즉시 사용할 수 있습니다. 고급 사용자를 위해 모든 파라미터는 자유롭게 사용
Entry In The Zone and SMC Multi Timeframe is a real-time 2-in-1 market analysis tool that combines market structure analysis and a No Repaint BUY / SELL signal system into a single indicator, built on Smart Money Concepts (SMC) — a widely adopted framework used by professional traders to understand market structure. This indicator helps you see the market more clearly, make decisions based on structure rather than guesswork, and focus on high-probability zones where price is more likely to react
Divergence Bomber
Ihor Otkydach
4.9 (88)
이 지표를 구매하신 분께는 다음과 같은 혜택이 무료로 제공됩니다: 각 거래를 자동으로 관리하고, 손절/익절 수준을 설정하며, 전략 규칙에 따라 거래를 종료하는 전용 도우미 툴 "Bomber Utility" 다양한 자산에 맞게 지표를 설정할 수 있는 셋업 파일(Set Files) "최소 위험", "균형 잡힌 위험", "관망 전략" 모드로 설정 가능한 Bomber Utility의 셋업 파일 이 전략을 빠르게 설치, 설정, 시작할 수 있도록 돕는 단계별 영상 매뉴얼 주의: 위의 모든 보너스를 받기 위해서는 MQL5 개인 메시지 시스템을 통해 판매자에게 연락해 주세요. 독창적인 커스텀 지표인 “Divergence Bomber(다이버전스 봄버)”를 소개합니다. 이 지표는 MACD 다이버전스(괴리) 전략을 기반으로 한 올인원(All-in-One) 거래 시스템입니다. 이 기술 지표의 주요 목적은 가격과 MACD 지표 간의 다이버전스를 감지하고, **향후 가격이 어느 방향으로 움직일지를 알려주는
Power Candles MT5
Daniel Stein
5 (8)
Power Candles V3 - 자체 최적화 강도 지표 파워 캔들 V3는 적용된 모든 차트에서 통화 및 상품의 강세를 실행 가능한 거래 계획으로 전환합니다. 단순히 캔들에 색상을 입히는 대신, 백그라운드에서 실시간 자동 최적화를 수행하여 현재 보고 있는 종목에 대한 최적의 손절매, 익절 및 신호 임계값을 제공합니다. 한 번의 클릭으로 실시간 거래에 적용할 수 있으며, 진입점, 손절매 및 익절 선이 정확한 가격에 맞춰 차트에 표시되고, 방향과 함께 알림이 발령됩니다. 이 도구는 Stein Investments 에코시스템의 일부입니다. 18개 이상의 도구와 함께 당신의 1대1 AI 트레이딩 멘토 Max.  항상 대기 중, 모든 인디케이터를 깊이 있게 이해, 무언가를 차근차근 생각해보고 싶은 순간에 도움을 줍니다.  https://stein.investments 에서 만나보세요 매 종가 바마다 3,000회 이상의 트레이딩 시뮬레이션. 9가지 강도 상태. 2가지 전략을 병렬로 테스트.
SignalTech MT5
Yue Wang
5 (21)
SignalTech MT5 is a fully rule based trading system for EURUSD, USDCHF, USDJPY, AUDUSD, NZDUSD, EURJPY, AUDJPY, NZDJPY, CADJPY.  All the winning trades with chart setups are published on the comments page. 2025-12 1174 Pips 2026-01 2624 Pips 2026-02 2937 Pips 2026-03 2165 Pips 2026-04 2243 Pips It can generate signals with Buy/Sell Arrows and Pop-Up/Sound Alerts. Each signal has clear Entry and Stop Loss levels, which should be automatically flagged on the chart, as well as potential Targets 1,
소개       Quantum Breakout PRO   , 브레이크아웃 존 거래 방식을 변화시키는 획기적인 MQL5 지표! 13년 이상의 거래 경험을 가진 숙련된 트레이더 팀이 개발한       퀀텀 브레이크아웃 PRO       혁신적이고 역동적인 브레이크아웃 존 전략으로 거래 여정을 새로운 차원으로 끌어올리도록 설계되었습니다. Quantum Breakout Indicator는 5개의 이익 목표 영역이 있는 브레이크아웃 영역의 신호 화살표와 브레이크아웃 상자를 기반으로 한 손절 제안을 제공합니다. 초보자 거래자와 전문 거래자 모두에게 적합합니다. Quantum EA 채널:       여기를 클릭하세요 중요한! 구매 후 설치 매뉴얼을 받으려면 개인 메시지를 보내주십시오. 추천: 기간: M15 통화쌍: GBPJPY, EURJPY, USDJPY,NZDUSD, XAUUSD 계정 유형: 스프레드가 매우 낮은 ECN, Raw 또는 Razor 브로커 시간: GMT +3 중개인 :
Azimuth Pro
Ottaviano De Cicco
5 (7)
Azimuth Pro V2: Synthetic Fractal Structure and Confirmed Entries for MT5 Overview Azimuth Pro is a multi-level swing structure indicator by Merkava Labs . Four nested swing layers, swing-anchored VWAP, ABC pattern detection, three-timeframe structural filtering, and closed-bar confirmed entries — one chart, one workflow from micro-swings to macro-cycles. This is not a blind signal product. It is a structure-first workflow for traders who care about location, context, and timing. V2 Launch Offe
Gann Made Easy MT5
Oleg Rodin
5 (4)
Gann Made Easy 는 mr.의 이론을 사용하여 최고의 거래 원칙을 기반으로 하는 전문적이고 사용하기 쉬운 Forex 거래 시스템입니다. W.D. 간. 이 표시기는 Stop Loss 및 Take Profit Levels를 포함하여 정확한 BUY 및 SELL 신호를 제공합니다. PUSH 알림을 사용하여 이동 중에도 거래할 수 있습니다. 구매 후 거래 방법 안내 및 유용한 추가 지표를 무료로 받으시려면 저에게 연락주세요! 아마도 Gann 거래 방법에 대해 이미 여러 번 들었을 것입니다. 일반적으로 Gann의 이론은 초보자 거래자뿐만 아니라 이미 거래 경험이 있는 사람들에게도 매우 복잡한 것입니다. Gann의 거래 방식은 이론적으로 적용하기 쉽지 않기 때문입니다. 나는 그 지식을 연마하고 Forex 지표에 최고의 원칙을 적용하기 위해 몇 년을 보냈습니다. 표시기는 적용하기가 매우 쉽습니다. 차트에 첨부하고 간단한 거래 권장 사항을 따르기만 하면 됩니다. 지표는 지속적으로 시장 분석
RelicusRoad Pro MT5
Relicus LLC
4.96 (24)
RelicusRoad Pro: 퀀트 시장 운영 체제 70% 할인 평생 이용권 (한정 시간) - 2,000명 이상의 트레이더와 함께하세요 왜 대부분의 트레이더는 "완벽한" 지표를 가지고도 실패할까요? 진공 상태에서 단일 개념 만으로 거래하기 때문입니다. 문맥 없는 신호는 도박입니다. 지속적인 승리를 위해서는 컨플루언스(중첩) 가 필요합니다. RelicusRoad Pro는 단순한 화살표 지표가 아닙니다. 완전한 퀀트 시장 생태계 입니다. 독점적인 변동성 모델링을 사용하여 가격이 이동하는 "공정 가치 로드"를 매핑하고, 단순 노이즈와 실제 구조적 돌파를 구분합니다. 추측은 그만두세요. 기관급 로드 로직으로 거래를 시작하세요. 핵심 엔진: "Road" 알고리즘 시스템의 중심에는 시장 상황에 실시간으로 적응하는 동적 변동성 채널인 Road Algo 가 있습니다. 세이프 라인(평형) 과 가격이 수학적으로 반전될 가능성이 높은 확장 레벨 을 투영합니다. Simple Road: 일반적인 시장을 위
MetaTrader 5용 스마트 다층 브레이크아웃 및 풀백 탐지기 "스마트하고, 간단하고, 빠르게!" 고확률 브레이크아웃 진입을 놓치는 것에 지치셨나요? 여러 차트를 몇 시간씩 스캔하면서 브레이크아웃을 추세 방향과 통화 모멘텀에 맞추려고 하지만 — 결국 움직임을 놓치고 마나요? Break Pullback은 하나의 지표로 이 모든 문제를 해결합니다. Break Pullback이란 무엇인가요? Break Pullback은 시장 구조, 브레이크아웃, 추세 지속 설정을 거래하는 트레이더를 위해 특별히 설계된 전문가급 MetaTrader 5 지표입니다. 실시간으로 여러 통화 쌍에 걸쳐 Break와 Pullback 형성을 자동으로 감지하고 — 세 가지 확인 레이어를 통해 모든 신호를 필터링합니다: 구조적 브레이크아웃 탐지 — 차트의 주요 브레이크 레벨 식별 HTF 일봉 바이어스 — 진입을 지배적인 일봉 추세 방향에 맞춤 통화 강도 지수 — 쌍을 이룬 통화 간의 모멘텀 불균형 확인 결과: 오
이 지표를 구매하면 제 프로페셔널 트레이드 매니저를 무료로 드립니다. 우선 이 거래 시스템이 리페인팅, 리드로잉 및 레이그 인디케이터가 아니라는 점을 강조하는 것이 중요합니다. 이는 수동 및 로봇 거래 모두에 이상적인 것으로 만듭니다. 온라인 강좌, 설명서 및 프리셋 다운로드. "스마트 트렌드 트레이딩 시스템 MT5"은 새로운 및 경험이 풍부한 트레이더를 위해 맞춤형으로 제작된 종합적인 거래 솔루션입니다. 10개 이상의 프리미엄 인디케이터를 결합하고 7개 이상의 견고한 거래 전략을 특징으로 하여 다양한 시장 조건에 대한 다목적 선택이 가능합니다. 트렌드 추종 전략: 효과적인 트렌드 추이를 타기 위한 정확한 진입 및 손절 관리를 제공합니다. 반전 전략: 잠재적인 트렌드 반전을 식별하여 트레이더가 범위 시장을 활용할 수 있게 합니다. 스캘핑 전략: 빠르고 정확한 데이 트레이딩 및 단기 거래를 위해 설계되었습니다. 안정성: 모든 인디케이터가 리페인팅, 리드로잉 및 레이그가 아니므로 신뢰
Atomic Analyst MT5
Issam Kassas
3.94 (31)
우선적으로 언급할 점은이 거래 지표가 다시 그리지 않고 지연되지 않으며 이를 통해 수동 및 로봇 거래 모두에 이상적이라는 점입니다. 사용자 매뉴얼: 설정, 입력 및 전략. Atomic Analyst는 가격의 강도와 모멘텀을 활용하여 시장에서 더 나은 이점을 찾는 PA Price Action Indicator입니다. 고급 필터를 장착하여 잡음과 거짓 신호를 제거하고 거래 잠재력을 높이는 데 도움이 됩니다. 복잡한 지표의 다중 레이어를 사용하여 Atomic Analyst는 차트를 스캔하고 복잡한 수학적 계산을 간단한 신호와 색상으로 변환하여 초보 트레이더가 이해하고 일관된 거래 결정을 내릴 수 있도록합니다. "Atomic Analyst"는 새로운 및 경험이 풍부한 트레이더를위한 종합적인 거래 솔루션입니다. 프리미엄 지표와 최고 수준의 기능을 하나의 거래 전략에 결합하여 모든 종류의 트레이더에 대한 다재다능한 선택지가되었습니다. 인트라데이 거래 및 스캘핑 전략 : 빠르고 정확한 일일
Quantum TrendPulse
Bogdan Ion Puscasu
5 (25)
SuperTrend   ,   RSI   ,   Stochastic   의 힘을 하나의 포괄적인 지표로 결합하여 트레이딩 잠재력을 극대화하는 궁극의 트레이딩 도구   인 Quantum TrendPulse를   소개합니다. 정밀성과 효율성을 추구하는 트레이더를 위해 설계된 이 지표는 시장 추세, 모멘텀 변화, 최적의 진입 및 종료 지점을 자신 있게 식별하는 데 도움이 됩니다. 주요 특징: SuperTrend 통합:   주요 시장 추세를 쉽게 따라가고 수익성의 물결을 타세요. RSI 정밀도:   매수 과다 및 매도 과다 수준을 감지하여 시장 반전 시점을 파악하는 데 적합하며 SuperTrend 필터로 사용 가능 확률적 정확도:   변동성이 큰 시장에서 숨겨진 기회를 찾기 위해 확률적 진동   을 활용하고 SuperTrend의 필터로 사용 다중 시간대 분석:   M5부터 H1 또는 H4까지 다양한 시간대에 걸쳐 시장을 최신 상태로 유지하세요. 맞춤형 알림:   맞춤형 거래 조건이 충족되면
FX Trend MT5 NG
Daniel Stein
5 (4)
FX Trend NG: 차세대 멀티 마켓 트렌드 인텔리전스 개요 FX Trend NG 는 다중 시간 프레임 기반의 전문 트렌드 분석 및 시장 모니터링 도구입니다. 몇 초 만에 전체 시장 구조를 파악할 수 있도록 설계되었습니다. 여러 차트를 일일이 전환할 필요 없이, 어떤 종목이 추세에 있는지, 어디에서 모멘텀이 약화되고 있는지, 그리고 어떤 시간 프레임이 서로 정렬되어 있는지 즉시 확인할 수 있습니다. 출시 기념 특별 혜택 – FX Trend NG 를 $30 (6개월) 또는 $80 평생 라이선스 로 이용할 수 있습니다. 이미 Stein Investments 고객이신가요? -> 메시지를 보내 전용 고객 그룹에 참여하세요. 설정이나 사용 방법이 필요하신가요? -> Stein Investments 공식 페이지 를 방문하세요. 1. FX Trend NG가 특별한 이유 3단계 추세 로직 – 단순한 Buy / Sell이 아닙니다 • 대부분의 지표는 Buy 또는 Sell 두 가지 상태만 제
Btmm state engine pro
Garry James Goodchild
5 (4)
BTMM State Engine Pro is a MetaTrader 5 indicator for traders who use the Beat The Market Maker approach: Asian session context, kill zone timing, level progression, peak formation detection, and a multi-pair scanner from a single chart. It combines cycle state logic with a built-in scanner dashboard so you do not need the same tool on many charts at once. What it does Draws the Asian session range; session times can follow broker server offset or be set in inputs. Tracks level progression (L
Market Structure Order Block Dashboard MT5는 시장 구조와 주요 가격 반응 구역을 차트에서 직접 읽고자 하는 트레이더를 위해 설계된 MT5 지표입니다. BOS, ChoCH, 오더 블록, Fair Value Gap (FVG), 유동성, Kill Zones, Volume Profile 그리고 빠른 분석을 위한 콤팩트한 대시보드를 결합합니다. 이 지표는 시장 구조, ICT 및 Smart Money 개념을 의사결정 프레임워크로 사용하는 트레이더를 대상으로 합니다. 추세 지속, 가능한 반전, 가격 불균형, 유동성 타겟 및 관심 구역을 보다 체계적으로 식별하는 데 도움을 줄 수 있습니다. 구매자를 위한 포함 리소스 구매 후 MQL5 개인 메시지로 요청하시면 완전한 PDF 사용 설명서와 파라미터 설정 팁을 제공해 드립니다. MQL5 개인 메시지를 통한 직접 기술 지원. 1.20 버전은 두 가지 주요 추가 기능을 제공합니다: Pending BOS / Pending
우선적으로, 이 거래 도구는 전문적인 거래에 이상적인 비-다시 그리기 및 지연되지 않는 지표입니다.  온라인 강좌, 사용자 매뉴얼 및 데모. 스마트 가격 액션 컨셉트 인디케이터는 신규 및 경험 많은 트레이더 모두에게 매우 강력한 도구입니다. Inner Circle Trader Analysis 및 Smart Money Concepts Trading Strategies와 같은 고급 거래 아이디어를 결합하여 20가지 이상의 유용한 지표를 하나로 결합합니다. 이 인디케이터는 스마트 머니 컨셉트에 중점을 두어 대형 기관의 거래 방식을 제공하고 이동을 예측하는 데 도움을 줍니다.  특히 유동성 분석에 뛰어나 기관이 어떻게 거래하는지 이해하는 데 도움을 줍니다. 시장 트렌드를 예측하고 가격 변동을 신중하게 분석하는 데 탁월합니다. 귀하의 거래를 기관 전략에 맞추어 시장의 동향에 대해 더 정확한 예측을 할 수 있습니다. 이 인디케이터는 시장 구조를 분석하고 중요한 주문 블록을 식별하고 다양
OrderFlux | MetaTrader 5용 풋프린트 오더플로우 버전 2.0 – 액티브 트레이더를 위한 실시간 Bid/Ask 시각화 OrderFlux는 MT5를 위한 풋프린트 및 오더플로우 지표입니다. 가격이 어디로 이동했는지뿐만 아니라, 그 움직임 내부에서 어떤 일이 발생하고 있는지(가격 수준별 Bid/Ask 거래량, 델타, 임밸런스, 거래량 분포)를 보여줍니다. 많은 차트가 캔들의 최종 결과만 보여줍니다. OrderFlux는 그곳에 도달하기까지의 과정을 보여줍니다. 이것이 바로 캔들 모양뿐만 아니라 시장 참여자들의 동향을 읽고자 할 때 정확히 도움이 되는 부분입니다. 라이브 차트에서 OrderFlux는 주로 다음 세 가지 질문에 답합니다: 현재 어디에서 공격적인 매수 또는 매도 압력이 시장에 진입하고 있는가? 어떤 가격 수준에서 거래량이 흡수되거나 거부되고 있는가? 현재의 움직임이 세션 컨텍스트(배경)에 어떻게 부합하는가? 인터페이스에서 제공되는 기능 메인 차트는 Canvas
Grabber System MT5
Ihor Otkydach
4.83 (23)
탁월한 기술적 지표인 Grabber를 소개합니다. 이 도구는 즉시 사용 가능한 “올인원(All-Inclusive)” 트레이딩 전략으로 작동합니다. 하나의 코드 안에 강력한 시장 기술 분석 도구, 매매 신호(화살표), 알림 기능, 푸시 알림이 통합되어 있습니다. 이 인디케이터를 구매하신 모든 분들께는 다음의 항목이 무료로 제공됩니다: Grabber 유틸리티: 오픈 포지션을 자동으로 관리하는 도구 단계별 영상 매뉴얼: 설치, 설정, 그리고 실제 거래 방법을 안내 맞춤형 세트 파일: 인디케이터를 빠르게 자동 설정하여 최고의 성과를 낼 수 있도록 도와줍니다 다른 전략은 이제 잊어버리세요! Grabber만이 여러분을 새로운 트레이딩의 정점으로 이끌어 줄 수 있습니다. Grabber 전략의 주요 특징: 거래 시간 프레임: M5부터 H4까지 거래 가능한 자산: 어떤 자산이든 사용 가능하지만, 제가 직접 테스트한 종목들을 추천드립니다 (GBPUSD, GBPCAD, GBPCHF, AUDCAD, AU
Crystal Heikin Ashi Signals
Muhammad Jawad Shabir
5 (2)
Crystal Heikin Ashi Signals - Professional Trend & Signal Detection Indicator Advanced Heikin Ashi Visualization with Intelligent Signal System for Manual & Automated Trading Final Price: $149 ---------> Price goes up $10 after every 10 sales . Limited slots available — act fast . Overview Crystal Heikin Ashi Signals is a professional-grade MetaTrader 5 indicator that combines pure Heikin Ashi candle visualization with an advanced momentum-shift detection system. Designed for both manual traders
SMC Intraday Formula
Kareem Abbas
5 (8)
먼저 솔직하게 말하겠습니다. 어떤 인디케이터도 단독으로 당신을 수익성 있게 만들어주지 않습니다. 누군가 그렇게 말한다면, 그는 당신에게 꿈을 파는 것입니다. 완벽한 매수/매도 화살표를 보여주는 모든 인디케이터는 완벽하게 보이도록 만들 수 있습니다 — 단지 올바른 과거 구간을 확대하고 승리한 거래만 캡처하면 됩니다. 우리는 그렇게 하지 않습니다.  SMC Intraday Formula는 도구입니다. 시장 구조를 읽고, 가장 높은 확률의 가격 구간을 표시하며, 현재 스마트 머니의 흐름이 어떻게 보이는지 아주 단순한 언어로 보여줍니다. 최종 결정은 여전히 당신이 합니다. 실행도 당신이 합니다. 하지만 이제는 희망이 아니라 정확성으로 거래하게 됩니다. 우리는 이 인디케이터를 지난 약 3년 동안 골드(XAUUSD) 및 주요 외환 통화쌍의 데이 트레이딩 스캘핑에 사용해 왔습니다. M1, M5, M15, M30에서 우리의 핵심 도구입니다. 이 도구는 미래를 예측하려 하지 않습니다 — 지금 형성
" Dynamic Scalper System MT5 " 지표는 추세 파동 내에서 스캘핑 방식으로 거래하도록 설계되었습니다. 주요 통화쌍 및 금에서 테스트되었으며, 다른 거래 상품과의 호환성이 가능합니다. 추가적인 가격 변동 지원을 통해 추세에 따라 단기 포지션 진입 신호를 제공합니다. 지표의 원리 큰 화살표는 추세 방향을 결정합니다. 작은 화살표 형태의 스캘핑 신호를 생성하는 알고리즘은 추세 파동 내에서 작동합니다. 빨간색 화살표는 상승 방향을, 파란색 화살표는 하락 방향을 나타냅니다. 민감한 가격 변동선은 추세 방향으로 그려지며, 작은 화살표의 신호와 함께 작용합니다. 신호는 다음과 같이 작동합니다. 적절한 시점에 선이 나타나면 진입 신호가 형성되고, 선이 있는 동안 미결제 포지션을 유지하며, 완료되면 거래를 종료합니다. 권장되는 작업 시간대는 M1~H4입니다. 화살표는 현재 캔들에 형성되며, 다음 캔들이 이미 시작되었더라도 이전 캔들의 화살표는 다시 그려지지 않습니다. 입
Basic Harmonic Patterns Dashboard MT5
Mehran Sepah Mansoor
4.36 (11)
이 대시보드는 선택한 심볼에 대해 사용 가능한 최신 고조파 패턴을 표시하므로 시간을 절약하고 더 효율적으로 사용할 수 있습니다 /   MT4 버전 . 무료 인디케이터:   Basic Harmonic Pattern 인디케이터 열 Symbol :   선택한 심볼이 나타납니다 Trend :   강세 또는 약세 Pattern :   패턴 유형(가틀리, 나비, 박쥐, 게, 상어, 사이퍼 또는 ABCD) Entry :   진입 가격 SL:   스톱로스 가격 TP1:   1차 테이크프로핏 가격 TP2:   2차 테이크프로핏 가격 TP3:   3차 테이크프로핏 가격 Current price:   현재 가격 Age (in bars):   마지막으로 그려진 패턴의 나이 주요 입력 Symbols :   "28개 주요 통화쌍" 또는 "선택한 심볼" 중에서 선택합니다. Selected Symbols :   쉼표로 구분하여 모니터링하려는 원하는 심볼("EURUSD,GBPUSD,XAUUSD")을 선택
Meridian Pro
Ottaviano De Cicco
5 (2)
Meridian Pro 2.00: Professional Multi-Timeframe Trend Matrix for MT5 Meridian Pro 2.00 is a professional adaptive trend matrix for MetaTrader 5. It combines the original Meridian trend engine, a clean chart ribbon, closed-bar signal arrows, an 8-timeframe dashboard, Fuel momentum, weighted consensus, synthetic HTF processing and chart-native higher-timeframe context lines. The goal is simple: read current trend, multi-timeframe structure, strength, momentum and EA-ready state from one discipline
OmniSync Projection
Antonio-alin Teculescu
5 (1)
Chronos Fractal Engine is an innovative price projection indicator for MetaTrader 5, designed to transform your technical analysis by intelligently identifying and projecting historical price patterns. Built upon an advanced correlation algorithm and the fractal principles of the market, this powerful tool visualizes potential future price movements, giving you a unique edge in your trading decisions. What is Chronos Fractal Engine? At its core, the Chronos Fractal Engine employs a sophisticat
FX Power MT5 NG
Daniel Stein
5 (31)
FX Power: 통화 강세 분석으로 더 스마트한 거래 결정을 개요 FX Power 는 어떤 시장 상황에서도 주요 통화와 금의 실제 강세를 이해하기 위한 필수 도구입니다. 강한 통화를 매수하고 약한 통화를 매도함으로써 FX Power 는 거래 결정을 단순화하고 높은 확률의 기회를 발견합니다. 트렌드를 따르거나 극단적인 델타 값을 사용해 반전을 예측하고자 한다면, 이 도구는 귀하의 거래 스타일에 완벽히 적응합니다. 단순히 거래하지 말고, FX Power 로 더 스마트하게 거래하세요. 1. FX Power가 거래자에게 매우 유용한 이유 통화와 금의 실시간 강세 분석 • FX Power 는 주요 통화와 금의 상대적 강세를 계산하고 표시하여 시장 역학에 대한 명확한 통찰력을 제공합니다. • 어떤 자산이 앞서고 있고 어떤 자산이 뒤처지는지 모니터링하여 보다 현명한 거래 결정을 내릴 수 있습니다. 포괄적인 멀티 타임프레임 뷰 • 단기, 중기 및 장기 타임프레임에서 통화와 금의 강세를
FX Levels MT5
Daniel Stein
5 (13)
FX Levels: 모든 시장을 위한 뛰어난 정확도의 지지와 저항 간단 요약 통화쌍, 지수, 주식, 원자재 등 어떤 시장이든 믿을 만한 지지·저항 레벨을 찾고 싶나요? FX Levels 는 전통적인 “Lighthouse” 기법과 첨단 동적 접근을 결합해, 거의 보편적인 정확성을 제공합니다. 실제 브로커 경험을 반영하고, 자동화된 일별 업데이트와 실시간 업데이트를 결합함으로써 FX Levels 는 가격 반전 포인트를 파악하고, 수익 목표를 설정하며, 자신 있게 트레이드를 관리할 수 있게 돕습니다. 지금 바로 시도해 보세요—정교한 지지/저항 분석이 어떻게 여러분의 트레이딩을 한 단계 끌어올릴 수 있는지 직접 확인하세요! 1. FX Levels가 트레이더에게 매우 유용한 이유 뛰어난 정확도의 지지·저항 존 • FX Levels 는 다양한 브로커 환경에서도 거의 동일한 존을 생성하도록 설계되어, 데이터 피드나 시간 설정 차이로 인한 불일치를 해소합니다. • 즉, 어떤 브로커를 사용하
Market Structure Patterns
Samuel Manoel De Souza
4.47 (19)
Market Structure Patterns   is an indicator based on   smart money concepts   that displays   SMC/ICT   elements that can take your trading decisions to the next level. Take advantage of the   alerts ,   push notifications   and   email messages   to keep informed from when an element is formed on the chart, the price crosses a level and/or enters in a box/zone. Developers can access the values of the elements of the indicator using the   global variables  what allows the automation of trading
Trend Lines PRO MT5
Roman Podpora
5 (1)
트렌드 라인즈 프로       이 지표는 시장이 실제로 어떤 방향으로 전환되는지 파악하는 데 도움이 됩니다. 실제 추세 반전 지점과 주요 시장 참여자들이 다시 진입하는 지점을 보여줍니다. 보시다시피       BOS 라인       복잡한 설정이나 불필요한 노이즈 없이 더 높은 시간대의 추세 변화와 주요 레벨을 확인할 수 있습니다. 신호는 차트에 다시 그려지지 않고 캔들이 마감된 후에도 계속 표시됩니다. MT4 버전   -   RFI LEVELS PRO   표시기   와 결합 시 최대 잠재력을 발휘합니다. 지표가 보여주는 내용: 실제 변화       추세(BOS 라인) 한 번 신호가 나타나면 그 신호는 계속 유효합니다! 이는 신호를 발생시킨 후 변경될 수 있는 리페인팅 방식의 지표와 중요한 차이점입니다. 리페인팅 방식의 지표는 잠재적으로 자금 손실로 이어질 수 있습니다. 이제 더욱 높은 확률과 정확도로 시장에 진입할 수 있습니다. 또한 화살표가 나타난 후 목표가(익절)에 도달하거나
제작자의 제품 더 보기
**Initial Balance Breakout** Professional indicator for displaying Initial Balance (IB) zones of the three major trading sessions: Asian, London, and US. The indicator automatically draws: - Initial Balance High and Low for each session - Optional filled IB zone - Session extension lines (up to the start of the next session) - Fibonacci extension levels (100%, 161.8%, 200%, 261.8%, 361.8%, 423.6%) - 50% level of the IB range (often used as Stop Loss) **Key Features:** - Clear visualization of A
MACD + ADX Confluence Indicator (Short English description)Purpose Highlights strong trending candles where MACD and ADX give a confluence signal. Colors candles and places arrows only when both conditions are met.Main logic & signalsBullish signal (blue candle + blue ↑ arrow) MACD main line > 0 and ADX > selected level Bearish signal (red candle + red ↓ arrow) MACD main line < 0 **and** ADX > selected level Neutral candles When confluence is absent → candles keep default chart colors (no overl
ADX Histogram Trend Alert Colorful ADX Histogram + Alert on Strong Trend Description: A modern and clear visual indicator based on the classic ADX (Average Directional Index) that shows trend strength and direction in a completely new, easy-to-read format. Key Features: • Wide colored histogram instead of a regular ADX line → Green bars = bullish/uptrend (+DI > -DI) → Red bars = bearish/downtrend (-DI > +DI) • Current ADX value is always displayed in the top-right corner of the indicator window
MultiTF ADX RSI MACD Panel Multi-timeframe dashboard for instant trend and momentum analysis This indicator displays the current readings of three classic technical tools (ADX, RSI, MACD) simultaneously across eight timeframes from M5 to MN1 in one compact table. The main goal is to quickly identify strong, aligned market moves when the majority of timeframes show signals in the same direction. What the panel shows for each timeframe: • TF — timeframe • ADX — ADX value (green > 25 — strong tren
MTF OpenClose Levels Pro is a professional multi-timeframe indicator of support and resistance levels based on Open and Close prices of previous bars from higher timeframes. Key advantage: automatic detection of strong clusters (confluence zones) where levels from multiple timeframes (H1, H4, D1, W1, MN) are located very close to each other. Main features: • Displays Open and Close levels of previous bars (adjustable lookback — default 3 bars) • Highlights strong clusters (minimum 3 coinciding
<p><strong>ATR Trailing EA v1.05</strong></p> <p>Professional Expert Advisor based on the Average True Range (ATR). Especially well optimized for <strong>XAUUSD (Gold)</strong> — one of the most popular and volatile instruments.</p> <p>The EA automatically calculates ATR-based Stop Loss and Take Profit, moves the trade to breakeven and applies a dynamic ATR Trailing Stop to protect profits.</p> <h3>Key Advantages:</h3> <ul> <li><strong>Excellent performance on Gold (XAUUSD)</strong></li> <li>Sm
Gold ATR Pro EA — Professional Volatility-Based Expert Advisor for Gold (XAUUSD) Gold ATR Pro is a clean and powerful MT5 Expert Advisor specially designed for trading XAUUSD. The EA places all pending orders (Buy Stop, Buy Limit, Sell Stop, Sell Limit) exactly at a distance of 1 ATR from the current price and uses dynamic ATR-based risk management. ### Advantages • Precise pending orders at 1 ATR distance • ATR-based Stop Loss and Take Profit with adjustable multipliers • Convenient draggable c
**MultiTF Confluence Dashboard v1.34** Professional multi-timeframe dashboard with intelligent weighted signal system. The indicator analyzes ADX, RSI and MACD simultaneously on 8 timeframes and provides ready trading signals taking into account the strength of each component. **Key Advantages:** - Smart weighting system — higher timeframes have more influence - Colored signal background (green for BUY, red for SELL) - Confidence percentage displayed with every signal - One-time alerts only — n
Monthly Atr Range
Shavkat Ilxomov
Displays monthly expected price ranges based on ATR with percentage levels (+25% to +200%) from the current monthly open. Includes a clean information panel with key statistics. Monthly ATR Range + Percent + Monthly Open v1.1 This powerful monthly indicator helps traders visually see the expected price movement for the current month based on the Average True Range (ATR). Key Features: • Shows percentage-based levels from the Monthly Open: +25%, +50%, +80%, +100%, +150%, +200% (upper) and corres
Weekly Atr Range
Shavkat Ilxomov
Displays weekly expected price ranges based on ATR with percentage levels (+25% to +200%) from the current weekly open. Includes a clean information panel with key statistics. Weekly ATR Range + Percent + Weekly Open v1.1 Powerful weekly indicator that helps traders visually see the expected price movement for the current week based on the Average True Range (ATR). Key Features: • Shows percentage-based levels from the Weekly Open: +25%, +50%, +80%, +100%, +150%, +200% (upper) and corresponding
필터:
리뷰 없음
리뷰 답변