XP Sessions MT4
- 지표
-
Ahmed Soliman
 I'm a programmer for 25 years. 20 years programming in mql4/5.
I wrote the first mql4 tutorial which helped a lot of people around the world.
Currently I'm programming in C++, C#, .Net, VB, PHP, MQL4/5 etc.
I promise clean code and after delivery support. - 버전: 1.4
- 업데이트됨: 9 9월 2024
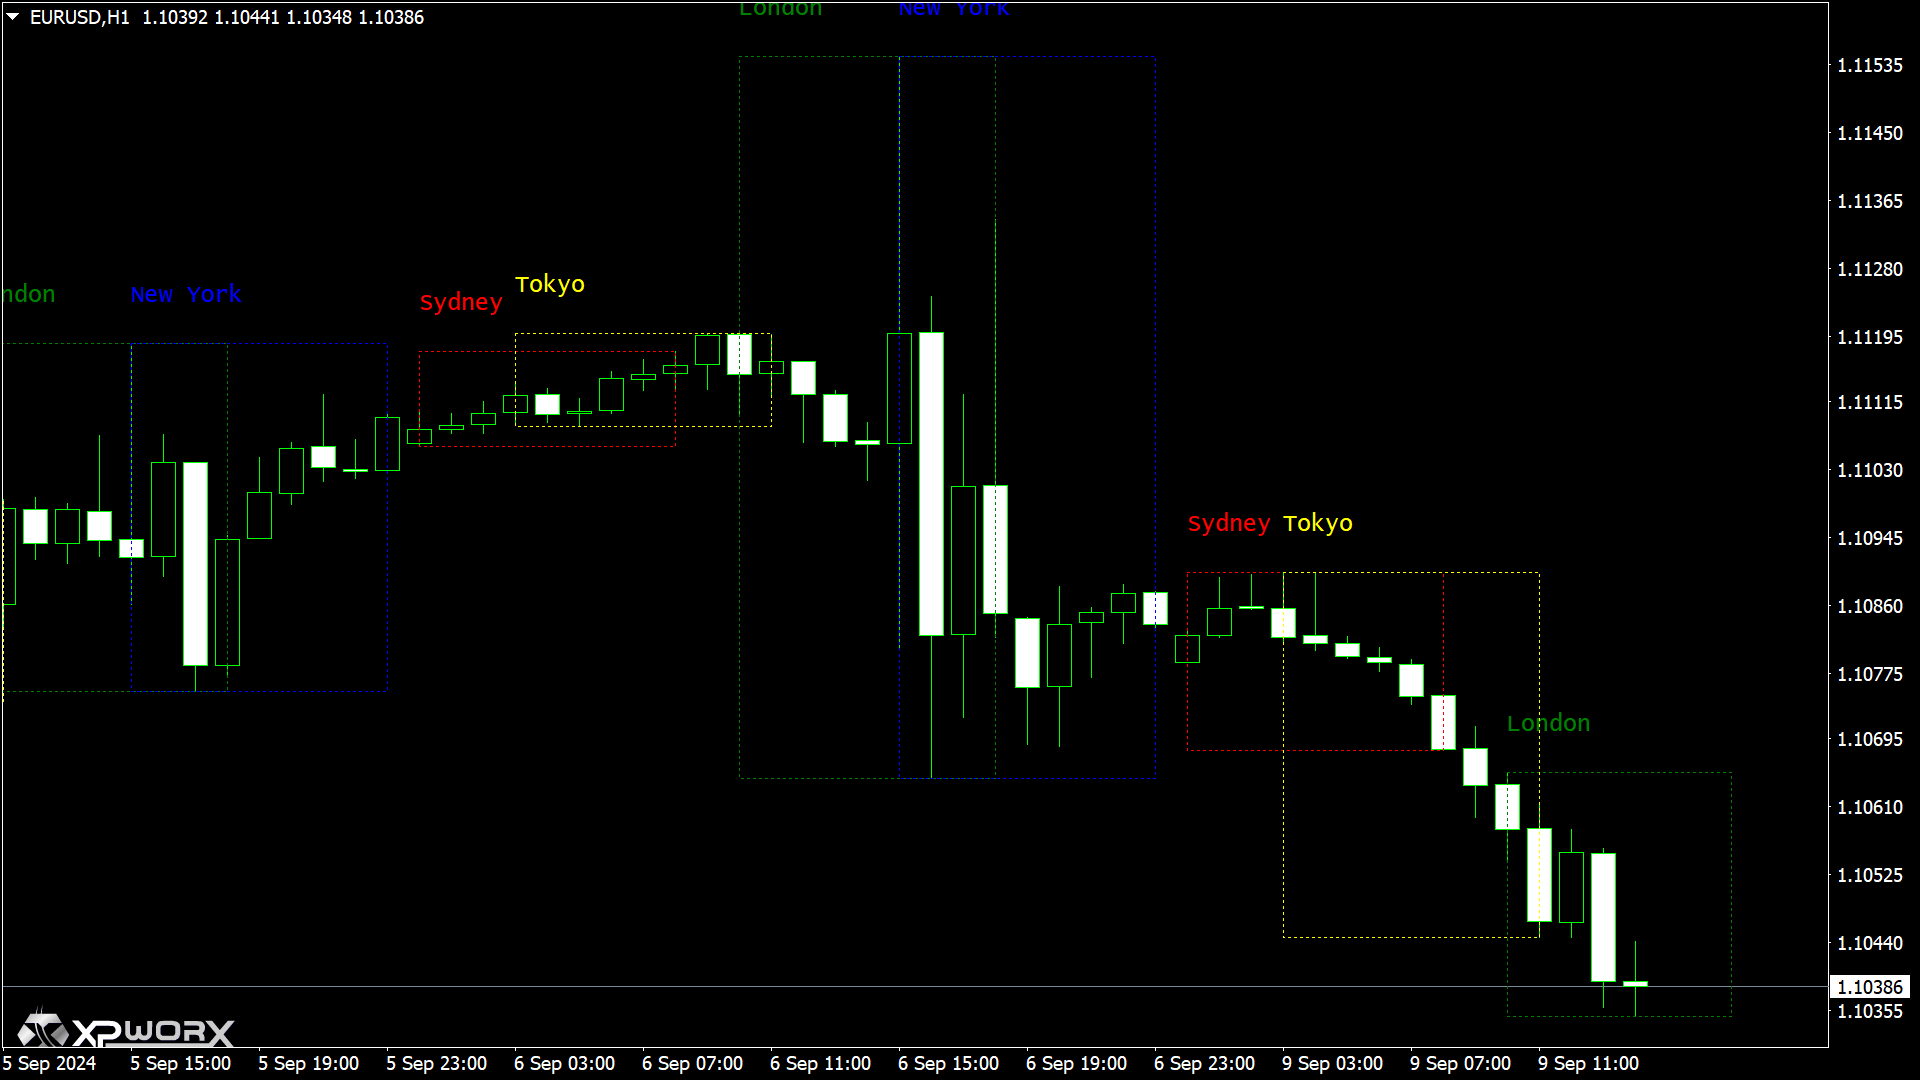
The indicator is getting the four most important trading sessions:
New York
London
Sydney
Tokyo
The indicator auto calculate the GMT time.
The indicator has buffers that can be used to get the current session and the GMT.
You can use it as stand alone indicator and you can turn the draw off and call it from your EA.
INPUTS
Max Day: Max days back to get/draw.
London Session On: Show/Hide London Session.
New York Session On: Show/Hide New York Session.
Sydney Session On: Show/Hide Sydney Session.
Tokyo Session On: Show/Hide Tokyo Session.
Draw On: Show/Hide Boxes.
Background On: Boxes have background or not.
Draw Style: The boxes line style.
London Session Color: The color of London Session Box.
New York Session Color: The color of New York Session Box.
Sydney Session Color: The color of Sydney Session Box.
Tokyo Session Color: The color of Tokyo Session Box.