Universal Dashboard EurUsd GbpUsd
- 지표
-
Ahmed Soliman
 I'm a programmer for 25 years. 20 years programming in mql4/5.
I wrote the first mql4 tutorial which helped a lot of people around the world.
Currently I'm programming in C++, C#, .Net, VB, PHP, MQL4/5 etc.
I promise clean code and after delivery support. - 버전: 1.0
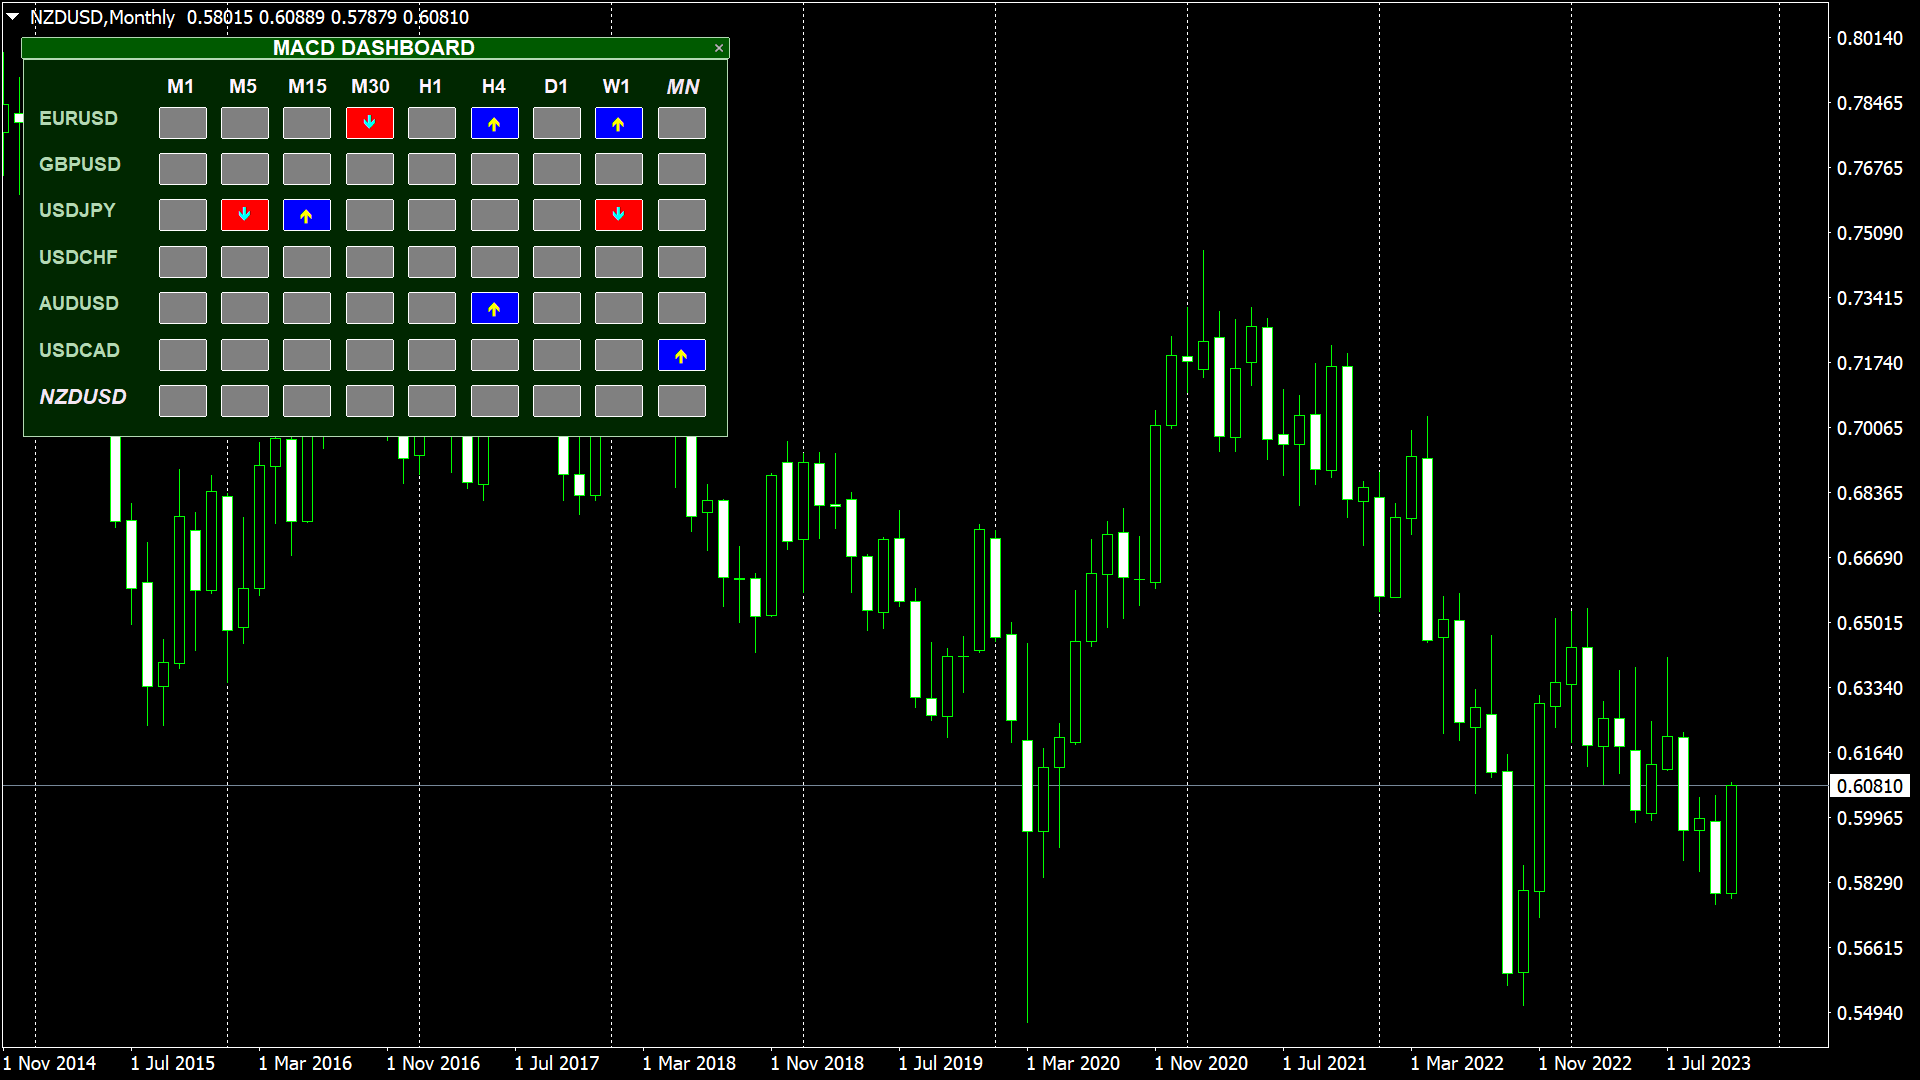
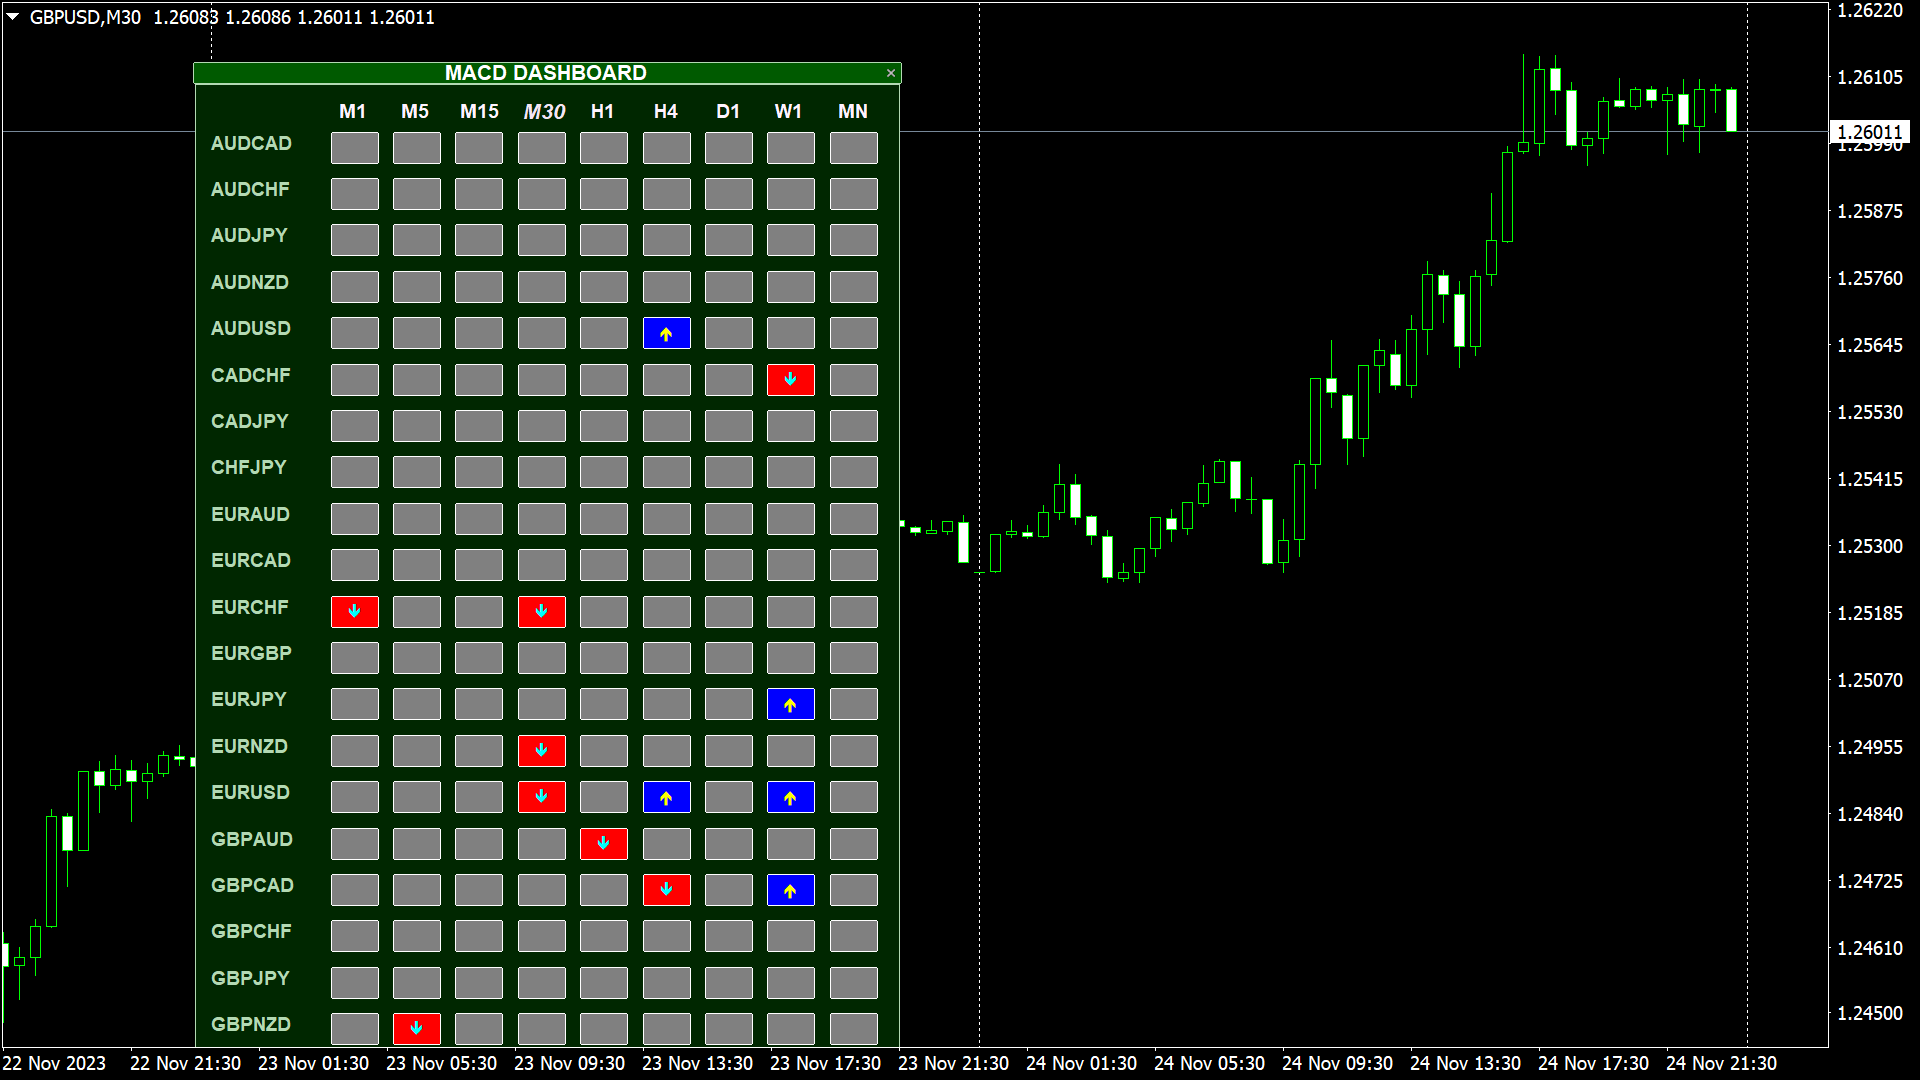
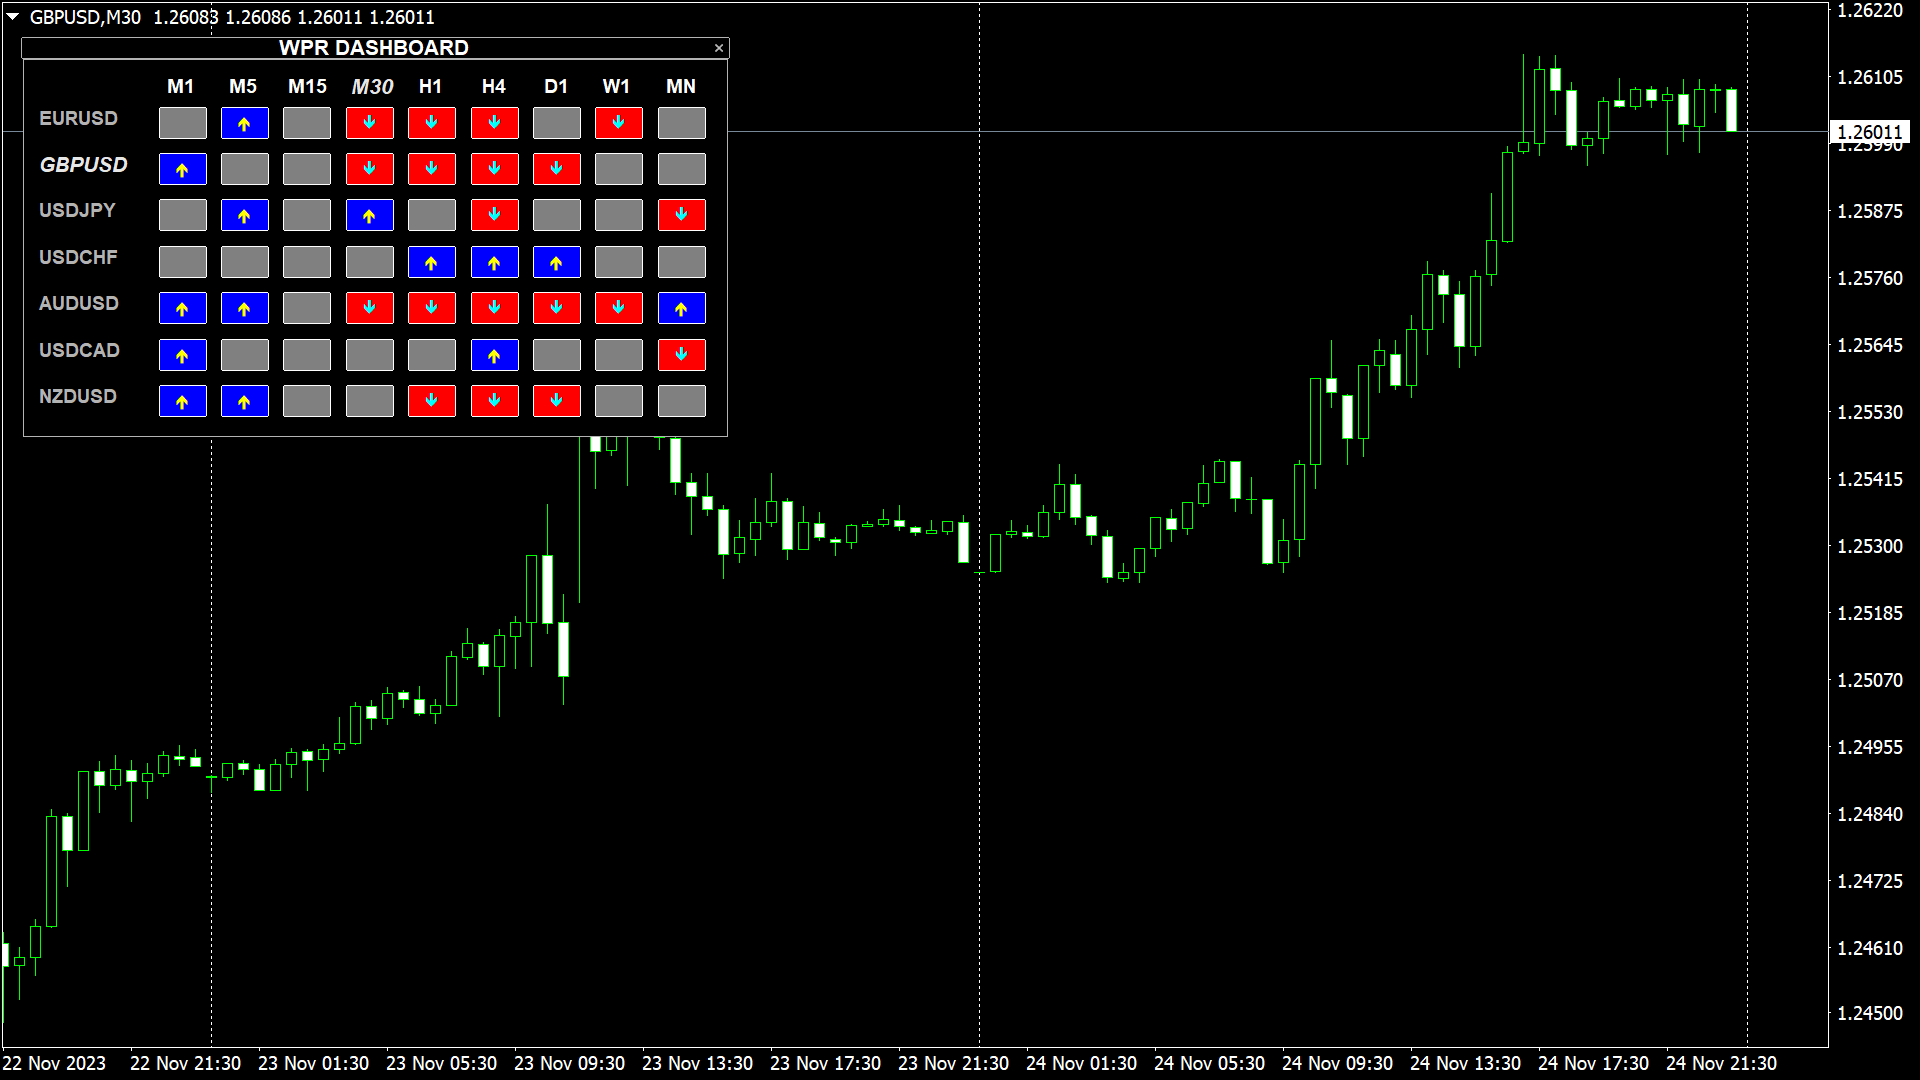
The UNIVERSAL DASHBOARD indicator will eliminate the need of using dozens of indicators on dozens of charts.
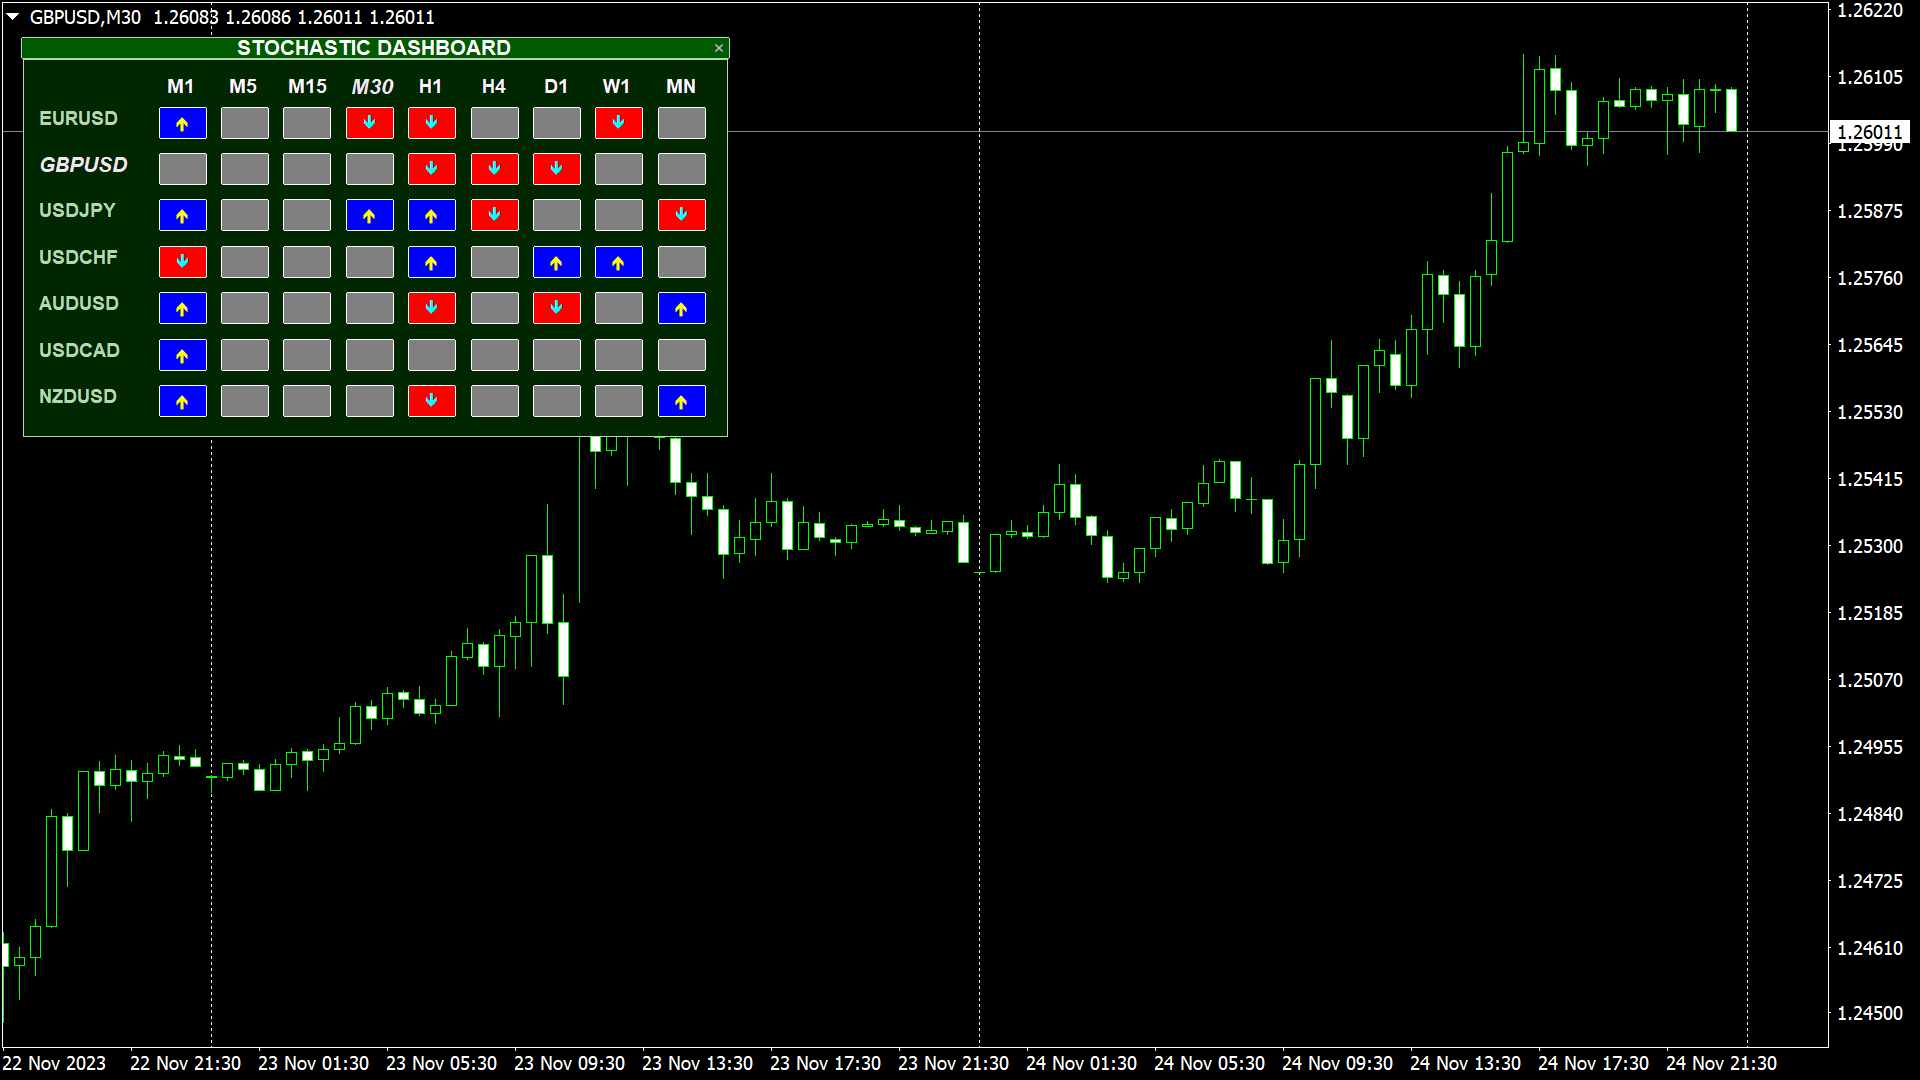
From one place you can monitor all the pairs and all the timeframes for each of the following indicators:
MACD
STOCHASTIC
WPR
RSI
CCI
You can also use any Custom indicator in the dashboard as long as it has a readable buffer.
With a single click you can quickly navigate between charts, pairs and timeframes.
Alerts will provide clear indication about what happens for your favorite pairs on all timeframes.
Note: Currently the UNIVERSAL DASHBOARD has all the indicators mentioned above and we planing to add more indicators as we go. Besides the custom indicator calling feature which makes the UNIVERSAL DASHBOARD real universal dashboard.