SL Currency Heatmap
- 지표
-
Chalin Saranga Jayathilake
 An awareness to my customers. I would like to give you an easy trading system to make good trades. Those who want to send me a private message.🦾🦾🦾 😘😘😘😘😘😘
Customer is king - 버전: 1.30
- 업데이트됨: 2 6월 2021
- 활성화: 5
Back testing can't; get indicator full performance
Trading the currency markets is a complex business. With so many pairs and multiple timeframes it is almost impossible to monitor them all – but with with the Currency Heatmap you can. The Currency Heatmap indicator delivers the information you need to base your trading decisions on the entire spectrum of currency pairs derived from the 8 major currencies; namely the US dollar, the Euro, the British Pound, the Swiss Franc, the Japanese Yen, the Canadian Dollar, the Australian Dollar and finally the New Zealand Dollar. In one clear and simple table, you can see instantly the entire weight of market sentiment across all 28 pairs and across all timeframes. A global view of risk and sentiment on one chart.
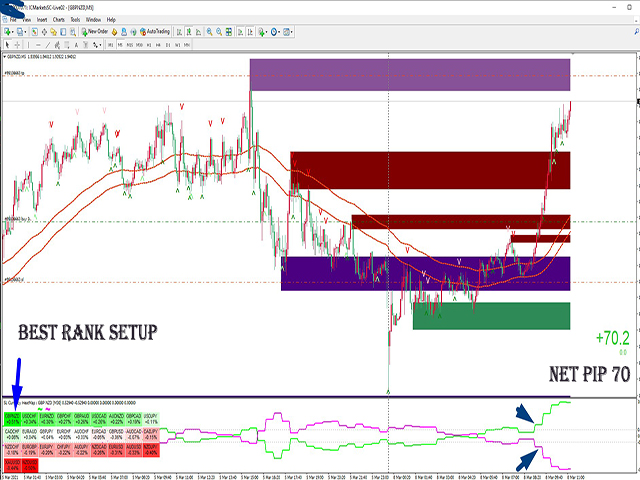
It instantly displays the “hottest” and “coldest” areas of the financial landscape. Vertically, 28 currency pairs are listed and ranked from the most bullish (top) to the most bearish pair (bottom) and reflect the data ranking on the associated currency matrix indicator. And this is where it gets interesting: horizontally, the performance scores of each currency pair are displayed in daily timeframes , daily,
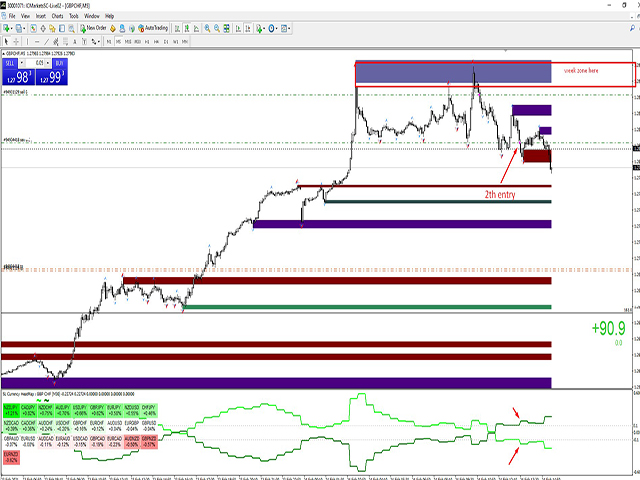
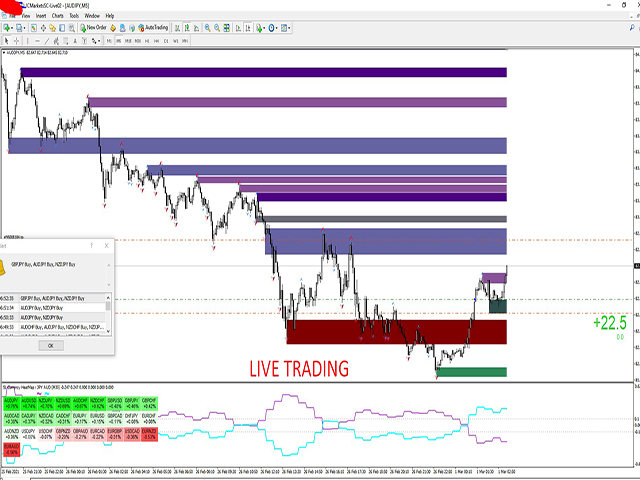
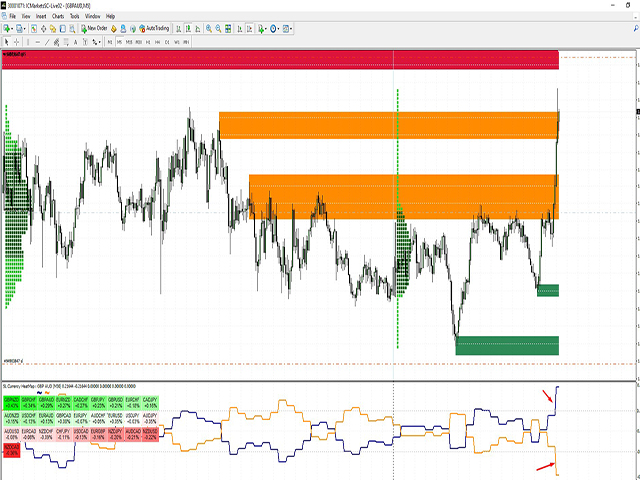
SL Currency Heatmap Supply Demand Zone Pro Indicator works with all products and timeframes. It is using a new calculation method, and now you can select the desired zone on any timeframe! Strongest Zones are already enabled by default This is a great advantage in trading.This indicator has a enabled by default, just move the chart.
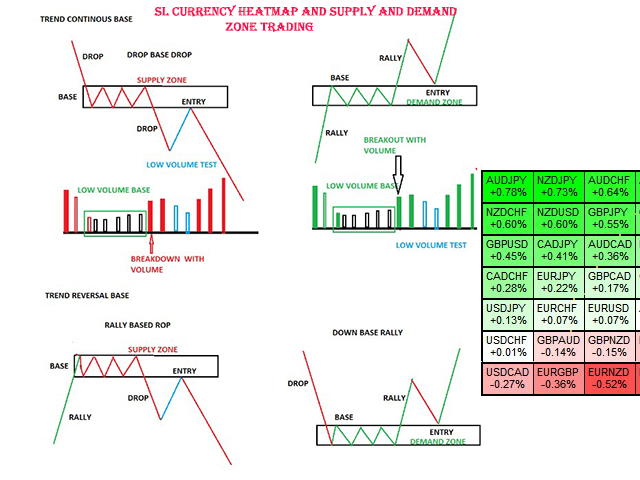
Supply and Demand ?
Supply is a price zone where sellers outnumbered buyers and drove the price lower.
Demand is a price zone where buyers outnumbers sellers and drove the price higher.
Charts symbol changer?
change evary 28 pair one click SL Currency Heatmap bottom click
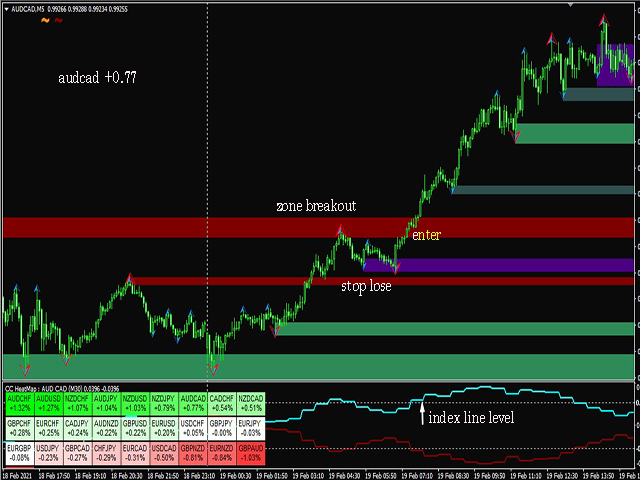
Currency Heatmap index
How to trade Heatmap indicator using
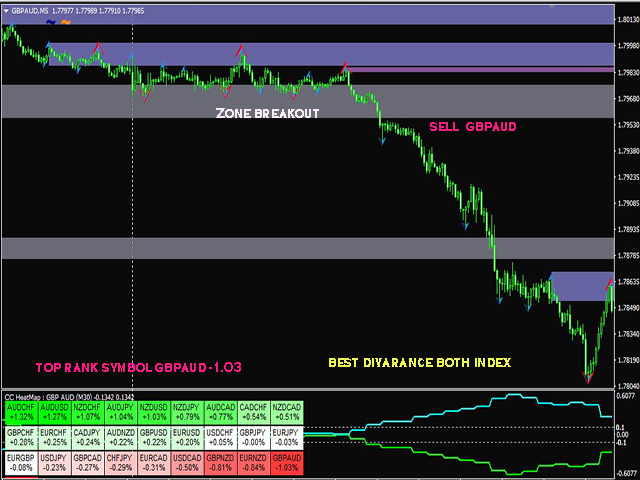
First check the last two symbols and the first symbol of the hitmap indi store.It ranks automatically the best positive symbol and the weak symbol in the live market.Then check the the supply for the need.The pairs which are ranged in small quantities can move fast in the London session. Later check the index lines.If it is breaked at 1.0 and -1.0 and shows a good difference, you must enter quickly. When it comes to a low risk point, the best time frames to sell these are 5 m and 15m.
Note
this indicator supply demand colour code we cants change
I look forward to giving you another valuable indicator that fits this process for free, Give me a personal massage
I will always help you if you have any questions.
Best regards, chalin


One of the most reliable indicators I've seen so far...Great support from Chalin as well...Keep it up !