Bitcoin Prophet Scalper

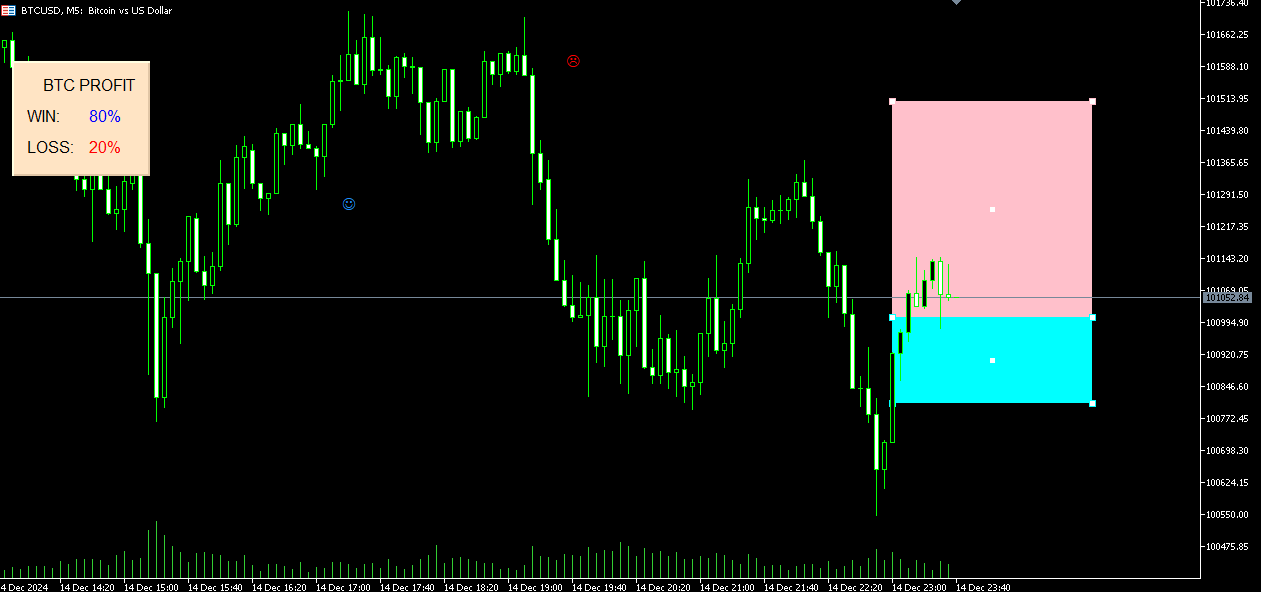
Detailed Explanation of Using the Indicator for Bitcoin Trading 1. Understanding the Indicator

The indicator uses moving averages and ATR (Average True Range) to detect trends and generate buy/sell signals. This is similar to Trade Sniper except designed for BTC

2. Setting Periods for Different Time Frames

Configure the indicator with periods suitable for each time frame. Here’s a suggested table for periods and ATR-based stoploss/take profit settings:

Time Frame  PERIOD Stoploss  Take Profit 
1-minute 10 1x ATR 2x ATR
5-minute 10 1.5x ATR 3x ATR
15-minute 15 2x ATR 4x ATR
1-hour 20 2.5x ATR 5x ATR
4-hour 30 3x ATR 6x ATR
Daily 50 4x ATR 8x ATR

3. Implementing Settings in the Indicator
  • MA Period: Set the moving average period according to the time frame.

  • ATR Period: Adjust the ATR period for volatility measurement.

  • Stoploss and Take Profit: Use the ATR multipliers to set dynamic stoploss and take profit levels.

4. Interpreting Signals
  • Bullish Signal: Indicates a buy signal, suggesting an uptrend.

  • Bearish Signal: Indicates a sell signal, suggesting a downtrend.

5. Tips for Effective Trading
  • Risk-Reward Ratio: Ensure a favorable ratio, typically 1:2 or higher.

  • Market Analysis: Combine indicator signals with other forms of analysis (e.g., candlestick patterns, volume).

  • Volatility Consideration: Adjust ATR multipliers based on current market conditions.

6. Cautionary Notes
  • False Signals: Volatile markets can produce false signals; use confirmation from other indicators.

  • Adaptability: Regularly review and adjust settings based on market changes.

By following these steps and considerations, you can effectively use the indicator to guide your Bitcoin trading decisions across different time frames.


추천 제품
Owl Smart Levels MT5
Sergey Ermolov
4.03 (32)
MT4 버전  |  FAQ Owl Smart Levels Indicator 는 Bill Williams 의 고급 프랙탈, 시장의 올바른 파동 구조를 구축하는 Valable ZigZag, 정확한 진입 수준을 표시하는 피보나치 수준과 같은 인기 있는 시장 분석 도구를 포함하는 하나의 지표 내에서 완전한 거래 시스템입니다. 시장과 이익을 취하는 장소로. 전략에 대한 자세한 설명 표시기 작업에 대한 지침 고문-거래 올빼미 도우미의 조수 개인 사용자 채팅 ->구입 후 나에게 쓰기,나는 개인 채팅에 당신을 추가하고 거기에 모든 보너스를 다운로드 할 수 있습니다 힘은 단순함에 있습니다! Owl Smart Levels 거래 시스템은 사용하기 매우 쉽기 때문에 전문가와 이제 막 시장을 연구하고 스스로 거래 전략을 선택하기 시작한 사람들 모두에게 적합합니다. 전략 및 지표에는 눈에 보이지 않는 비밀 공식 및 계산 방법이 없으며 모든 전략 지표는 공개되어 있습니다. Owl Smart Levels를 사
Noize Absorption Index
Ekaterina Saltykova
Noize Absorption Index - is the manual trading system that measures the difference of pressure between bears forces and bulls forces. Green line - is a noize free index that showing curent situation. Zero value of index shows totally choppy/flat market.Values above zero level shows how powerfull bullish wave is and values below zero measures bearish forces.Up arrow appears on bearish market when it's ready to reverse, dn arrow appears on weak bullish market, as a result of reverse expectation.
HMA Trend Professional MT5
Pavel Zamoshnikov
4.25 (4)
Improved version of the free HMA Trend indicator (for MetaTrader 4) with statistical analysis. HMA Trend is a trend indicator based on the Hull Moving Average (HMA) with two periods. HMA with a slow period identifies the trend, while HMA with a fast period determines the short-term movements and signals in the trend direction. The main differences from the free version: Ability to predict the probability of a trend reversal using analysis of history data. Plotting statistical charts for analyzi
Universal Soul Reaper
Pieter Gerhardus Van Zyl
Universal Soul Reaper is an atmospheric market-flow oscillator designed to interpret price behavior as a cycle of spiritual energy. Instead of reacting to raw price alone, it visualizes the state of the market’s soul —revealing when momentum is awakening, stabilizing, or fading. The indicator operates in a separate window and presents three interwoven entities: the Ectoplasmic Veil , the Spirit Boundary , and the Soul Core . Together, they form a living framework that helps traders sense pressu
The Ultimate Ichimoku MTF Dashboard: Your All-In-One Trading Edge Transform Your Trading with One Powerful Indicator Imagine having a professional trading assistant that monitors multiple timeframes simultaneously, identifies high-probability entries, warns you of potential reversals, and provides clear risk management guidance-all in one clean, intuitive display. That's exactly what the Ichimoku MTF Dashboard delivers.     Why This Isn't Just Another In
MACD Pro Master
Itumeleng Mohlouwa Kgotso Tladi
MACD Pro Master The MACD Pro Master is your ultimate trading companion, designed to revolutionize your financial journey and unlock the doors to wealth. Here's why it's the next best thing since sliced bread: Advantages Precision Trading : The MACD Pro Master leverages the powerful Moving Average Convergence Divergence (MACD) indicator to provide accurate buy and sell trades,  ensuring you capitalize on every market opportunity. Customizable Settings : Tailor the trading strategy to your unique
TRI Visualizer
Yoshimi Mon 三 Ura
TRI Visualizer MT5 – Thermodynamic Market Analysis Overview The TRI (Thermal Range Indicator) Visualizer Enhanced is a rare market analysis indicator that goes beyond conventional technical analysis, applying principles of thermodynamics from physics. It interprets market price fluctuations as “thermodynamic energy,” enabling the highly accurate detection of subtle market changes that are often overlooked. Innovative Mechanisms 1. Dual Calculation Engines Classic TRI Mode Formula: |Close
Smart Fib Retracement Zones For MT5 인디케이터 Smart Fib Retracement Zones For MT5 인디케이터 는 주요 피보나치 리트레이스먼트 데이터를 실시간으로 시각화하여 MetaTrader 5에서 최고의 동반자가 됩니다—당신이 필요로 하는 곳, 즉 당신의 존에서 바로 확인할 수 있습니다. 이 도구는 피보나치 리트레이스먼트 존 위에 레벨 분류, 핍 거리, 리트레이스먼트 비율, 존 강도와 같은 실행 가능한 데이터를 자동으로 오버레이하여 각 존 내부에 깔끔하게 배치합니다. intraday 스캘핑을 하든 일간 차트에서 주요 피보나치 레벨을 분석하든, 이 인디케이터는 표준 피보나치 리트레이스먼트를 지능형 존으로 변환하여 차트의 정보 가치를 즉시 높여줍니다. 주요 기능 피보나치 리트레이스먼트로부터 자동 존 생성 주요 피보나치 레벨(23.6%, 38.2%, 50%, 61.8%, 78.6%)에서 즉시 존을 생성합니다. 스윙 고점과 저점을 자동으로 감지하여
Trend Reversal Scanner MT5
Reza Aghajanpour
5 (8)
**   All Symbols   x   All Timeframes   scan just by pressing scanner button ** Discount: The price is $50$, But now it is just $39, Limited time offer is active. *** Contact me  to send you instruction and add you in "Trend Reversal group" for sharing or seeing experiences with other users. Introduction: Trendlines are the most famous technical analysis in trading . Trendlines continually form on the charts of markets across all the different timeframes providing huge opportunities for traders
This indicator presents an alternative approach to identify Market Structure. The logic used is derived from learning material created by   DaveTeaches (on X) Upgrade v1.10: + add option to put protected high/low value to buffer (figure 11, 12) + add  Retracements  value to buffer when Show Retracements When quantifying Market Structure, it is common to use fractal highs and lows to identify "significant" swing pivots. When price closes through these pivots, we may identify a Market Structure S
Heiken Ashi Smoothed Strategy is a very simple but powerful system to get forex market trend direction. This indicator is actually 2 indicators in 1 pack, Heiken Ashi and Heiken Ashi Smoothed Moving Average both included. Because HA (Heiken Ashi) and HAS (Heiken Ashi Smoothed) are calculated in the same one system event with necessary buffers and loop only, so it is the FAST, OPTIMIZED and EFFICIENT HA having the combined indicator of MetaTrader 5. You can choose to display HA and HAS in the sam
Volume Profile V6
Andrey Kolesnik
4.67 (3)
시장 매물대 지표(Volume Profile) + 스마트 오실레이터. 통화 쌍, 주식, 선물, 암호화폐 등 거의 모든 종목에서 작동하며, 실제 거래량(Real Volume)과 틱 거래량(Tick Volume)을 모두 지원합니다. 프로파일 생성 범위를 일주일이나 한 달 등으로 자동 설정할 수 있을 뿐만 아니라, 두 개의 수직선(빨간색과 파란색)을 이동하여 수동으로 범위를 설정할 수도 있습니다. 히스트그램 형태로 표시되며, 특정 가격 수준의 히스토그램 너비는 해당 가격대에서 발생한 거래량을 의미합니다. Mode level line color 파라미터를 사용하면 가격이 반등할 가능성이 높은 주요 매물대 수준을 자동으로 표시할 수 있으며, Maximum color 파라미터는 설정된 전체 범위에서 거래가장 많이 발생한 최대 거래량 수준을 별도로 보여줍니다. 스마트 오실레이터는 과매수 및 과매도 구간을 표시합니다. 여러 지표로부터 오는 정보를 분석하고, 처리된 데이터를 바탕으로 과매수 및 과매
# DRAWDOWN INDICATOR V4.0 - The Essential Tool to Master Your Trading ## Transform Your Trading with a Complete Real-Time Performance Overview In the demanding world of Forex and CFD trading, **knowing your real-time performance** isn't a luxury—it's an **absolute necessity**. The **Drawdown Indicator V4.0** is much more than a simple indicator: it's your **professional dashboard** that gives you a clear, precise, and instant view of your trading account status. --- ## Why This Indicator
DAILY OH/OL SDEV QUANT MODEL - STATISTICAL TRADING WITH PRECISION RISK MANAGEMENT TRADE WITH MATHEMATICAL CERTAINTY - KNOW YOUR EXACT STOP-LOSS AND TAKE-PROFIT BEFORE YOU ENTER This indicator analyzes 5,000+ days of price history to give you: Exact entry levels (sigma bands locked at daily open) Exact stop-loss distance (from M
SSL Indicator
Tiago Azevedo Amorim Martins
SSL 지표는 시장 트렌드를 쉽고 정확하게 식별할 수 있도록 설계된 매우 효율적이고 신뢰할 수 있는 추세 추종 도구입니다. 이동 평균을 기반으로 하는 SSL(스텝 스톱 라인) 지표는 색상을 변경하고 잠재적인 추세 반전이 있을 때 명확한 시각적 신호를 제공합니다. 이 도구는 강력한 시장 추세를 활용하면서 횡보 시장에서 흔히 발생하는 잘못된 신호를 피하고자 하는 트레이더에게 탁월합니다. 주요 특징: 정확한 추세 감지 : SSL 지표는 두 개의 이동 평균을 사용하여 매수 및 매도 신호를 계산합니다. 가격이 이 수준을 교차하면 지표가 색상을 변경하여 트레이더에게 진입 또는 종료 시점을 알립니다. 간단한 시각적 신호 : 지표는 차트에 선을 표시하며, 시장 상황이 변할 때 녹색(강세)에서 빨간색(약세)으로 색상이 변경됩니다. 이 직관적인 디자인은 의사 결정 과정을 단순화하여 초보자와 경험 많은 트레이더 모두에게 적합합니다. 사용자 정의 가능한 설정 : 이동 평균 기간을 사용자 전략에 맞게 조정
Pro Gold System Indicator
PEDRO JOAQUIM GONCALVES GOMES
ADVANCED FUNCTIONALITIES: Trend Score (0-100) with visual bar Intelligent signals with adjustable strength (1-10) Risk management with automatic TP/SL Audible and visual alerts Price zones with smooth filling Multi-indicator analysis (RSI, ATR, BB, EMAs) DESIGN FEATURES Modern Visual: Smooth and well-spaced lines (EMA with 2-3px width) Vibrant and professional colors (Sky Blue, Orange, Gold) Modern arrows (code 233/234) for buy/sell signals Configurable dark/light theme Adjustable transparency f
FXC iMACD-DivergencE MT5 Indicator This is an advanced MACD indicator that finds trend-turn divergences on the current symbol. The indicator detects divergence between the MACD and the price movements as a strong trend-turn pattern. Main features: Advanced divergence settings Price based on Close, Open or High/Low prices Give Buy/Sell open signals PUSH notifications E-mail sending Pop-up alert Customizeable Information panel Input parameters: MACD Fast-EMA: The Fast-EMA variable of the MACD indi
Stratos Pali mt5
Michela Russo
4.5 (8)
Stratos Pali Indicator is a revolutionary tool designed to enhance your trading strategy by accurately identifying market trends. This sophisticated indicator uses a unique algorithm to generate a complete histogram, which records when the trend is Long or Short. When a trend reversal occurs, an arrow appears, indicating the new direction of the trend. Important Information Revealed Leave a review and contact me via mql5 message to receive My Top 5 set files for Stratos Pali at no cost ! Down
Ichimoku Aiko MTF
Michael Jonah Randriamampionontsoa
Ichimoku Aiko MTF is a collection of technical indicators that show support and resistance levels, as well as momentum and trend direction. It is a multi-timeframe indicator so you don't need to change the chart timeframe when you want to see the ichimoku clouds on a higher timeframe.  eg. The chart timeframe is M15 and you want to see on the M15 timeframe chart the H1 ichimoku indicators (the ichimoku in Metatrader can't do that) that's why you need to use Ichimoku Aiko MTF.
The RSI Divergence + FVG Signal indicator combines Relative Strength Index (RSI) Divergence with Fair Value Gap (FVG) detection to generate high-probability buy and sell signals based on both momentum shifts and institutional imbalance zones. Core Features: RSI Divergence Detection : Identifies both regular and hidden bullish/bearish divergences between price and RSI. Divergences indicate potential trend reversals or continuation. FVG Zone Recognition : Detects Fair Value Gaps (imbalances caused
Heiken Ashi RSI Indicator for MT5
Mohammad Taher Halimi Tabrizi
Heikin Ashi RSI Indicator for MT5 (HARSI) Overview The Heikin Ashi RSI (HARSI) indicator combines Heikin Ashi candle smoothing with RSI momentum analysis, providing a dual-layer view of price action and relative strength. It offers a clear visualization of market direction, RSI-based overbought and oversold conditions, and optional backtesting and alert systems for strategy validation and trade signal automation. How It Works The indicator applies RSI values to Heikin Ashi calculations, creati
Volality Index Scalper
Lesedi Oliver Seilane
5 (1)
Volality Index scalper indicator  Meant for Volality pairs such as Volality 10, 25, 50, 75 and 100 The indicator works on all timeframes from the 1 minute to the monthly timeframe the indicator is non repaint the indicator has 3 entry settings 1 color change on zero cross 2 color change on slope change 3 color change on signal line cross Orange line is your sell signal Blue line is your buy signal.
Rigonstructor
Mark Lapukha
5 (1)
이것은 생성자입니다. 즉, 전략의 창시자입니다. 뿐만 아니라. 이것은 MetaTrader 5에 내장된 대부분의 표준 표시기에 대한 신호 표시기입니다. 표시기를 신호 화살표로 결합하세요. 예를 들어, 전략이 있고 수익성을 확인하고 메뉴에 필요한 항목을 포함하고 통계를 얻어야 합니다. 전략이 없다면 인터넷에서 활용하거나 직접 전략을 만드세요. Rigonstruktor가 이 모든 것을 도와드릴 것입니다. 이 키트에는 Forex, 스캘핑 및 바이너리 옵션에 대한 기성 전략이 포함되어 있습니다. 텍스트 지침이 포함되어 있습니다. 비디오 교육 강의가 이미 준비되어 있습니다. 지원과 도움을 위한 전보 채팅도 있습니다. 표시기를 가져와 연결하십시오. 화살을 얻으세요. 전략을 살펴보세요. 통계를 보고 결론을 도출해 보세요. 디자이너는 이에 대한 모든 것을 갖추고 있습니다. 그리고 시간 필터와 다양한 변형이 있습니다. 언제든지 지원 및 도움말 채팅을 통해 질문하고 알아볼 수 있습니다. 생성자의 버전이
Introduction The "Two Moving Average Crossover" indicator for MetaTrader 5 (MT5) is a technical analysis tool that displays two moving averages and notifies when the moving averages cross each other. The indicator calculates and plots two moving averages, one of which is faster and the other is slower. When the faster moving average crosses above the slower moving average, it is considered a bullish signal, indicating a potential trend reversal or the start of a new uptrend. Conversely, when th
Maximum Trend Arrows OT MT5
Mulweli Valdaz Makulana
STRICTLY FOR BOOM INDEX ONLY!!!!! Here I bring the Maximum Trend Arrows OT1.0 MT5 indicator. This indicator is made up of a combination of different trend indicators for entries and exits, for entries an orange arrow will paint on the chart below the current market and a red flag for closing of trades and it produces buy arrows only. When the orange arrow appears, it will appear along with it's sound to notify you. The 1H timeframe is recommended, don't use it anywhere else than on the 1H timefr
Cvd Divergence
Thalles Nascimento De Carvalho
CVD Divergence – 전문적인 주문 흐름 및 다이버전스 분석 CVD Divergence는 가격과 Cumulative Delta Volume(CVD) 사이의 신뢰할 수 있는 다이버전스를 감지하기 위해 개발된 기술적 지표입니다. 실제 주문 흐름이 가격 움직임을 확인하지 않을 때를 정확하게 포착하여, 잠재적 추세 전환, 매수·매도 세력의 소진, 기관의 시장 조작 가능성을 보여줍니다. 이 지표는 공격적인 거래량 분석과 가격 구조 해석을 결합해 명확하고 객관적이며 빠른 신호를 제공합니다. 지표 기능 CVD Divergence는 누적 델타 거래량을 사용하여 주문 흐름의 방향과 가격 방향을 비교합니다. 두 값이 크게 괴리될 경우 차트에 시각적 표시를 남기고 다이버전스 방향을 명확하게 보여줍니다. 다음과 같은 상황을 감지합니다: 강세 다이버전스 (가격이 하락하지만 CVD가 상승할 때) 약세 다이버전스 (가격이 상승하지만 CVD가 하락할 때) 매수·매도 세력의 힘 고갈 기관 주문 불균형으로
Rainbow EA MT5
Jamal El Alama
Description : Rainbow EA MT5 is a simple Expert advisor based on   Rainbow MT5 indicator witch is based on Moving average with period 34. The indicator is incorporated in the EA, therefore, it is not required for the EA to operate, but if you wish, you can download it from   my product page . The Expert Advisor settings are as follows : Suitable for Timeframes up to H1 The parameters below can be set according to your trading rules. StopLoss ( Stop Loss in pips) TakeProfit ( Take Profit in pips
Risk Reward Ratio
InvestSoft
4.75 (16)
This is the forex visual orders tool & forex position size (lot) calculator with intuitive panel. Risk Reward Ratio Indicator works on all kind of symbols: currency pairs, indices, metals, commodities, cryptocurrencies, etc.  If you want to make sure that Risk Reward Ratio Indicator works on your favorite symbols contact us ( visit our profile ) and ask for 7-day free trial to test this tool without limits. If you want to place orders easier, faster and more intuitive? If you like to mark trad
Cumulative Delta NG
Anton Polkovnikov
Cumulative delta indicator As most traders believe, the price moves under the pressure of market buying or selling. When someone redeems an offer standing in the cup, the deal is a "buy". If someone pours into the bid standing in the cup - the deal goes with the direction of "sale". The delta is the difference between purchases and sales. A cumulative delta - the difference between the cumulative sum of purchases and sales for a certain period of time. It allows you to see who is currently contr
Ichimoku Kinko Hyo is a purpose-built trend trading charting system that has been successfully used in nearly every tradable market. It is unique in many ways, but its primary strength is its use of multiple data points to give the trader a deeper, more comprehensive view into price action. This deeper view, and the fact that Ichimoku is a very visual system, enables the trader to quickly discern and filter "at a glance" the low-probability trading setups from those of higher probability. This i
이 제품의 구매자들이 또한 구매함
ARIPoint
Temirlan Kdyrkhan
1 (1)
ARIPoint is a powerful trading companion designed to generate high-probability entry signals with dynamic TP/SL/DP levels based on volatility. Built-in performance tracking shows win/loss stats, PP1/PP2 hits, and success rates all updated live. Key Features: Buy/Sell signals with adaptive volatility bands Real-time TP/SL/DP levels based on ATR Built-in MA Filter with optional ATR/StdDev volatility Performance stats panel (Success, Profit/Loss, PP1/PP2) Alerts via popup, sound, push, or email Cu
이 지표를 구매하면 제 프로페셔널 트레이드 매니저를 무료로 드립니다. 우선 이 거래 시스템이 리페인팅, 리드로잉 및 레이그 인디케이터가 아니라는 점을 강조하는 것이 중요합니다. 이는 수동 및 로봇 거래 모두에 이상적인 것으로 만듭니다. 온라인 강좌, 설명서 및 프리셋 다운로드. "스마트 트렌드 트레이딩 시스템 MT5"은 새로운 및 경험이 풍부한 트레이더를 위해 맞춤형으로 제작된 종합적인 거래 솔루션입니다. 10개 이상의 프리미엄 인디케이터를 결합하고 7개 이상의 견고한 거래 전략을 특징으로 하여 다양한 시장 조건에 대한 다목적 선택이 가능합니다. 트렌드 추종 전략: 효과적인 트렌드 추이를 타기 위한 정확한 진입 및 손절 관리를 제공합니다. 반전 전략: 잠재적인 트렌드 반전을 식별하여 트레이더가 범위 시장을 활용할 수 있게 합니다. 스캘핑 전략: 빠르고 정확한 데이 트레이딩 및 단기 거래를 위해 설계되었습니다. 안정성: 모든 인디케이터가 리페인팅, 리드로잉 및 레이그가 아니므로 신뢰
Power Candles MT5
Daniel Stein
5 (5)
Power Candles – 모든 시장을 위한 강도 기반 진입 신호 Power Candles 는 Stein Investments의 검증된 강도 분석을 가격 차트에 직접 제공합니다. 가격 움직임에만 반응하는 대신, 각 캔들은 실제 시장 강도를 기준으로 색상화되어 모멘텀 형성, 강도 가속, 명확한 추세 전환을 즉시 파악할 수 있습니다. 모든 시장을 위한 단일 로직 Power Candles는 모든 거래 심볼 에서 자동으로 작동합니다. 현재 심볼이 Forex인지 비-Forex 시장인지 자동으로 감지하여 내부적으로 적절한 강도 모델을 적용합니다. Forex 및 Gold 는 FX Power Delta 값을 사용합니다 (절대값 범위 최대 100) 지수, 크립토 및 CFD 는 IX Power Strength 값을 사용합니다 (절대값 범위 최대 50) 필요한 강도 계산은 Power Candles에 완전히 내장되어 있습니다. 캔들 색상이나 신호 로직을 위해 추가 인디케이터는 필요하지 않습니다. 가격
Divergence Bomber
Ihor Otkydach
4.9 (81)
이 지표를 구매하신 분께는 다음과 같은 혜택이 무료로 제공됩니다: 각 거래를 자동으로 관리하고, 손절/익절 수준을 설정하며, 전략 규칙에 따라 거래를 종료하는 전용 도우미 툴 "Bomber Utility" 다양한 자산에 맞게 지표를 설정할 수 있는 셋업 파일(Set Files) "최소 위험", "균형 잡힌 위험", "관망 전략" 모드로 설정 가능한 Bomber Utility의 셋업 파일 이 전략을 빠르게 설치, 설정, 시작할 수 있도록 돕는 단계별 영상 매뉴얼 주의: 위의 모든 보너스를 받기 위해서는 MQL5 개인 메시지 시스템을 통해 판매자에게 연락해 주세요. 독창적인 커스텀 지표인 “Divergence Bomber(다이버전스 봄버)”를 소개합니다. 이 지표는 MACD 다이버전스(괴리) 전략을 기반으로 한 올인원(All-in-One) 거래 시스템입니다. 이 기술 지표의 주요 목적은 가격과 MACD 지표 간의 다이버전스를 감지하고, **향후 가격이 어느 방향으로 움직일지를 알려주는
Entry In The Zone and SMC Multi Timeframe 은 Smart Money Concepts(SMC)를 기반으로 개발된 실시간 시장 분석 도구입니다. 이 시스템은 트레이더가 시장 구조를 체계적으로 분석하고 전체적인 시장 방향을 더욱 명확하게 파악할 수 있도록 설계되었습니다. 시스템은 여러 시간대에서 반전 포인트(Reversal Points), 핵심 구역(Key Zones), 그리고 시장 구조(Market Structure)를 자동으로 분석하며, POI(Point of Interest), 노 리페인트(No Repaint) 신호, 자동 피보나치 레벨(Auto Fibonacci Levels)을 표시하여 되돌림(Pullback)과 반전 포인트를 정확하게 탐지할 수 있도록 돕습니다. 또한 실시간 신호와 알림을 통해 가격이 핵심 구역에 진입하거나 해당 구역에서 반전 신호가 발생하는 순간을 놓치지 않도록 보조합니다. 더불어 이 시스템은 인디케이터와 신호 시스템을 하나로
SuperScalp Pro
Van Minh Nguyen
5 (1)
SuperScalp Pro – 고급 다중 필터 스캘핑 인디케이터 시스템 SuperScalp Pro는 클래식 Supertrend와 여러 지능형 확인 필터를 결합한 고급 스캘핑 인디케이터 시스템입니다. 해당 인디케이터는 M1부터 H4까지 모든 타임프레임에서 효율적으로 작동하며, 특히 XAUUSD, BTCUSD 및 주요 외환 통화쌍에 적합합니다. 독립형 시스템으로 사용하거나 기존 거래 전략에 유연하게 통합할 수 있습니다. 이 인디케이터는 11개 이상의 필터를 통합하며, 빠른/느린 EMA, 추세 판별용 3개의 EMA, EMA 기울기(EMA slope), RSI, ADX, 거래량(Volume), VWAP, 볼린저 밴드 돌파(Bollinger Bands Breakout) 및 MACD 다이버전스 필터 등을 포함합니다. 스마트 캔들 필터는 캔들 종가를 확인하여 약한 신호를 제거하고, 3 EMA와 MACD 다이버전스 필터를 결합한 추세 인식 메커니즘은 더 높은 승률의 신호를 선별하는 데 도움을 줍니
Azimuth Pro
Ottaviano De Cicco
5 (1)
LAUNCH PROMO Azimuth Pro price is initially set at 299$ for the first 100 buyers. Final price will be 499$ . THE DIFFERENCE BETWEEN RETAIL AND INSTITUTIONAL ENTRIES ISN'T THE INDICATOR — IT'S THE LOCATION. Most traders enter at arbitrary price levels, chasing momentum or reacting to lagging signals. Institutions wait for price to reach structured levels where supply and demand actually shift. Azimuth Pro maps these levels automatically: swing-anchored VWAP, multi-timeframe structure lines, an
무료 AUX 인디케이터와 EA 지원을 받으세요 직접 다운로드 — 여기를 클릭 [ D.I.C.E ] The DICE Indicator  Divergence in Chaos Environment는 엘리엇 파동 이론과 트레이딩 카오스 기법을 함께 사용하는 트레이더를 위해 설계된 MT5 전문 도구입니다. 가격 움직임의 숨겨진 및 일반 다이버전스를 감지하며, 빌 윌리엄스가 설명한 혼돈 시장 환경과 동기화됩니다. 주요 특징 엘리엇 파동 정렬 다이버전스: 파동 구조에 조화된 강세 및 약세 다이버전스를 탐지하여 파동 카운팅 정확도를 높입니다. 카오스 기법 통합: AO(오썸 오실레이터) 및 시장 구조 원칙과 일치하도록 설계되었습니다. 다중 타임프레임 스캐닝: 다양한 시간 프레임에서 다이버전스를 분석하여 모멘텀 변화와 추세 소진을 확인합니다. 시각적 알림 및 객체: 명확한 화살표, 선, 표시로 빠른 인식 가능. 적응형 시장 판독: 혼돈 시장 조건에 자동으로 조정되어 노이즈를 필터링하고 유효한 셋업만
Atomic Analyst MT5
Issam Kassas
4.07 (28)
우선적으로 언급할 점은이 거래 지표가 다시 그리지 않고 지연되지 않으며 이를 통해 수동 및 로봇 거래 모두에 이상적이라는 점입니다. 사용자 매뉴얼: 설정, 입력 및 전략. Atomic Analyst는 가격의 강도와 모멘텀을 활용하여 시장에서 더 나은 이점을 찾는 PA Price Action Indicator입니다. 고급 필터를 장착하여 잡음과 거짓 신호를 제거하고 거래 잠재력을 높이는 데 도움이 됩니다. 복잡한 지표의 다중 레이어를 사용하여 Atomic Analyst는 차트를 스캔하고 복잡한 수학적 계산을 간단한 신호와 색상으로 변환하여 초보 트레이더가 이해하고 일관된 거래 결정을 내릴 수 있도록합니다. "Atomic Analyst"는 새로운 및 경험이 풍부한 트레이더를위한 종합적인 거래 솔루션입니다. 프리미엄 지표와 최고 수준의 기능을 하나의 거래 전략에 결합하여 모든 종류의 트레이더에 대한 다재다능한 선택지가되었습니다. 인트라데이 거래 및 스캘핑 전략 : 빠르고 정확한 일일
Smart Stop Indicator – 차트 위에서 직접 작동하는 지능형 스톱로스 시스템 개요 Smart Stop Indicator는 감이나 추측이 아닌 명확하고 체계적인 방식으로 스톱로스를 설정하고 싶은 트레이더를 위한 맞춤형 솔루션입니다. 이 도구는 클래식 프라이스 액션 논리(고점, 저점 구조)와 현대적인 브레이크아웃 인식을 결합하여 실제로 가장 논리적인 다음 스톱 레벨을 정확히 식별합니다. 추세, 박스권, 빠른 브레이크아웃 상황 등 어떤 시장에서도 인디케이터는 최적의 SL 구역과 상태(“new”, “broken”, “valid”)를 차트에 직접 표시합니다. 새로운 기능으로 SL 거리의 %ADR 표시가 추가되었습니다. 핵심 기능 자동 시장구조 기반 스톱 설정 • 시장 구조와 실시간 가격 움직임을 기반으로 의미 있는 스톱로스 레벨을 자동으로 탐지합니다. 스마트 브레이크아웃 감지 • 빠른 방향 변화나 돌파 상황에서도 불필요한 조기 스톱 조정을 강요하지 않으며 유연하게 반응합
FX Power MT5 NG
Daniel Stein
5 (30)
FX Power: 통화 강세 분석으로 더 스마트한 거래 결정을 개요 FX Power 는 어떤 시장 상황에서도 주요 통화와 금의 실제 강세를 이해하기 위한 필수 도구입니다. 강한 통화를 매수하고 약한 통화를 매도함으로써 FX Power 는 거래 결정을 단순화하고 높은 확률의 기회를 발견합니다. 트렌드를 따르거나 극단적인 델타 값을 사용해 반전을 예측하고자 한다면, 이 도구는 귀하의 거래 스타일에 완벽히 적응합니다. 단순히 거래하지 말고, FX Power 로 더 스마트하게 거래하세요. 1. FX Power가 거래자에게 매우 유용한 이유 통화와 금의 실시간 강세 분석 • FX Power 는 주요 통화와 금의 상대적 강세를 계산하고 표시하여 시장 역학에 대한 명확한 통찰력을 제공합니다. • 어떤 자산이 앞서고 있고 어떤 자산이 뒤처지는지 모니터링하여 보다 현명한 거래 결정을 내릴 수 있습니다. 포괄적인 멀티 타임프레임 뷰 • 단기, 중기 및 장기 타임프레임에서 통화와 금의 강세를
Trend Screener Pro MT5
STE S.S.COMPANY
4.84 (100)
트렌드 표시기, 트렌드 트레이딩 및 필터링을 위한 획기적인 고유 솔루션, 하나의 도구 안에 내장된 모든 중요한 트렌드 기능! Forex, 상품, 암호 화폐, 지수 및 주식과 같은 모든 기호/도구에 사용할 수 있는 100% 다시 칠하지 않는 다중 시간 프레임 및 다중 통화 표시기입니다. Trend Screener는 차트에 점이 있는 화살표 추세 신호를 제공하는 효율적인 지표 추세 추종 지표입니다. 추세 분석기 표시기에서 사용할 수 있는 기능: 1. 트렌드 스캐너. 2. 최대 이익 분석이 있는 추세선. 3. 추세 통화 강도 측정기. 4. 경고가 있는 추세 반전 점. 5. 경고가 있는 강력한 추세 점. 6. 추세 화살표 Trend Screener Indicator가 있는 일일 분석 예, 일일 신호 성능...등은 여기에서 찾을 수 있습니다. 여기를 클릭하십시오. LIMITED TIME OFFER : Trend Screener Indicator는 50$ 및 평생 동안만 사용할 수 있습니다.
Entry Points Pro for MT5
Yury Orlov
4.48 (138)
다시 색을 칠하지 않고 거래에 진입할 수 있는 정확한 신호를 제공하는 MT5용 지표입니다. 외환, 암호화폐, 금속, 주식, 지수 등 모든 금융 자산에 적용할 수 있습니다. 매우 정확한 추정값을 제공하고 매수와 매도의 가장 좋은 시점을 알려줍니다. 하나의 시그널로 수익을 내는 지표의 예와 함께 비디오 (6:22)시청하십시오! 대부분의 거래자는 Entry Points Pro 지표의 도움으로 첫 거래 주 동안 트레이딩 결과를 개선합니다. 저희의   Telegram Group 을 구독하세요! Entry Points Pro 지표의 좋은점. 재도색이 없는 진입 신호 신호가 나타나고 확인되면(시그널 캔들이 완성된 경우) 신호는 더 이상 사라지지 않습니다. 여타 보조지표의 경우 신호를 표시한 다음 제거되기 때문에 큰 재정적 손실로 이어집니다. 오류 없는 거래 게시 알고리즘을 통해 트레이드(진입 또는 청산)를 할 이상적인 순간을 찾을 수 있으며, 이를 통해 이를 사용하는 모든 거래자의 성공률이
Super Signal – Skyblade Edition 전문가용 노리페인트 / 노래그 트렌드 신호 시스템, 뛰어난 승률 제공 | MT4 / MT5용 1분, 5분, 15분과 같은 낮은 타임프레임에서 가장 좋은 성능을 보입니다. 핵심 기능: Super Signal – Skyblade Edition은 추세 매매를 위해 설계된 스마트 신호 시스템입니다. 이 시스템은 다중 필터 로직을 활용하여, 명확한 방향성과 실질적인 모멘텀이 수반된 고품질 추세만을 감지합니다. 이 시스템은   고점 또는 저점을 예측하지 않으며 , 다음 세 가지 조건이 모두 충족될 때만 신호를 발생시킵니다: 명확한 추세 방향 강화되는 모멘텀 건전한 변동성 구조 또한, 시장 세션 기반의 유동성 분석을 통해 신호의 신뢰성과 타이밍을 더욱 향상시킵니다. 신호 특성: 모든 화살표 신호는 100% 리페인트 없음 / 지연 없음 신호가 한 번 발생하면 고정되며, 깜빡이거나 사라지지 않음 차트 상의 시각적 화살표, 정보 패널, 팝업
Transaction Speed MT5
Ivan Stefanov
5 (2)
이 지표는 시장에서 관심이 나타나는 영역 을 강조 표시한 후, 주문이 누적되는 영역 을 보여줍니다. 이는 **대규모 오더북(호가창)**처럼 작동합니다. 이것은 거대한 자금 을 위한 인디케이터입니다. 성능은 탁월하며, 시장에서 어떤 관심이 있든 반드시 포착할 수 있습니다 . (이것은 완전히 새로 작성되고 자동화된 버전 입니다 – 이제 수동 분석은 필요하지 않습니다.) **거래 속도(Transaction Speed)**는 새로운 개념의 인디케이터로, 시장에 대규모 주문이 언제, 어디에 쌓이는지를 보여주며 , 그 이점을 분석합니다. 매우 초기 단계에서 트렌드 전환 을 감지할 수 있습니다. FX 시장에서 흔히 사용하는 "거래량(volume)"은 오해입니다. 실제로는 시간당 가격 변화량 이므로, 올바른 용어는 거래 속도 입니다. 우리가 어떻게 사고하고, 행동하며, 분석하느냐 가 가장 중요합니다. 분석 패러다임의 전환 은 필수적입니다. 이 인디케이터는 외환 시장에서의 볼륨 개념을 논리적으로
FX Levels MT5
Daniel Stein
5 (12)
FX Levels: 모든 시장을 위한 뛰어난 정확도의 지지와 저항 간단 요약 통화쌍, 지수, 주식, 원자재 등 어떤 시장이든 믿을 만한 지지·저항 레벨을 찾고 싶나요? FX Levels 는 전통적인 “Lighthouse” 기법과 첨단 동적 접근을 결합해, 거의 보편적인 정확성을 제공합니다. 실제 브로커 경험을 반영하고, 자동화된 일별 업데이트와 실시간 업데이트를 결합함으로써 FX Levels 는 가격 반전 포인트를 파악하고, 수익 목표를 설정하며, 자신 있게 트레이드를 관리할 수 있게 돕습니다. 지금 바로 시도해 보세요—정교한 지지/저항 분석이 어떻게 여러분의 트레이딩을 한 단계 끌어올릴 수 있는지 직접 확인하세요! 1. FX Levels가 트레이더에게 매우 유용한 이유 뛰어난 정확도의 지지·저항 존 • FX Levels 는 다양한 브로커 환경에서도 거의 동일한 존을 생성하도록 설계되어, 데이터 피드나 시간 설정 차이로 인한 불일치를 해소합니다. • 즉, 어떤 브로커를 사용하
우선적으로, 이 거래 도구는 전문적인 거래에 이상적인 비-다시 그리기 및 지연되지 않는 지표입니다.  온라인 강좌, 사용자 매뉴얼 및 데모. 스마트 가격 액션 컨셉트 인디케이터는 신규 및 경험 많은 트레이더 모두에게 매우 강력한 도구입니다. Inner Circle Trader Analysis 및 Smart Money Concepts Trading Strategies와 같은 고급 거래 아이디어를 결합하여 20가지 이상의 유용한 지표를 하나로 결합합니다. 이 인디케이터는 스마트 머니 컨셉트에 중점을 두어 대형 기관의 거래 방식을 제공하고 이동을 예측하는 데 도움을 줍니다.  특히 유동성 분석에 뛰어나 기관이 어떻게 거래하는지 이해하는 데 도움을 줍니다. 시장 트렌드를 예측하고 가격 변동을 신중하게 분석하는 데 탁월합니다. 귀하의 거래를 기관 전략에 맞추어 시장의 동향에 대해 더 정확한 예측을 할 수 있습니다. 이 인디케이터는 시장 구조를 분석하고 중요한 주문 블록을 식별하고 다양
Grabber System MT5
Ihor Otkydach
4.82 (22)
탁월한 기술적 지표인 Grabber를 소개합니다. 이 도구는 즉시 사용 가능한 “올인원(All-Inclusive)” 트레이딩 전략으로 작동합니다. 하나의 코드 안에 강력한 시장 기술 분석 도구, 매매 신호(화살표), 알림 기능, 푸시 알림이 통합되어 있습니다. 이 인디케이터를 구매하신 모든 분들께는 다음의 항목이 무료로 제공됩니다: Grabber 유틸리티: 오픈 포지션을 자동으로 관리하는 도구 단계별 영상 매뉴얼: 설치, 설정, 그리고 실제 거래 방법을 안내 맞춤형 세트 파일: 인디케이터를 빠르게 자동 설정하여 최고의 성과를 낼 수 있도록 도와줍니다 다른 전략은 이제 잊어버리세요! Grabber만이 여러분을 새로운 트레이딩의 정점으로 이끌어 줄 수 있습니다. Grabber 전략의 주요 특징: 거래 시간 프레임: M5부터 H4까지 거래 가능한 자산: 어떤 자산이든 사용 가능하지만, 제가 직접 테스트한 종목들을 추천드립니다 (GBPUSD, GBPCAD, GBPCHF, AUDCAD, AU
Shock Pullback
Suleiman Alhawamdah
5 (1)
간단히 말해, 현재 캔들 옆에 흰색 숫자(‘핍’이라고 불림)의 움직임이 나타나기 시작하면 거래를 시작할 수 있습니다. 흰색 ‘핍’은 현재 매수 또는 매도 거래가 활성화되어 있으며 흰색으로 표시된 것처럼 올바른 방향으로 움직이고 있음을 나타냅니다. 흰색 핍의 움직임이 멈추고 정적인 녹색으로 바뀌면 이는 현재 모멘텀의 종료를 의미합니다. 숫자의 녹색은 매수 또는 매도 거래를 통해 얻은 총 수익을 ‘핍’ 단위로 나타냅니다. 또한, 인디케이터 내의 다른 고급 전문 분석 도구를 활용하여 거래를 시작할 수 있습니다. 인디케이터에 표시되는 신호와 색상을 관찰함으로써 높은 정확도로 수많은 스캘핑 기회를 포착할 수 있습니다. 테스트 중이거나 실시간 차트에서 인디케이터를 충분히 이해하는 것이 중요합니다. 대부분의 외환 시장에 적합: 금 거래 및 인기 있는 지수 시장(Dow Jones, S&P 500, Nasdaq, DAX 등), 그리고 EUR/USD, GBP/USD, USD/JPY 등 강력한 통화쌍
Market Structure Patterns
Samuel Manoel De Souza
4.47 (19)
Available for   MT4   and   MT5 . Join the Market Structure Patterns channel to download materials available for study and/or additional informations. Related posts: Market Structure Patterns - Introdução Market Structure Patterns   is an indicator based on   smart money concepts   that displays   SMC/ICT   elements that can take your trading decisions to the next level. Take advantage of the   alerts ,   push notifications   and   email messages   to keep informed from when an element is form
Quantum TrendPulse
Bogdan Ion Puscasu
5 (20)
SuperTrend   ,   RSI   ,   Stochastic   의 힘을 하나의 포괄적인 지표로 결합하여 트레이딩 잠재력을 극대화하는 궁극의 트레이딩 도구   인 Quantum TrendPulse를   소개합니다. 정밀성과 효율성을 추구하는 트레이더를 위해 설계된 이 지표는 시장 추세, 모멘텀 변화, 최적의 진입 및 종료 지점을 자신 있게 식별하는 데 도움이 됩니다. 주요 특징: SuperTrend 통합:   주요 시장 추세를 쉽게 따라가고 수익성의 물결을 타세요. RSI 정밀도:   매수 과다 및 매도 과다 수준을 감지하여 시장 반전 시점을 파악하는 데 적합하며 SuperTrend 필터로 사용 가능 확률적 정확도:   변동성이 큰 시장에서 숨겨진 기회를 찾기 위해 확률적 진동   을 활용하고 SuperTrend의 필터로 사용 다중 시간대 분석:   M5부터 H1 또는 H4까지 다양한 시간대에 걸쳐 시장을 최신 상태로 유지하세요. 맞춤형 알림:   맞춤형 거래 조건이 충족되면
IX Power MT5
Daniel Stein
4.92 (12)
IX Power: 지수, 원자재, 암호화폐 및 외환 시장 통찰력을 발견하세요 개요 IX Power 는 지수, 원자재, 암호화폐 및 외환 시장의 강도를 분석할 수 있는 다목적 도구입니다. FX Power 는 모든 가용 통화 쌍 데이터를 사용하여 외환 쌍에 대해 가장 높은 정확도를 제공하는 반면, IX Power 는 기초 자산 시장 데이터에만 초점을 맞춥니다. 이로 인해 IX Power 는 비외환 시장에 이상적이며, 다중 쌍 분석이 필요하지 않은 간단한 외환 분석에도 신뢰할 수 있는 도구입니다. 모든 차트에서 매끄럽게 작동하며, 거래 결정을 향상시키기 위한 명확하고 실행 가능한 통찰력을 제공합니다. 1. IX Power가 트레이더에게 유용한 이유 다양한 시장 강도 분석 • IX Power 는 지수, 원자재, 암호화폐 및 외환 심볼의 강도를 계산하여 각 시장에 맞는 통찰력을 제공합니다. • US30, WTI, 금, 비트코인 또는 통화 쌍과 같은 자산을 모니터링하여 거래 기회를 발견
ARIScalping
Temirlan Kdyrkhan
ARIScalp is a powerful trading companion designed to generate high-probability entry signals with dynamic TP/SL/DP levels based on volatility. Built-in performance tracking shows win/loss stats, PP1/PP2 hits, and success rates all updated live. Key Features: Buy/Sell signals with adaptive volatility bands Real-time TP/SL/DP levels based on ATR Built-in MA Filter with optional ATR/StdDev volatility Performance stats panel (Success, Profit/Loss, PP1/PP2) Alerts via popup, sound, push, or email Cus
ARICoins
Temirlan Kdyrkhan
ARICoin is a powerful trading companion designed to generate high-probability entry signals with dynamic TP/SL/DP levels based on volatility. Built-in performance tracking shows win/loss stats, PP1/PP2 hits, and success rates all updated live. Key Features: Buy/Sell signals with adaptive volatility bands Real-time TP/SL/DP levels based on ATR Built-in MA Filter with optional ATR/StdDev volatility Performance stats panel (Success, Profit/Loss, PP1/PP2) Alerts via popup, sound, push, or email Cust
Gold Sniper Scalper Pro
Ich Khiem Nguyen
3.5 (8)
Gold Sniper Scalper Pro는 MetaTrader 5용 전문 지표로, 트레이더가 진입 지점을 식별하고 리스크를 효과적으로 관리할 수 있도록 지원하기 위해 설계되었습니다. 이 지표는 시그널 감지 시스템, 자동 Entry/SL/TP 관리, 거래량 분석 및 실시간 성과 통계를 포함하는 포괄적인 분석 도구 세트를 제공합니다. 시스템 이해를 위한 사용자 가이드   |   기타 언어 사용자 가이드 주요 기능 시그널 감지 시스템 지표는 Price Action 분석 및 시장 구조를 기반으로 잠재적 진입 지점을 자동으로 감지합니다. 거래 기회 감지 시: - BUY 화살표(녹색) 또는 SELL 화살표(빨간색)가 차트에 표시됩니다 - 캔들이 색상으로 표시되어 시그널 영역을 식별합니다 - Entry/SL/TP 레벨이 자동으로 계산됩니다 시그널은 가격이 Entry 레벨에 도달할 때만 활성화되어, 시장에서 확인되지 않은 시그널을 필터링합니다. 지능형 Entry/SL/TP 관리 - Ent
FX Dynamic MT5
Daniel Stein
5 (5)
FX Dynamic: 맞춤형 ATR 분석으로 변동성과 트렌드를 파악하세요 개요 FX Dynamic 는 Average True Range(ATR) 계산을 활용하여 트레이더에게 일간 및 일중 변동성에 대한 뛰어난 인사이트를 제공하는 강력한 도구입니다. 80%, 100%, 130%와 같은 명확한 변동성 임계값을 설정함으로써 시장이 평소 범위를 초과할 때 빠르게 경고를 받고, 유망한 수익 기회를 재빨리 식별할 수 있습니다. FX Dynamic 는 브로커의 시간대를 인식하거나 수동으로 조정할 수 있으며, 변동성 측정 기준을 일관되게 유지하며, MetaTrader 플랫폼과 완벽하게 연동되어 실시간 분석을 지원합니다. 1. FX Dynamic이 트레이더에게 매우 유용한 이유 실시간 ATR 인사이트 • 하루 및 일중 변동성을 한눈에 모니터링하세요. ATR의 80%, 100%, 130% 임계값이 도달 또는 초과되면, 시장의 중요한 지점에 있음을 알 수 있습니다. • 변동성이 완전히 폭발하기
PZ Swing Trading MT5
PZ TRADING SLU
5 (5)
Protect against whipsaws: revolutionize your swing trading approach Swing Trading is the first indicator designed to detect swings in the direction of the trend and possible reversal swings. It uses the baseline swing trading approach, widely described in trading literature. The indicator studies several price and time vectors to track the aggregate trend direction and detects situations in which the market is oversold or overbought and ready to correct. [ Installation Guide | Update Guide | Tro
Introduction to X3 Chart Pattern Scanner X3 Cherart Pattern Scanner is the non-repainting and non-lagging indicator detecting X3 chart patterns including Harmonic pattern, Elliott Wave pattern, X3 patterns, and Japanese Candlestick patterns. Historical patterns match with signal patterns. Hence, you can readily develop the solid trading strategy in your chart. More importantly, this superb pattern scanner can detect the optimal pattern of its kind. In addition, you can switch on and off individu
Trend Forecaster
Alexey Minkov
5 (7)
The Trend Forecaster indicator utilizes a unique proprietary algorithm to determine entry points for a breakout trading strategy. The indicator identifies price clusters, analyzes price movement near levels, and provides a signal when the price breaks through a level. The Trend Forecaster indicator is suitable for all financial assets, including currencies (Forex), metals, stocks, indices, and cryptocurrencies. You can also adjust the indicator to work on any time frames, although it is recommen
Trend indicator AI mt5
Ramil Minniakhmetov
5 (13)
트렌드 인공 지능 지표는 실행 가능한 진입 점 및 반전 경고와 추세 식별을 결합하여 상인의 시장 분석을 향상시킬 훌륭한 도구입니다. 이 표시기는 사용자가 자신감과 정밀도로 외환 시장의 복잡성을 탐색 할 수 있도록 지원합니다 기본 신호 외에도 트렌드 인공 지능 지표는 풀백 또는 되돌림 중에 발생하는 2 차 진입 점을 식별하여 거래자가 기존 트렌드 내에서 가격 수정을 활용할 수 있도록합니다. 중요한 장점: ·작동 4 및 5 *명확한 구매 또는 판매 신호 *다시 칠하지 않습니다 *모든 자산에서 작동 나는 전보 사기에 개 또는 세트를 판매하지 않도록주의. 모든 설정은 블로그에 여기에 무료.  중요! 지침 및 보너스를 얻기 위해 구입 후 즉시 저에게 연락! 진짜 가동 감시는 뿐 아니라 나의 다른 제품 여기에서 찾아낼 수 있습니다: https://www.mql5.com/en/users/mechanic/seller&nbsp ; 설정 및 입력: 모든 자산에 대해 기본 설정을 권
제작자의 제품 더 보기
HFTHackerMT5
Thomas Bradley Butler
5 (1)
테스트 및 사용 전에 EA를 최적화하세요. 최적화한 경우에만 구매하세요. 이 EA는 최적화 방법을 알고 스스로 수익을 창출하고자 하는 트레이더를 위한 것입니다. 위험 매개변수를 직접 설정하세요. 높은 승률과 함께, 원하는 대로 작동하지 않는 거래에 대한 손절매가 가능합니다. 장기적인 관점에서 위험을 줄이세요. 모든 계정에 적용 가능하며 위험 관리 도구입니다. 모든 댓글, 설명, 블로그를 꼭 읽어보세요. MT4 버전: https://www.mql5.com/en/market/product/73834 이 전문가 자문(EA)은 각 포지션에 대해 고정된 랏 크기를 사용하여 매매 거래를 자동화합니다. AI를 사용하지 않으며, 수년 전에 개발되었으며, 수십억 달러에 달하는 화려한 수익 백테스트 조작이 아닌 건전한 원칙에 기반합니다. 핵심 기능은 계좌 잔액에 관계없이 일관된 거래 규모를 유지하여 트레이더가 거래별 위험을 완벽하게 통제할 수 있도록 하는 것입니다. 이러한 접근 방식은 계좌 규모나
ForexReversal
Thomas Bradley Butler
4 (1)
인내심은 스트레스 없는 스캘핑의 핵심입니다. 화살표가 200 이동 평균을 통과하는 것을 볼 때 거래하고 이동 평균 필터가 없는 마지막 스윙 포인트에서 확장하거나 추세를 만드십시오. 1분 시간 프레임에 적합하며 일중 움직임을 포착합니다. 후행 정지를 사용하여 쉽게 20핍을 가져오거나 더 큰 추세에 더 오래 머물 수 있습니다. 이 표시기에서 실제로 큰 거래의 사진에 있는 예를 보십시오. 1분의 시간 프레임이 가장 효과적입니다. 트렌드를 보려면 축소하십시오. 화살표는 다시 칠하거나 다시 계산하지 않습니다. 1분 시간 프레임에 연결하고 거래를 연구하고 전략에 사용할 수 있는지 확인하십시오. 나 규칙: 파란색 구매 레드 판매 옆 기간을 피하십시오 거래량이 많을 때 거래하고 모멘텀을 거래하십시오 손절매 사용 인내심은 스트레스 없는 스캘핑의 핵심입니다. 화살표가 200 이동 평균을 통과하는 것을 볼 때 거래하고 이동 평균 필터가 없는 마지막 스윙 포인트에서 확장하거나 추세를 만드십시오.
NeuroScalper
Thomas Bradley Butler
5 (1)
업데이트! 화살표가 100 및 200 레벨에 추가되었습니다. 이 지표는 극단적인 접근에 정확하고 주로 1분 기간 동안 매수 포지션을 지원합니다. 다른 시간 프레임을 사용할 수 있지만 수준이 다릅니다. 더 나은 오실레이터이며 차이점을 확인하기 위해 다른 오실레이터와 비교합니다. 신경망 개념을 사용한 데이 트레이드. 이 지표는 기본 형태의 신경망을 사용하여 구매 및 판매 신호를 생성합니다. 1분 차트에서 지표를 사용하십시오. 표시기는 다시 칠하지 않습니다. 1분 차트 또는 다른 레벨을 사용하는 다른 차트를 사용하여 테스터에서 다운로드하여 실행하고 거래를 분석하여 직접 확인하십시오. 시장을 스캘핑할 수 있는 많은 기회. 더 높은 시간 프레임에 사용할 수 있지만 수준은 재량에 따라 변경해야 합니다. 더 높은 시간 프레임은 더 높은 범위를 갖습니다. 이 모델에서 고려해야 할 개념 및 사항: 다중 표시기가 사용되고 가중치가 적용되며 최대 및 최소에 대한 2개의 데이터 포인트가 사용됩니다.
VolumeDayTrader
Thomas Bradley Butler
주식(CFD)에 대해서만 DAYTRADING. 거래에는 작업이 필요합니다. 모든 항목과 종료를 알려주는 바로 가기나 표시기는 없습니다. 이익은 마음의 상태에서 옵니다. 지표는 자금 관리 및 성공 심리학과 함께 사용되는 도구입니다. 볼륨 프로파일에서 불균형을 찾으십시오. 거래 가격 볼륨 불균형. 많은 불균형이 마감 및 공개 및 뉴스에서 발생합니다. 주식의 구매자 대 판매자를 참조하십시오. 5분에서 1시간 동안 사용하여 누가 가격을 통제하고 가격의 불균형을 찾을 수 있는지 확인합니다. 더 큰 주식은 15분 이상입니다. 이전 막대의 숫자를 보려면 색상 볼륨 막대 위로 마우스를 가져갑니다. 현재 막대 볼륨은 상단 모서리에 기록됩니다. 거래량의 불균형을 찾아 가격이 한동안 어떤 방향으로 갈지 확인하십시오. 최상의 결과를 위해 지배적인 경향을 따르십시오 추세가 발전하면 추세를 거래하십시오. 트레일링 스톱을 사용하고 큰 볼륨 반전 불균형을 주시하십시오.
GoldBuyBackScalper
Thomas Bradley Butler
4 (1)
이 표시는 XAU/USD, 1분 차트 전용입니다. 모든 쌍에는 고유한 특성과 가격 변동이 있습니다. 이 지표로 V자형 반전을 거래하십시오. 두피는 후행 정지를 사용하여 매수하고 뉴스는 더 극단적이고 갑작스러운 매도를 유발할 수 있으므로 뉴스를 피합니다. 백테스트에서 1분 시간 프레임에 연결하고 반전 매수를 확인합니다. 표시기는 다시 그리거나 다시 계산하지 않습니다. 활성 시간에만 거래 이 표시는 XAU/USD, 1분 차트 전용입니다. 모든 쌍에는 고유한 특성과 가격 변동이 있습니다. 이 지표로 V자형 반전을 거래하십시오. 두피는 후행 정지를 사용하여 매수하고 뉴스는 더 극단적이고 갑작스러운 매도를 유발할 수 있으므로 뉴스를 피합니다. 백테스트에서 1분 시간 프레임에 연결하고 반전 매수를 확인합니다. 표시기는 다시 그리거나 다시 계산하지 않습니다. 활성 시간에만 거래
TrueSupplyandDemand
Thomas Bradley Butler
This is based on short term strength or weakness and not on moving averages.  Moving averages are used for filter only. Trade supply and demand with arrows. Supply and demand breakouts and strength of the buyers or sellers .  Don't trade buy arrow to sell arrow.  Trade the strength with trendlines or moving averages and use stops.  The arrow can have some strong moves.  Trade on all time frames.  Try it out in the back tester. The pips can be made with this indicator, follow the arrows and make
ScalpingMaster
Thomas Bradley Butler
Master scalping with this indicator.  Trade on any time frame for scalps on buy or sells.  Follow trends using a 200 moving average and stops and targets.  Use with your own system.  This indicator can give pips if following it correctly.  Stick to rules and pick up pips daily.  Use as entries in a trend, scalp for a few pips or exit on opposite signal.  Best to follow higher time frame trends. Indicator doesn't repaint or recalculate. Rules: Don't trade overnight, only trade during active sessi
DayTradeKing
Thomas Bradley Butler
This indicator is good for small time frames like 1 and 5 minutes and made for day trading. The indicator never repaints or recalculates. The indicator works is for trading swing points in day trading, following bulls or bears.  Its a simple to use, non cluttered indicator with a high success rate.  This indicator works well to capture ranges.  All indicators come with limitations and no indicator or system is always accurate. Use money management for long term trading success.   Place in backte
DTKGold
Thomas Bradley Butler
This is the DayTradeKing for gold on a 1 minute time frame.  It is a different calculation for the range. Use a 200 period moving average as a filter.  Always use stops and avoid news, wait for more conformation.  This looks to capture intraday ranges. Put it in the back tester on 1 minute to see the price action and how it works. Trade with trend Use filter Use stops Alerts are added for pop ups and sound. 
SuperArrowScalper
Thomas Bradley Butler
Trade trends with the Super Scalper Use on all time frames and assets it is  designed for scalping trends. Works good on small time frames for day trading.  The arrows are easy to follow.  This is a simple no repaint/no recalculate arrow indicator to follow trends with.  Use in conjunction with your own system or use moving averages.  Always use stops just below or above the last swing point or your own money management system The indicator comes with push notifications, sound alerts and email
Levels Trading
Thomas Bradley Butler
This indicator is a simple stripped down version of any advanced support and resistance indicator.  All the support and resistance indicators work from a number of bars that have developed over time. Get rid of clutter and confusing levels.  Find levels according to a number of bars. Look at days, session, numbers of hours, periods of consolidation.  Watch levels develop and use as breakout points, or areas of buyers and sellers.  Features and things to consider This indicator is for a frame of
ForexReversalEA
Thomas Bradley Butler
https://www.mql5.com/en/market/product/57345 이 EA는 Forex Reversal 지표를 기반으로 합니다. 시스템을 수동으로 거래하고 싶다면 지표를 다운로드하여 사용해 보십시오. EA는 추세를 따르고 그에 따라 포지션을 열 것입니다. 결과는 더 낮은 드로다운으로 안정적인 이득을 보여주지만 백 테스터, 옵티마이저 및 시간 프레임에서 실험하여 무엇이 작동하는지 확인하십시오. 표시된 모든 결과는 가상입니다. 참고: 이것은 마틴게일이나 그리드가 아닙니다. 지표에 헤지 기능이 있습니다. 이 EA에는 다음과 같은 기능이 있으며 위험에 따라 변경하십시오. EA는 무료 마진에 따라 추가하고 매개변수에 따라 구매 및 판매합니다. 입력을 통해 위험을 제어합니다. inp 5는 판매 inp 7은 구매 고정 스톱 로트 고정 이익실현   여유 마진의 %
HFTHacker
Thomas Bradley Butler
최적화에 대한 사용자의 복잡성과 혼란으로 인해 복구 없이 간단한 버전으로 돌아갔습니다. 테스트 및 사용 전에 EA를 최적화하세요. 최적화한 경우에만 구매하세요. 최적화하는 방법을 알고 스스로 수익을 창출하고자 하는 트레이더를 위한 것입니다. 위험 매개변수를 설정합니다. 선택한 경우 작동하지 않는 거래에 대한 정지와 함께 높은 승률. 장수를 위해 위험을 줄입니다. 모든 계정에서 작동하며 위험 관리 도구입니다. 모든 의견, 설명 및 MT5 버전: https://www.mql5.com/en/market/product/74421 이 전문가 자문가(EA)는 트레이더의 계정 잔액에 따라 포지션 크기를 조정하는 동안 매수 및 매도 거래를 자동화합니다. 핵심 기능은 거래 크기를 동적으로 조정하여 계정이 늘어나거나 줄어들 때 위험이 사용 가능한 자본에 비례하도록 하는 것입니다. 이는 주어진 거래에서 과도한 레버리지 또는 너무 적은 위험을 감수하지 않고 일관된 거래 전략을 유지하는 데 도움이 됩
MarketMaker
Thomas Bradley Butler
수요 공급 거래를 자동화합니다. 시장을 만드십시오. 이 EA는 모두가 판매하고 모방하는 인기 있는 수요 공급 지표에서 영감을 받아 만들어졌습니다. EA는 거래와 헤징을 계속하여 시장을 만듭니다. 비 헤징 계정에서도 거래할 수 있습니다. 위험을 평가하고 시간 프레임, 로트 크기, 헤징 기능을 사용해야 합니다. 나는 한 번에 여러 쌍을 껐다가 켜고 한 달에 걸쳐 그것을 거래했습니다. 시스템의 개념: EA는 수요와 공급 수준을 거래합니다. EA가 계속해서 새로운 레벨을 거래할 수 있도록 레벨이 변경됩니다. 더 낮은 로트를 가진 많은 쌍 사이에 분배하는 것은 시스템의 기능입니다. 꾸준한 이득을 유지하면서 큰 하락은 피해야 합니다. SL을 사용할 수 있지만 이것이 옵션이 될 수 있도록 내가 설명한 헷지된 측면입니다. 많은 쌍에 대해 작은 로트에서 얻는 손실은 4%이며 이것은 SL이 없는 것입니다. 더 큰 로트는 6%를 보여주고 있습니다. 따라서 크기가 작을수록 보수적이며 크면 공격적
Top Trader
Thomas Bradley Butler
Top Trader Indicator This is an arrow reversal indicator. This is with deviations and arrows.  Trade a blue arrow for buy and trade a red arrow for sell.  Change the time period and the deviations of the bands.  This is similar to others but these arrows don't repaint.  Load in back tester and study which periods and deviations work the best.  It works on all time frames.  15 min to 1 hr would give good results for take profits.  Try according to your own risk management.
Quant Bot
Thomas Bradley Butler
Quant Bot은 EUR/USD에 대한 1시간 프레임의 추세 거래를 위한 것입니다. 설정된 파일은 없지만 다른 쌍을 사용하는 경우 최적화가 필요할 수 있습니다. 봇 정보: 그것은 유전자 생성을 사용하고 ATR을 사용하여 거래합니다. 커브 핏을 방지하기 위해 앞으로 걷기 기간이 사용되었습니다. EA는 모든 거래에 스탑을 사용합니다. 자금 관리는 잔액의 %로 확장됩니다. 백셋 기간은 2003-2020년이고 앞으로 나아가는 기간은 2020-2022년입니다. (사진 참조). Quant Bot은 EUR/USD에 대한 1시간 프레임의 추세 거래를 위한 것입니다. 설정된 파일은 없지만 다른 쌍을 사용하는 경우 최적화가 필요할 수 있습니다. 봇 정보: 그것은 유전자 생성을 사용하고 ATR을 사용하여 거래합니다. 커브 핏을 방지하기 위해 앞으로 걷기 기간이 사용되었습니다. EA는 모든 거래에 스탑을 사용합니다. 자금 관리는 잔액의 %로 확장됩니다. 백셋 기간은 2003-2020년이고 앞
Crypto Net
Thomas Bradley Butler
Crypto Net은 1시간 단위로 BTCUSD를 거래하기 위한 것입니다. 그것은 전략을 발전시키기 위해 유전자 진화를 사용합니다. 이 EA 거래 추세는 ATR 및 Ichimoku 지표를 따릅니다. 이것은 구축되었으며 Monte Carlo 및 Walk Forward를 포함한 다양한 테스트를 통과했습니다. 입력: 최소 위험인 계정 비율입니다. 최대 로트 수 거래 중단 시간 다른 것은 변경되지 않습니다. Crypto Net은 1시간 단위로 BTCUSD를 거래하기 위한 것입니다. 그것은 전략을 발전시키기 위해 유전자 진화를 사용합니다. 이 EA 거래 추세는 ATR 및 Ichimoku 지표를 따릅니다. 이것은 구축되었으며 Monte Carlo 및 Walk Forward를 포함한 다양한 테스트를 통과했습니다. 입력: 최소 위험인 계정 비율입니다. 최대 로트 수 거래 중단 시간 다른 것은 변경되지 않습니다.
PropTrader
Thomas Bradley Butler
*사용하기 전에 EA를 최적화하세요* EUR/USD에 최적화된 외환 트레이딩 전략 EA(Expert Advisor)를 통해 1~2년 내에 상당한 부를 달성한다는 것은 비현실적인 주장입니다. 백테스팅과 실제 거래는 EUR/USD 통화 쌍에 중점을 둡니다. 이 전략 정보: 이는 우리 전략의 초기 반복을 나타내며 추가 발전 가능성이 있습니다. 100% 품질 데이터로 엄격한 테스트를 거쳤으며 MT4 오류가 없습니다. 이 전략은 추세 추종의 논리적 원리에 따라 운영됩니다. 추세가 강세일 때 EA는 후행 정지를 전개하고 그 반대의 경우도 마찬가지입니다. 본질적으로 이는 간단한 추세 추종 접근 방식입니다. 주요 장점 및 고려 사항: 쉬운 설정: 기본 설정을 그대로 유지하고 원하는 대로 로트 크기만 수정합니다. 위험 관리: 이 전략에는 마틴게일이나 헤징이 사용되지 않습니다. 위험 완화: 각 거래에는 ATR(Average True Range)에 따라 결정되는 추적 중지 및 이익 실현 수준
Down Under
Thomas Bradley Butler
Down Under는 1시간 프레임에 AUD/USD 쌍을 거래합니다. 이 EA는 ATR과 OHLC를 거래합니다. 이 시간 프레임에 이 쌍에 대해 형식이 지정됩니다. 혼합은 분과 함께 사용됩니다. 로트 크기 및 최대. 로트 크기. 잔액의 백분율은 거래에서 승리하면 복리됩니다. 잔고가 변동함에 따라 로트 규모도 변동합니다. 설정: mm 위험 % mm 로트 최대 부지 변경할 사항이 없습니다. 이것은 마틴게일이나 헤징 기능이 없습니다. 변경할 다른 기능은 거래하는 경우 AUD/USD의 CFD입니다. 브로커 플랫폼에서 이를 소수로 변경합니다. 위험 면책 조항 선물, 옵션 및 통화 거래는 모두 잠재적인 보상이 크지만 잠재적인 위험도 큽니다. 이러한 시장에 투자하려면 위험을 인식하고 기꺼이 감수해야 합니다.
Cable Trader
Thomas Bradley Butler
GBP/USD 1 hr. 이 EA는 모멘텀과 세션을 거래합니다. 이것은 고정된 로트 구성요소를 가지고 있으며 개발함에 따라 TP를 계속 수정할 것입니다. 설정: 로트 크기 변경할 사항이 없습니다. 이것은 마틴게일이나 헤징 기능이 없습니다. 변경할 다른 기능은 거래하는 경우 GBP/USD의 CFD입니다. 브로커 플랫폼에서 이를 소수로 변경합니다. 위험 면책 조항 선물, 옵션 및 통화 거래는 모두 잠재적인 보상이 크지만 잠재적인 위험도 큽니다. 이러한 시장에 투자하려면 위험을 인식하고 기꺼이 감수해야 합니다. Cable Trade는 1시간 동안 GBP/USD 쌍을 거래합니다. 라이브 거래 전 데모. 이 EA는 모멘텀과 세션을 거래합니다. 이것은 고정된 로트 구성요소를 가지고 있으며 개발함에 따라 TP를 계속 수정할 것입니다. 설정: 로트 크기 변경할 사항이 없습니다. 이것은 마틴게일이나 헤징 기능이 없습니다. 변경할 다른 기능은 거래하는 경우 GBP/U
Euclidean
Thomas Bradley Butler
Euclidean은 제가 8년 전에 생각해낸 독특한 거래 알고리즘입니다. 이 EA는 이 시스템의 일부입니다. 닫힌 시스템으로 작동합니다. EA는 추세를 포착하기에 각도가 정확할 때 매수를 시작합니다. 정지 손실은 각도에서 10%입니다. 간단합니다. 입력: $1,000에 대한 로트 1 마이크로 로트의 잔액 비율 볼륨 상위 로트 = 최대 로트 수량 이익 수준 = 기본값은 50핍입니다. 방법 및 고려해야 할 사항: 손절매가 내장되어 10%의 각도에서 가격에 따라 거래됩니다. 이익실현은 50핍으로 설정되지만 원하는 금액일 수 있습니다. 1 5분과 같은 짧은 시간에 거래하십시오. 백 테스터에서 이것을 테스트하는 데 오류가 없었습니다. 플랫폼 및 브로커마다 데이터가 다르므로 테스트할 데이터 다운로드를 확인하십시오. Forex 거래에 대한 위험 고지 마진으로 외환 거래는 높은 수준의 위험을 수반하며 모든 투자자에게 적합하지 않을 수 있습니다. 과거의 성과가 미래의 결과를 나타내는
Pip Scalper
Thomas Bradley Butler
모두를 위한 지표 Pip Scalper는 스캘핑 트렌드입니다. 이 표시기로 추세를 더 오래 유지하십시오. 모든 시간 프레임과 자산에서 작동합니다. 이 도구로 매일 핍을 얻으십시오. 200 이동 평균을 사용하여 거래를 필터링하십시오. 더 짧은 기간을 권장합니다. 데이 트레이딩에 사용합니다. 정보 및 사용 방법: Pips Scalper는 장기 추세 거래를 기반으로 합니다. 파란색으로 구매 레드에 판매 200 이동 평균을 필터로 사용하고 활성 기간 동안 거래하십시오. Pip Scalper는 스캘핑 트렌드입니다. 이 표시기로 추세를 더 오래 유지하십시오. 모든 시간 프레임과 자산에서 작동합니다. 이 도구로 매일 핍을 얻으십시오. 200 이동 평균을 사용하여 거래를 필터링하십시오. 더 짧은 기간을 권장합니다. 데이 트레이딩에 사용합니다. 정보 및 사용 방법: Pips Scalper는 장기 추세 거래를 기반으로 합니다. 파란색으로 구매 레드에 판매 200 이동 평균을 필터로 사
Evolved Trends
Thomas Bradley Butler
테스트 전에 최적화하고 최적의 입력을 찾는 데 사용 안녕하세요, 상인 여러분! MT4 플랫폼에 대한 최첨단 전문가 조언을 원하십니까? Evolved Trends보다 더 이상 보지 마십시오! 기계 학습 기술로 만들어진 이 강력한 거래 알고리즘은 1시간 단위로 GBP/USD 거래에 중점을 둡니다. 하지만 최적화를 위해 다른 자산과 기간을 자유롭게 실험해 보세요! 자신의 위험 허용 범위에 맞게 입력을 사용자 정의하면 됩니다. ATR을 기반으로 한 중지와 이익을 고정하고 손실을 줄이는 기능을 갖춘 Evolved Trends는 모든 거래 시스템에 대한 최고의 자금 관리를 보장합니다. 또한 고유한 위험 조정 기능은 계정 잔액에 따라 조정됩니다. Evolved Trends로 트레이딩 게임을 한 단계 더 발전시키세요!
Combine Winner
Thomas Bradley Butler
Trade any Forex combine out there.  Many prop firms offer challenge or instant funding combines.  The biggest problem is controlling the loss.  With this indicator you can get a visual system that can limit loss and teach discipline.  This uses the MACD and the strategy is scalping.  You can determine the risk and reward.  Visually follow small trends for scalps.  Trade during active sessions.  It's just a simple system to instill discipline while limiting loss and scalping pips with the paramet
Holy Grail Arrow
Thomas Bradley Butler
Holy Grail arrow is for scalping.  The period you use will determine the trend.  You can try different time frames and periods to see what works best for your strategy.  Filters can be applied like a moving average or trendlines.  The 1 minute works good for scalps and always trade during active periods and avoid consolidation times.  Using other indicators to determine trends is recommended but this can also be a free flowing scalping system alone with tp and sl. Inputs: Period = trend period
Twenty Eight Forex Pairs
Thomas Bradley Butler
OPTIMIZE EA BEFORE TEST AND USE No EA turns hundreds into millions in a year or 2.  This is a lie if presented this way. Trade Twenty Eight Forex Pairs.  Use this EA to trade the pairs and time frames with tp and sl according to risk.  This comes with advanced money management built in.  It has break evens and take profits on 50% with sl and tp accordingly.  1 hour recommended but try on others for intraday or swing trading.
Fulltrend
Thomas Bradley Butler
Improve trading with this indicator.  Find areas of buys or sells in Fibonacci retracement areas.  Fulltrend is for scalping and making swing trades.  Fib levels are added for take profits and stop losses. This works on any time frame and can be used by itself or together with other systems and indicators for filters. The indicator doesn't repaint.  Alerts are added and can be true or false.  No need to sit glued to the computer, just set on charts and listen or the alerts to come.  Take a posi
Scalping Code
Thomas Bradley Butler
Scalping Code is for trend scalping.  It is simple to use and is profitable.  It can work on any time frame and any asset.  This indicator can be used on it's own or together with another system.  The arrow does not repaint or recalculate.   The rules are as follows:   A blue arrow above the moving average is a buy. An exit for the buy above the moving average is a red arrow or target. A red arrow below the moving average is a sell. An exit for the red below the moving average is a blue arrow
Order Flow Volume
Thomas Bradley Butler
OPTIMIZE BEFORE BACKTEST AND USE FOR A YEAR TO FIND BEST VALUES Order Flow is unique in that is trades the volume.  It was built on EUR/USD and is optimized from  11/11/2021 to 10/24/2022 on 1 hour charts.  Optimization inputs for money management are used.  This EA uses strict money management, it is not a get rich quick martingale or EA without a sl. Trading is about risk management, not gambling.   Run on EUR/USD 1 hour chart or if you want to find other assets and time frames to optimize th
AI Signal
Thomas Bradley Butler
AI Signal is an indicator that is a ready to made scalping system that doesn't repaint Instructions: Load indicator.  Use arrows as entries in trends and stay out of sideways markets.  Trade with the larger trend and trade only active volatile hours Buy blue arrow above yellow and exit at red arrow or at discretion.  Sell red arrow below yellow and exit at blue arrow  or at discretion.  Easy to follow and is based on trends.  The indicator works on all time frames and assets. Use at your own d
필터:
리뷰 없음
리뷰 답변