NTL Pivot Lines

Pivot Lines (PL) User Guide

Overview and Features

The Pivot Lines Indicator (PL) provides traders with a powerful tool for identifying potential support and resistance levels based on well-established pivot point calculation methods. By offering insights into possible price turning points, this indicator helps traders make more informed trading decisions and refine their entry and exit strategies. With customizable settings for different timeframes and calculation methods, PL is versatile and adaptable to various trading styles, whether for scalping, day trading, or swing trading.

Key Features

  • Multiple Calculation Methods
    Choose from four popular pivot point calculation methods:

    • Regular (Standard): Calculates pivot points and support/resistance levels based on traditional methods.
    • Camarilla: Provides closely clustered support and resistance levels ideal for intraday trading.
    • Woodie: Emphasizes the most recent closing prices for more adaptive levels.
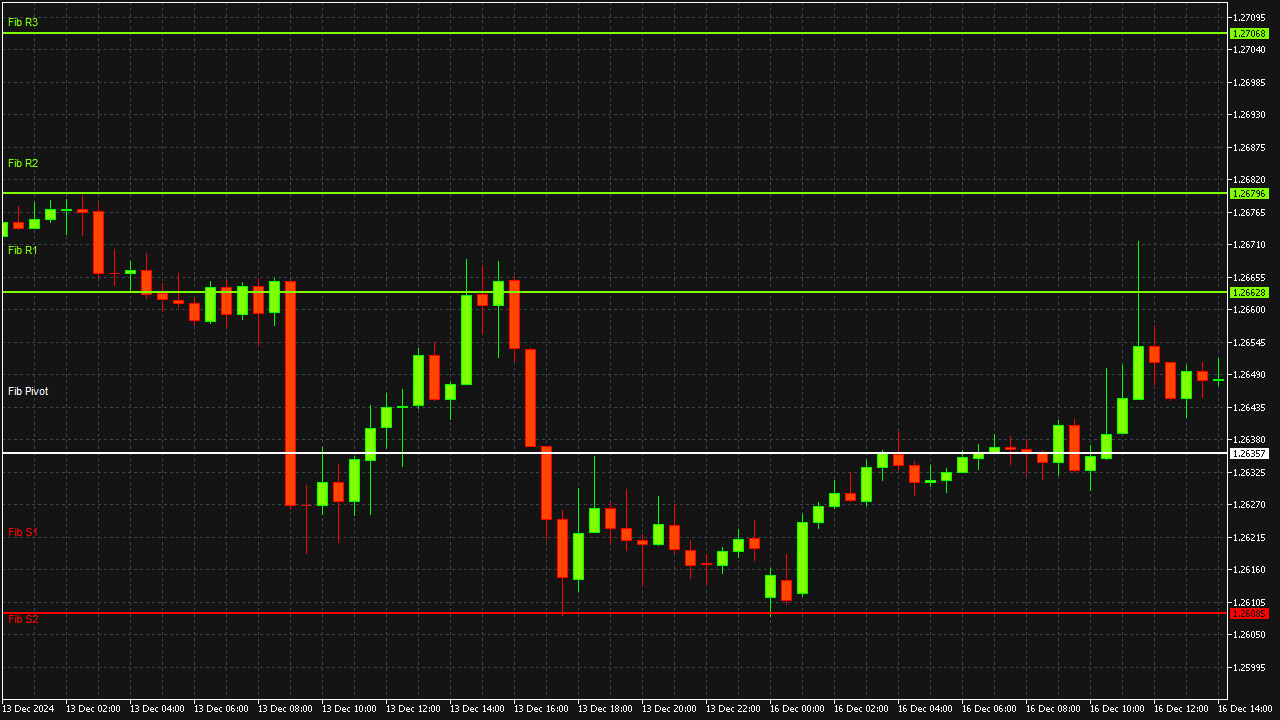
    • Fibonacci: Utilises Fibonacci retracement levels for identifying key reversal points.
  • Customisable Timeframes
    Set pivot levels on daily, weekly, or monthly timeframes, allowing traders to align the indicator with their specific trading strategy and time horizon.

  • Enhanced Decision-Making
    Provides visually defined pivot points and levels to aid in spotting potential support, resistance, and reversal areas, giving traders valuable insights for anticipating market movements.

  • Compatible with EAsiTrader EA: Provides signals to NTL EAsiTrader EA for automated trading.

PL is an essential tool for traders looking to strengthen their market analysis and gain a competitive edge. Whether you’re focusing on short-term or longer-term setups, this indicator helps you stay aligned with market dynamics.

Installation and Settings

This section provides the installation steps for setting up PL on your MQL5 platform, as well as detailed explanations of customizable settings to configure it for optimal performance.

Installation

  1. Install the Indicator:

    • Download the Pivot Lines indicator file (PL.ex5) and place it in the Indicators\NTL folder in your MQL5 platform directory. If this folder does not exist, create it manually.
    • Typical path: Terminal -> MQL5 -> Indicators -> NTL . Restart the platform to make the indicator appear in the Navigator panel.
  2. Apply to a Chart:

    • Open your desired chart, select the symbol and timeframe.
    • Drag the PL indicator from the Navigator panel onto your chart.
    • Configure the Input settings to customize PL, display options, and other parameters.
  3. Customize Settings:

    • Access the Input settings by double-clicking the indicator on the chart or through the Navigator panel.
  4. Save as Template:

    • Save your preferred settings as a template by right-clicking on the chart and selecting Template -> Save Template . Give it a descriptive name like PL_Custom for easy access.

Settings

  • EA Flag
    Set to true when loading this indicator with an EA. This will prevent the indicator drawing on the chart.

  • Period
    Defines the timeframe for calculating pivot points. Options include:

    • Daily: Calculates pivot points based on daily data, suited for intraday traders.
    • Weekly: Uses weekly data, providing a broader view for short-term and swing trading.
    • Monthly: Calculates from monthly data, ideal for longer-term market perspectives.
  • Method
    Selects the calculation method for pivot points, each offering different approaches to identifying support and resistance levels:

    • Regular: The standard calculation method, widely used across markets.
    • Camarilla: Provides closer support and resistance levels, useful in tight, range-bound markets.
    • Woodie: Gives more weight to the recent closing price, creating adaptive levels.
    • Fibonacci: Uses Fibonacci retracement levels to identify potential reversal points.
  • Font Size
    Defines the size of font to be used to display the level names.

  • Chart Label Style
    Determines the style used to display the level names. Use Label to show the name as a simple label, or use Boxed to show the name inside a rectangle box.

  • Chart Edge Alignment
    Determines which end of the line the level name is shown on the chart.

Advanced Usage and Strategy Integration

PL offers more than just basic support and resistance identification. By integrating this indicator into a broader trading strategy, traders can enhance the reliability of signals and optimize their setups. Here are some advanced usage tips and strategies for maximizing the indicator’s potential.

Combining with Other Indicators

  1. Moving Averages
    Use moving averages in conjunction with pivot points to identify trend direction. When price approaches a pivot point in the direction of the prevailing trend (e.g., price moving towards a support level in an uptrend), it may signal a strong continuation opportunity.

  2. Relative Strength Index (RSI)
    The RSI can help confirm pivot levels as potential reversal points. If the price is approaching a resistance level and the RSI indicates overbought conditions, this convergence can increase the probability of a price reversal at that level.

  3. MACD (Moving Average Convergence Divergence)
    MACD crossovers near pivot levels can act as additional confirmation. For example, a bullish MACD crossover near a support level can signal a high-probability buy setup.

Strategy Ideas for Different Market Conditions

  1. Range-Bound Markets
    In range-bound or consolidating markets, the Camarilla and Woodie pivot methods are particularly useful. These methods provide tighter support and resistance levels, helping to capture smaller price movements within defined boundaries. Using these levels with oscillators like RSI or Stochastic can improve timing for trades within a range.

  2. Trending Markets
    In trending markets, the Fibonacci pivot levels are valuable for identifying retracement points within the trend. For example, in an uptrend, look for price pullbacks to Fibonacci support levels as potential buying opportunities, using the indicator’s R1 and S1 levels to set profit targets or stop-loss levels.

  3. Intraday Scalping
    For scalpers, daily pivot levels (especially using the Regular method) can serve as effective support and resistance levels. Scalping around these levels with additional confirmation from volume indicators or short-term oscillators can enhance entry precision.

Trade Management and Risk Control

Utilize the pivot levels not only for entries but also as a tool for setting stop-loss and take-profit levels. Placing a stop-loss slightly below a support pivot (or above a resistance pivot) provides a logical area where the trade setup is considered invalidated. Similarly, taking profit at the next pivot level helps capture gains while reducing the risk of reversals.

Strategy Integration Tips

  • Backtesting: Test the indicator in various market conditions (e.g., trends, ranges) to understand how each pivot method performs.
  • Set Alerts: Set alerts on your trading platform for when price approaches a key pivot level to stay prepared for potential trade opportunities.
  • Adapt to Timeframes: Adjust the Period setting (daily, weekly, or monthly) based on your trading style. For instance, short-term traders may prefer daily pivots, while swing traders might benefit more from weekly or monthly levels.

PL is a flexible tool that complements various technical strategies, making it an essential addition to a comprehensive trading plan. By combining it with other indicators and adjusting to different market contexts, traders can gain a more nuanced understanding of price action and improve their trading outcomes.

Calculation Methods

PL offers four calculation methods for pivot points: Regular, Camarilla, Woodie, and Fibonacci. Each method provides a unique approach for identifying support and resistance levels based on previous price data.

1. Regular (Standard) Pivot Points

  • Pivot Point (PP) = (High + Low + Close) / 3
  • Support and Resistance Levels:
    • R1 = (2 * PP) - Low
    • S1 = (2 * PP) - High
    • R2 = PP + (High - Low)
    • S2 = PP - (High - Low)
    • R3 = High + 2 * (PP - Low)
    • S3 = Low - 2 * (High - PP)

2. Camarilla Pivot Points

  • Pivot Point (PP) = (High + Low + Close) / 3
  • Support and Resistance Levels:
    • R1 = Close + ((High - Low) * 1.1 / 12)
    • S1 = Close - ((High - Low) * 1.1 / 12)
    • R2 = Close + ((High - Low) * 1.1 / 6)
    • S2 = Close - ((High - Low) * 1.1 / 6)
    • R3 = Close + ((High - Low) * 1.1 / 4)
    • S3 = Close - ((High - Low) * 1.1 / 4)
    • R4 = Close + ((High - Low) * 1.1 / 2)
    • S4 = Close - ((High - Low) * 1.1 / 2)

3. Woodie Pivot Points

  • Pivot Point (PP) = (High + Low + 2 * Close) / 4
  • Support and Resistance Levels:
    • R1 = (2 * PP) - Low
    • S1 = (2 * PP) - High
    • R2 = PP + (High - Low)
    • S2 = PP - (High - Low)

4. Fibonacci Pivot Points

  • Pivot Point (PP) = (High + Low + Close) / 3
  • Support and Resistance Levels:
    • R1 = PP + 0.382 * (High - Low)
    • S1 = PP - 0.382 * (High - Low)
    • R2 = PP + 0.618 * (High - Low)
    • S2 = PP - 0.618 * (High - Low)
    • R3 = PP + 1.000 * (High - Low)
    • S3 = PP - 1.000 * (High - Low)

Indicator Buffers

PL provides data across nine buffers, one buffer for each pivot level. These buffers can be accessed when integrating PL with other indicators or Expert Advisors (EAs).

  • Buffer 0: PP (Pivot Point) Line values
  • Buffer 1: R1 Line values
  • Buffer 2: R2 Line values
  • Buffer 3: R3 Line values
  • Buffer 4: R4 Line values
  • Buffer 5: S1 Line values
  • Buffer 6: S2 Line values
  • Buffer 7: S3 Line values
  • Buffer 8: S4 Line values

Insights

PL provides a deeper understanding of price action by highlighting areas of high-probability support and resistance. Recognizing patterns in how price interacts with these pivot levels can offer valuable insights into market sentiment and potential reversals.

Identifying and Analyzing Key Patterns

  1. Price Reversal at Pivot Levels
    When price consistently reverses near a specific pivot level (such as R1, S1, or the central pivot point), it indicates that this level is holding strong as support or resistance. Observing these reversals over several periods suggests a possible trend or range boundary, making it a key area to watch for future setups.

  2. Breakout Beyond Pivot Levels
    When price decisively breaks through a pivot level, particularly R2/S2 or R3/S3, it often signals a stronger momentum move in that direction. This breakout can indicate a shift in sentiment, with buyers or sellers gaining control. Following these moves, consider using the next pivot level as a target or retracement point.

  3. Testing and Retesting
    If price repeatedly tests a pivot level without breaking it, this can signal that the market is accumulating strength for a breakout. Observing the frequency and strength of tests at key levels provides insights into the likelihood of a future breakout versus a potential reversal.

Using Pivot Levels as Trend Confirmation

Pivot points can also help confirm trends when analyzed over consecutive periods:

  • Consistent Higher Highs: If the price consistently closes above successive pivot points, this pattern reflects a bullish trend.
  • Consistent Lower Lows: Conversely, if the price continues closing below pivot levels, it suggests a bearish trend.

Volatility and Pivot Levels

In periods of high volatility, price often moves quickly between pivot levels, increasing the likelihood of reversals or breakouts. Monitoring how price reacts to pivot levels in such environments helps traders anticipate potential pullbacks and continuation points.

Differentiating Strong vs. Weak Signals

While pivot points offer strong guidance, consider these additional factors to assess the strength of signals:

  • Volume Confirmation: Higher trading volume near a pivot level reinforces the validity of a breakout or reversal, indicating strong interest at that price.
  • Time of Day: For intraday traders, pivot levels may hold different significance at certain times, such as market open or close, when trading volume typically increases.
  • Higher Timeframe Confluence: When daily pivot levels align with weekly or monthly levels, it adds strength to the level, making it more likely to act as a robust support or resistance area.

PL helps traders decode market behavior by providing reliable levels for anticipating price movement. By interpreting these patterns and combining them with other indicators or volume analysis, traders can gain valuable insights into the underlying market sentiment and improve their decision-making.

Rev: 14/11/24

추천 제품
FibExtender
Syed Oarasul Islam
This Indicator draws Fibonacci Extension levels in two different ways. You can select whether to draw Fibonacci Extension levels based on your favourite ZigZag settings or you can let the indicator to draw Fibonacci Extension  level based on given number of Bars or Candles.  You can also set Mobile and Email notification for your favourite Extension  levels individually. With this indicator you will not have to feel lonely as the it can generate Voice alerts, which will keep you focused on your
ArcTracer
Syed Oarasul Islam
This Indicator draws Fibonacci Arc levels in two different ways. You can select whether to draw Fibonacci Arc levels based on your favourite ZigZag settings or you can let the indicator to draw Arc levels based on given number of bars or candles.  You can also set Mobile and Email notification for your favourite Arc levels individually. With this indicator you will not have to feel lonely as the it can generate Voice alerts, which will keep you focused on your trading and remove boredom.  Produc
This Automatic support/resistance indicator calculates various peaks and troughs of the price action, identifies relevant levels and draws support and resistance automatically. It uses the built-in "ZigZag" indicator in Metatrader as a data source hence, very much accurate indicator.  The support and resistance lines are contineusely updated as new levels and formed. The indicator has only 5 parameters to set, and mostly it can be used with the default values:  The description of the settings is
웰컴 가격: 35달러 헤드 앤 숄더 패턴 은 신뢰할 수 있는 패턴 인식을 원하는 트레이더에게 이상적입니다. 강세 및 약세 헤드 앤 숄더 형성을 포함하며, 통합된 피보나치 레벨, 목선 돌파 감지 및 조기 예측 기술이 적용되었습니다. 차트 구조와 추세 반전을 정확하게 식별하는 기술적 분석을 중시하는 분들을 위한 강력한 MT5 도구입니다. 이중 감지 방법 방법 1 - 클래식 패턴 감지 명확한 구조적 규칙을 사용하여 표준 헤드 앤 숄더 패턴(일반형, 역형, 비표준형)을 감지합니다. 이 방법은 다음을 강조합니다: 명확한 목선 돌파 대칭적인 패턴 형성 피보나치 되돌림 레벨 기반 즉각적인 반응 구역 방법 2 - 예측적 패턴 감지 오른쪽 숄더가 형성되기 전에도 왼쪽 숄더와 머리를 조기에 식별하는 혁신적인 접근법입니다. 예측 삼각형 을 사용하며   Early_Quick_Pips 라인 을 그려 더 빠른 진입 지점과 가격 움직임에 대비할 시간을 제공합니다. 이 방법에서는 피보나치 레벨이 다르게 계산
Este indicador para Metatrader5 analiza múltiples timeframes dinámicamente para identificar máximos   y mínimos significativos según va avanzando el precio, proyectando niveles de recuperación   (Fibonacci o personalizados). Incluye sistema de caché para máximo   rendimiento y validación no intrusiva de timeframes.     CARACTERÍSTICAS PRINCIPALES: 1.   Análisis multi-timeframe (hasta 3 timeframes simultáneos) 2.   Dinámico: Sigue la evolución del precio   3. Sistema de caché inteligente (optimiz
Auto Fib Retracements
Ross Adam Langlands Nelson
4.2 (5)
Automatic Fibonacci Retracement Line Indicator. This indicator takes the current trend and if possible draws Fibonacci retracement lines from the swing until the current price. The Fibonacci levels used are: 0%, 23.6%, 38.2%, 50%, 61.8%, 76.4%, 100%. This indicator works for all charts over all timeframes. The Fibonacci levels are also recorded in buffers for use by other trading bots. Any comments, concerns or additional feature requirements are welcome and will be addressed promptly. 
FREE
Two-way Fibonacci indicator. The function is to facilitate traders to find their retracement and entry and exit points. The principle of the workpiece of this indicator: First, draw a V shape for the high and low points formed by the fractal indicator, and then draw a golden section proportional line for the V line, which can be applied to any period and currency pair.
스페셜 오퍼 : ALL TOOLS , 각 $35 에 구매 가능! New tools   will be   $30   for the   first week   or the   first 3 purchases !  Trading Tools Channel on MQL5 : Join my MQL5 channel to update the latest news from me 변동성이 큰 트레이딩 환경에서 강력하고 직관적인 분석 도구는 신속하게 기회를 포착하는 데 도움이 됩니다. Fibonacci Trend Scanner는 전통적인 피보나치(Fibonacci) 지표 기능과 SuperTrend를 통합할 뿐만 아니라, 통화쌍 스캔, 멀티 타임프레임 모니터링, 그리고 추세가 상승세에서 하락세로(또는 반대로) 전환될 때 인텔리전트 알림을 제공하도록 기능을 확장하였습니다. See more MT4 version at:   Fibonacci Trend MT4 Scanner See more products a
FiboPlus MT5
Sergey Malysh
The indicator automatically plots and tracks buy and sell Fibo levels at any symbol and timeframe. FiboPlus displays: Fibo levels of the probable upward or downward price movements. entry points are shown using "up arrow", "down arrow" icons. The data is doubled on SELL and BUY buttons. rectangle area limited by levels 0-100. Trading is performed from one level to another (no trend). Features price movement forecast, market entry points, stop loss and take profit for orders. ready-made trading
AUTO FIBONACCI MULTI-TIMEFRAME TOOLKIT Technical analysis tool that automatically draws Fibonacci levels for 4H, Daily, Weekly, and Monthly sessions. AUTOMATIC FIBONACCI RETRACEMENTS (7 CLASSIC LEVELS): - 0.0% (Previous session Low - support level) - 23.6% (Fibonacci Golden Ratio - early entry level) - 38.2% (Strong retracement level) - 50.0% (Key pivot level highlighted in YELLOW - market equilibrium) - 61.8% (Main Golden Ratio - critical decision level) - 78.6% (Deep retracement level) - 100.0
이전 버전의 인디케이터 개발 ZigZag WaveSize MT4 ZigZag WaveSize - 표준 ZigZag 인디케이터를 수정하여 포인트, 레벨 및 다양한 경고 로직에 대한 정보 추가 일반적인 개선 사항: MetaTrader 5 코드 적응 그래픽 객체 작업 최적화 새로운 기능: 극점에서의 수평 수준 수준 유형 선택: 수평/광선/세그먼트 유동성 수준 필터 (가격에 의해 돌파되지 않음) 돌파 버퍼: 거짓 돌파에 대한 민감도 설정 레이블 및 기능 설정: 수량, 외관, 오래된 레이블 삭제 구조 돌파 알림 (BoS) 움직임 성격 변경 알림 (ChoCH) 최적화: 극값 업데이트 로직 수정 새로운 객체의 동적 업데이트 바 출현 시 하중 감소 레이블의 중앙 집중 시스템 수정 사항: 배열 범위 초과 수정 레이블의 정확한 위치 지정 중복 파라미터 제거 ZigZag WaveSize 인디케이터를 귀하의 트레이딩 시스템의 보완재로 사용하세요   또한 시장에서의 나의 다른 제품도 시도해 보세요 
FREE
Fibonacci sequence is defined by integer sequence: 0, 1, 1, 2, 3, 5, 8, 13, 21, 34, 55, 89, 144, ... By definition, it starts from 0 and 1, the next number is calculated as a sum of two previous numbers. Instead of the standard moving average, the indicator uses the following calculation of average price: Bar0 + Bar1 + Bar2 + Bar3 + Bar5 + Bar8 + Bar13 + Bar21 + ... This indicator shows 2 moving Fibonacci lines and arrows when 2 these lines crossing each other. If an Aqua line is crossing a Yell
Unlock the power of Fibonacci with our advanced indicator! This tool precisely plots Fibonacci levels based on the previous day's high and low, identifying the next day's key support and resistance levels. Perfect for day trading and swing trading, it has consistently generated weekly profits for me. Elevate your trading strategy and seize profitable opportunities with ease. NOTE: In the Input section make sure the draw labels are set to "True" so you can see each levels.
Master head and shoulders patterns for better trading decisions A head and shoulders pattern is a chart formation that resembles a baseline with three peaks, the outside two are close in height and the middle is highest. It predicts a bullish-to-bearish trend reversal and is believed to be one of the most reliable trend reversal patterns. It is one of several top patterns that signal, with varying degrees of accuracy, that a trend is nearing its end.  [ Installation Guide | Update Guide | Troub
Fibonacci theft is an ultrascalping system that uses Fibonacci levels to launch a scalping system that allows theft   a few pips from the market. This system allows the use of fibonacci levels, predetermined levels or a level chosen by the user. It also presents the option of using or not volume and impulse filters. Being a very aggressive scalping system, it should only be used in pairs with a low spread and low commissions. This system is suitable for small accounts and can be used with only
Pattern Trader No Repaint Indicator MT5 Version Indicator searches for 123 Pattern, 1234 Pattern, Double Top, Double Bottom Patterns , Head and Shoulders, Inverse Head and Shoulders, ZigZag 1.618 and Father Bat Pattern. Pattern Trader indicator uses Zig Zag Indicator and Improved Fractals to determine the patterns. Targets and Stop Loss Levels are defined by Fibonacci calculations.  Those levels must be taken as a recommendation. The trader may use different tools like Moving Avarages,
Product Name: Anchor auto TP and SL Trade Manager Pro MT5 The ultimate manual assistant. Turns trades into auto-grids with Hedging, Zero-Loss Breakeven & Spread Detection. Your manual trade will be managed automatically. Anchor Auto TP and SL Trade Manager MT5 Pro is the advanced edition of our popular trade assistant. It transforms simple manual trades into sophisticated, professional-grade recovery grids. Unlike the free version, this PRO edition fully supports Hedging (simultaneous Buy & Sell
I want to present to you my solution in the implementation of automatic drawing of Fibo levels on the whole trend and the last trend leg. The logic of the indicator is based on the principle of swings, and when indicator gets a signal for a trend direction change, the previous key point before reversing is considered the start point of the indicator's drawing. When you test the indicator, note that changing the direction of the whole trend leg of Fibonacci often leads to a reversal of the trend.
Fibo World MT5
Pavel Verveyko
The indicator builds a graphical analysis based on the Fibonacci theory. Fibo Fan is used for the analysis of the impulses and corrections of the movement. Reversal lines (2 lines at the base of the Fibonacci fan) are used to analyze the direction of movements. The indicator displays the of 4 the target line in each direction. The indicator takes into account market volatility. If the price is above the reversal lines, it makes sense to consider buying, if lower, then selling. You can open posi
"The Squeeze indicator attempts to identify periods of consolidation in a market. In general the market is either in a period of quiet consolidation or vertical price discovery. By identifying these calm periods, we have a better opportunity of getting into trades with the potential for larger moves. Once a market enters into a "squeeze," we watch the overall market momentum to help forecast the market direction and await a release of market energy." The Modified TTM Squeeze Indicator is a modi
Indicator Description: 5 EMA with Ichimoku-like Color Filling   is a technical analysis indicator for MetaTrader 5 that combines five Exponential Moving Averages (EMAs) with visual fill areas similar to the Ichimoku Cloud concept. Key Features: Five EMA Lines : EMA1 (13-period): Fastest moving average EMA2 (21-period): Medium-fast moving average EMA3 (34-period): Base/reference moving average EMA4 (55-period): Medium-slow moving average EMA5 (233-period): Slowest moving average (often used as a
Description The base of this indicator is an ZigZag algorithm based on ATR and Fibo retracement. The ZigZag can be drawn like a classic ZigZag or like Arrows or needn't be drawn at all. This indicator is not redrawing in sense that the ZigZag's last shoulder is formed right after the appropriate conditions occur on the market. The shoulder doesn't change its direction afterwards (can only continue). There are some other possibilities to show advanced information in this indicator: Auto Fibo on
By default, MetaTrader 5 only supports timeframes of one minute or higher. Ultra-short-term charts such as 1-second or 5-second timeframes are not available in the standard platform. Seconds Chart Generator is a utility EA designed to generate seconds-based charts in real time using tick data, allowing traders to observe ultra-short-term price movements with precision. Simply attach it to any standard chart, and it will automatically create a custom symbol representing the seconds-based chart. Y
Historical Pivot Zones - Fibonacci Indicator MT5 Automatically draws Fibonacci retracement and projection zones based on historical price pivots. This MT5 indicator intelligently selects pivot points from different timeframes (weekly, monthly, or 6-month ranges) and creates visual Fibonacci zones around key levels. Features include: Smart Mode Selection - Auto-adjusts based on your chart timeframe Clean Visual Zones - Highlighted areas instead of just lines Essential Fib Levels - 9 retrace
Fibonacci Auto
Makarii Gubaydullin
지정된 시간 프레임의 고가 및 저가를 기반으로 피보나치 레벨을 자동으로 플로팅합니다 여러 바   를 결합할 수 있습니다: 예를 들어, 10일 간의 고가 및 저가를 기반으로 피보나치를 얻을 수 있습니다 나의   #1   도구 : 66+ 기능, 이 지표 포함  |   문의하기  |    MT4 버전 잠재적 반전 레벨을 확인하는 데 도움; 피보나치 레벨에서 형성된 패턴은 더 강한 경향이 있음; 수동   플로팅에   드는   시간   대폭  절약 ; 설정: 기준 고가 및 저가를 계산할 시간 프레임 기준 가격 계산을 위한 기간 수 현재(변동) 바 포함/제외 가능 각 레벨 사용자 정의 또는 비활성화 가능 (0으로 설정하여 끔) 전체 레벨 그룹 비활성화 가능: 메인, 상승 및 하락 확장 별도 선 색상, 스타일 및 두께  레벨 가격 표시 활성화/비활성화 가능 나의   #1   도구 : 66+ 기능, 이 지표 포함  |   문의하기  |    MT4 버전
Overview Harmonic Patterns MT5 is a technical analysis indicator designed for the MetaTrader 5 platform. It identifies and displays harmonic price patterns, such as Butterfly, Cypher, Crab, Bat, Shark, and Gartley, in both bullish and bearish directions. The indicator calculates key price levels, including entry, stop loss, and three take-profit levels, to assist traders in analyzing market movements. Visual elements and customizable alerts enhance usability on the chart. Features Detects six ha
Support nd resistance
Thabang John Wotsa
Indicator Description: Support & Resistance Rectangles This custom indicator for   MetaTrader 5   automatically draws   support and resistance zones   on your chart. It does not use buffers or plots; instead, it creates filled rectangle objects to visually highlight price areas where the market has previously reversed or stalled. How It Works The indicator divides the chart history into consecutive blocks of   Lookback   bars. For each block, it: Finds the   lowest low   and   highest high   wit
Fibonacci sequence is defined by integer sequence: 0, 1, 1, 2, 3, 5, 8, 13, 21, 34, 55, 89, 144, ... By definition, it starts from 0 and 1, the next number is calculated as a sum of two previous numbers. Instead of the standard moving average, the indicator uses the following calculation of average price: Bar0 + Bar1 + Bar2 + Bar3 + Bar5 + Bar8 + Bar13 + Bar21 + ... Input parameters: fiboNum - numbers in the following integer sequence for Fibo Moving Average 1. 5 on default. fiboNum2 - numbers i
Trend Reversal Scanner MT5
Reza Aghajanpour
5 (8)
**   All Symbols   x   All Timeframes   scan just by pressing scanner button ** Discount: The price is $50$, But now it is just $39, Limited time offer is active. *** Contact me  to send you instruction and add you in "Trend Reversal group" for sharing or seeing experiences with other users. Introduction: Trendlines are the most famous technical analysis in trading . Trendlines continually form on the charts of markets across all the different timeframes providing huge opportunities for traders
이 제품의 구매자들이 또한 구매함
ARICoins
Temirlan Kdyrkhan
ARICoin is a powerful trading companion designed to generate high-probability entry signals with dynamic TP/SL/DP levels based on volatility. Built-in performance tracking shows win/loss stats, PP1/PP2 hits, and success rates all updated live. Key Features: Buy/Sell signals with adaptive volatility bands Real-time TP/SL/DP levels based on ATR Built-in MA Filter with optional ATR/StdDev volatility Performance stats panel (Success, Profit/Loss, PP1/PP2) Alerts via popup, sound, push, or email Cust
SuperScalp Pro
Van Minh Nguyen
5 (8)
SuperScalp Pro – 고급 다중 필터 스캘핑 인디케이터 시스템 SuperScalp Pro는 클래식 Supertrend와 여러 지능형 확인 필터를 결합한 고급 스캘핑 인디케이터 시스템입니다. 해당 인디케이터는 M1부터 H4까지 모든 타임프레임에서 효율적으로 작동하며, 특히 XAUUSD, BTCUSD 및 주요 외환 통화쌍에 적합합니다. 독립형 시스템으로 사용하거나 기존 거래 전략에 유연하게 통합할 수 있습니다. 이 인디케이터는 11개 이상의 필터를 통합하며, 빠른/느린 EMA, 추세 판별용 3개의 EMA, EMA 기울기(EMA slope), RSI, ADX, 거래량(Volume), VWAP, 볼린저 밴드 돌파(Bollinger Bands Breakout) 및 MACD 다이버전스 필터 등을 포함합니다. 스마트 캔들 필터는 캔들 종가를 확인하여 약한 신호를 제거하고, 3 EMA와 MACD 다이버전스 필터를 결합한 추세 인식 메커니즘은 더 높은 승률의 신호를 선별하는 데 도움을 줍니
AriX
Temirlan Kdyrkhan
1 (4)
AriX Indicator for MT5 A powerful trend-following and signal-evaluation tool AriX is a custom MT5 indicator that combines Moving Averages and ATR-based risk/reward logic to generate clear buy/sell signals. It visualizes dynamic SL/TP levels, evaluates past trade outcomes, and displays win/loss statistics in a clean on-chart panel. Key features include: Buy/Sell signals based on MA crossovers ATR-based SL/TP1/TP2/TP3 levels with visual lines and labels Signal outcome tracking with real-time stat
이 지표를 구매하면 제 프로페셔널 트레이드 매니저를 무료로 드립니다. 우선 이 거래 시스템이 리페인팅, 리드로잉 및 레이그 인디케이터가 아니라는 점을 강조하는 것이 중요합니다. 이는 수동 및 로봇 거래 모두에 이상적인 것으로 만듭니다. 온라인 강좌, 설명서 및 프리셋 다운로드. "스마트 트렌드 트레이딩 시스템 MT5"은 새로운 및 경험이 풍부한 트레이더를 위해 맞춤형으로 제작된 종합적인 거래 솔루션입니다. 10개 이상의 프리미엄 인디케이터를 결합하고 7개 이상의 견고한 거래 전략을 특징으로 하여 다양한 시장 조건에 대한 다목적 선택이 가능합니다. 트렌드 추종 전략: 효과적인 트렌드 추이를 타기 위한 정확한 진입 및 손절 관리를 제공합니다. 반전 전략: 잠재적인 트렌드 반전을 식별하여 트레이더가 범위 시장을 활용할 수 있게 합니다. 스캘핑 전략: 빠르고 정확한 데이 트레이딩 및 단기 거래를 위해 설계되었습니다. 안정성: 모든 인디케이터가 리페인팅, 리드로잉 및 레이그가 아니므로 신뢰
FX Trend MT5 NG
Daniel Stein
5 (4)
FX Trend NG: 차세대 멀티 마켓 트렌드 인텔리전스 개요 FX Trend NG 는 다중 시간 프레임 기반의 전문 트렌드 분석 및 시장 모니터링 도구입니다. 몇 초 만에 전체 시장 구조를 파악할 수 있도록 설계되었습니다. 여러 차트를 일일이 전환할 필요 없이, 어떤 종목이 추세에 있는지, 어디에서 모멘텀이 약화되고 있는지, 그리고 어떤 시간 프레임이 서로 정렬되어 있는지 즉시 확인할 수 있습니다. 출시 기념 특별 혜택 – FX Trend NG 를 $30 (6개월) 또는 $80 평생 라이선스 로 이용할 수 있습니다. 이미 Stein Investments 고객이신가요? -> 메시지를 보내 전용 고객 그룹에 참여하세요. 설정이나 사용 방법이 필요하신가요? -> Stein Investments 공식 페이지 를 방문하세요. 1. FX Trend NG가 특별한 이유 3단계 추세 로직 – 단순한 Buy / Sell이 아닙니다 • 대부분의 지표는 Buy 또는 Sell 두 가지 상태만 제
Divergence Bomber
Ihor Otkydach
4.89 (83)
이 지표를 구매하신 분께는 다음과 같은 혜택이 무료로 제공됩니다: 각 거래를 자동으로 관리하고, 손절/익절 수준을 설정하며, 전략 규칙에 따라 거래를 종료하는 전용 도우미 툴 "Bomber Utility" 다양한 자산에 맞게 지표를 설정할 수 있는 셋업 파일(Set Files) "최소 위험", "균형 잡힌 위험", "관망 전략" 모드로 설정 가능한 Bomber Utility의 셋업 파일 이 전략을 빠르게 설치, 설정, 시작할 수 있도록 돕는 단계별 영상 매뉴얼 주의: 위의 모든 보너스를 받기 위해서는 MQL5 개인 메시지 시스템을 통해 판매자에게 연락해 주세요. 독창적인 커스텀 지표인 “Divergence Bomber(다이버전스 봄버)”를 소개합니다. 이 지표는 MACD 다이버전스(괴리) 전략을 기반으로 한 올인원(All-in-One) 거래 시스템입니다. 이 기술 지표의 주요 목적은 가격과 MACD 지표 간의 다이버전스를 감지하고, **향후 가격이 어느 방향으로 움직일지를 알려주는
Entry In The Zone and SMC Multi Timeframe is a real-time market analysis tool developed based on Smart Money Concepts (SMC). It is designed to analyze market structure, price direction, reversal points, and key zones across multiple timeframes in a systematic way. The system displays Points of Interest (POI) and real-time No Repaint signals, with instant alerts when price reaches key zones or when signals occur within those zones. It functions as both an Indicator and a Signal System (2-in-1), c
RFI levels PRO MT5
Roman Podpora
3.67 (3)
이 지표는 추세 반전 지점과 가격 반등 영역을 정확하게 보여줍니다.       주요 투자자들   . 새로운 트렌드가 형성되는 곳을 파악하고 최대한 정확하게 의사결정을 내리며 모든 거래를 완벽하게 통제합니다. TREND LINES PRO   지표와 함께 사용할 때 최대의 잠재력을 발휘합니다.  VERSION MT4 지표가 보여주는 내용: 새로운 추세의 시작 시 활성화되는 반전 구조 및 반전 수준. 최소한의 위험 대비 수익률을 갖는 이익 실현   (TAKE PROFIT)   및   손절매(STOP LOSS)   레벨 표시       RR 1:2   . 지능형 손실 감소 로직이 적용된 손절매 기능. 지정된 지표에서 두 가지 추세 유형에 대한 반전 패턴을 표시합니다. 지표: 트렌드를 따라   트렌드 라인 프로   (글로벌 트렌드 변화) 트렌드 프로   (빠른 트렌드 변화) 간단하고 효과적입니다       스캐너       실시간 추세 (신규). 다중 시간 프레임 도구 필터링. 표시하다  
FX Power MT5 NG
Daniel Stein
5 (31)
FX Power: 통화 강세 분석으로 더 스마트한 거래 결정을 개요 FX Power 는 어떤 시장 상황에서도 주요 통화와 금의 실제 강세를 이해하기 위한 필수 도구입니다. 강한 통화를 매수하고 약한 통화를 매도함으로써 FX Power 는 거래 결정을 단순화하고 높은 확률의 기회를 발견합니다. 트렌드를 따르거나 극단적인 델타 값을 사용해 반전을 예측하고자 한다면, 이 도구는 귀하의 거래 스타일에 완벽히 적응합니다. 단순히 거래하지 말고, FX Power 로 더 스마트하게 거래하세요. 1. FX Power가 거래자에게 매우 유용한 이유 통화와 금의 실시간 강세 분석 • FX Power 는 주요 통화와 금의 상대적 강세를 계산하고 표시하여 시장 역학에 대한 명확한 통찰력을 제공합니다. • 어떤 자산이 앞서고 있고 어떤 자산이 뒤처지는지 모니터링하여 보다 현명한 거래 결정을 내릴 수 있습니다. 포괄적인 멀티 타임프레임 뷰 • 단기, 중기 및 장기 타임프레임에서 통화와 금의 강세를
Azimuth Pro
Ottaviano De Cicco
5 (4)
LAUNCH PROMO Azimuth Pro price is initially set at 299$ for the first 100 buyers. Final price will be 499$ . THE DIFFERENCE BETWEEN RETAIL AND INSTITUTIONAL ENTRIES ISN'T THE INDICATOR — IT'S THE LOCATION. Most traders enter at arbitrary price levels, chasing momentum or reacting to lagging signals. Institutions wait for price to reach structured levels where supply and demand actually shift. Azimuth Pro maps these levels automatically: swing-anchored VWAP, multi-timeframe structure lines, an
Grabber System MT5
Ihor Otkydach
4.82 (22)
탁월한 기술적 지표인 Grabber를 소개합니다. 이 도구는 즉시 사용 가능한 “올인원(All-Inclusive)” 트레이딩 전략으로 작동합니다. 하나의 코드 안에 강력한 시장 기술 분석 도구, 매매 신호(화살표), 알림 기능, 푸시 알림이 통합되어 있습니다. 이 인디케이터를 구매하신 모든 분들께는 다음의 항목이 무료로 제공됩니다: Grabber 유틸리티: 오픈 포지션을 자동으로 관리하는 도구 단계별 영상 매뉴얼: 설치, 설정, 그리고 실제 거래 방법을 안내 맞춤형 세트 파일: 인디케이터를 빠르게 자동 설정하여 최고의 성과를 낼 수 있도록 도와줍니다 다른 전략은 이제 잊어버리세요! Grabber만이 여러분을 새로운 트레이딩의 정점으로 이끌어 줄 수 있습니다. Grabber 전략의 주요 특징: 거래 시간 프레임: M5부터 H4까지 거래 가능한 자산: 어떤 자산이든 사용 가능하지만, 제가 직접 테스트한 종목들을 추천드립니다 (GBPUSD, GBPCAD, GBPCHF, AUDCAD, AU
Atomic Analyst MT5
Issam Kassas
4.1 (29)
우선적으로 언급할 점은이 거래 지표가 다시 그리지 않고 지연되지 않으며 이를 통해 수동 및 로봇 거래 모두에 이상적이라는 점입니다. 사용자 매뉴얼: 설정, 입력 및 전략. Atomic Analyst는 가격의 강도와 모멘텀을 활용하여 시장에서 더 나은 이점을 찾는 PA Price Action Indicator입니다. 고급 필터를 장착하여 잡음과 거짓 신호를 제거하고 거래 잠재력을 높이는 데 도움이 됩니다. 복잡한 지표의 다중 레이어를 사용하여 Atomic Analyst는 차트를 스캔하고 복잡한 수학적 계산을 간단한 신호와 색상으로 변환하여 초보 트레이더가 이해하고 일관된 거래 결정을 내릴 수 있도록합니다. "Atomic Analyst"는 새로운 및 경험이 풍부한 트레이더를위한 종합적인 거래 솔루션입니다. 프리미엄 지표와 최고 수준의 기능을 하나의 거래 전략에 결합하여 모든 종류의 트레이더에 대한 다재다능한 선택지가되었습니다. 인트라데이 거래 및 스캘핑 전략 : 빠르고 정확한 일일
Trend indicator AI mt5
Ramil Minniakhmetov
5 (15)
트렌드 인공 지능 지표는 실행 가능한 진입 점 및 반전 경고와 추세 식별을 결합하여 상인의 시장 분석을 향상시킬 훌륭한 도구입니다. 이 표시기는 사용자가 자신감과 정밀도로 외환 시장의 복잡성을 탐색 할 수 있도록 지원합니다 기본 신호 외에도 트렌드 인공 지능 지표는 풀백 또는 되돌림 중에 발생하는 2 차 진입 점을 식별하여 거래자가 기존 트렌드 내에서 가격 수정을 활용할 수 있도록합니다. 중요한 장점: ·작동 4 및 5 *명확한 구매 또는 판매 신호 *다시 칠하지 않습니다 *모든 자산에서 작동 나는 전보 사기에 개 또는 세트를 판매하지 않도록주의. 모든 설정은 블로그에 여기에 무료.  중요! 지침 및 보너스를 얻기 위해 구입 후 즉시 저에게 연락! 진짜 가동 감시는 뿐 아니라 나의 다른 제품 여기에서 찾아낼 수 있습니다: https://www.mql5.com/en/users/mechanic/seller&nbsp ; 설정 및 입력: 모든 자산에 대해 기본 설정을 권
Quantum TrendPulse
Bogdan Ion Puscasu
5 (21)
SuperTrend   ,   RSI   ,   Stochastic   의 힘을 하나의 포괄적인 지표로 결합하여 트레이딩 잠재력을 극대화하는 궁극의 트레이딩 도구   인 Quantum TrendPulse를   소개합니다. 정밀성과 효율성을 추구하는 트레이더를 위해 설계된 이 지표는 시장 추세, 모멘텀 변화, 최적의 진입 및 종료 지점을 자신 있게 식별하는 데 도움이 됩니다. 주요 특징: SuperTrend 통합:   주요 시장 추세를 쉽게 따라가고 수익성의 물결을 타세요. RSI 정밀도:   매수 과다 및 매도 과다 수준을 감지하여 시장 반전 시점을 파악하는 데 적합하며 SuperTrend 필터로 사용 가능 확률적 정확도:   변동성이 큰 시장에서 숨겨진 기회를 찾기 위해 확률적 진동   을 활용하고 SuperTrend의 필터로 사용 다중 시간대 분석:   M5부터 H1 또는 H4까지 다양한 시간대에 걸쳐 시장을 최신 상태로 유지하세요. 맞춤형 알림:   맞춤형 거래 조건이 충족되면
Trend Lines PRO MT5
Roman Podpora
5 (1)
트렌드 라인즈 프로       이 지표는 시장이 실제로 어떤 방향으로 전환되는지 파악하는 데 도움이 됩니다. 실제 추세 반전 지점과 주요 시장 참여자들이 다시 진입하는 지점을 보여줍니다. 보시다시피       BOS 라인       복잡한 설정이나 불필요한 노이즈 없이 더 높은 시간대의 추세 변화와 주요 레벨을 확인할 수 있습니다. 신호는 차트에 다시 그려지지 않고 캔들이 마감된 후에도 계속 표시됩니다. MT4 버전   -   RFI LEVELS PRO   표시기   와 결합 시 최대 잠재력을 발휘합니다. 지표가 보여주는 내용: 실제 변화       추세(BOS 라인) 한 번 신호가 나타나면 그 신호는 계속 유효합니다! 이는 신호를 발생시킨 후 변경될 수 있는 리페인팅 방식의 지표와 중요한 차이점입니다. 리페인팅 방식의 지표는 잠재적으로 자금 손실로 이어질 수 있습니다. 이제 더욱 높은 확률과 정확도로 시장에 진입할 수 있습니다. 또한 화살표가 나타난 후 목표가(익절)에 도달하거나
RelicusRoad Pro MT5
Relicus LLC
5 (24)
RelicusRoad Pro: 퀀트 시장 운영 체제 70% 할인 평생 이용권 (한정 시간) - 2,000명 이상의 트레이더와 함께하세요 왜 대부분의 트레이더는 "완벽한" 지표를 가지고도 실패할까요? 진공 상태에서 단일 개념 만으로 거래하기 때문입니다. 문맥 없는 신호는 도박입니다. 지속적인 승리를 위해서는 컨플루언스(중첩) 가 필요합니다. RelicusRoad Pro는 단순한 화살표 지표가 아닙니다. 완전한 퀀트 시장 생태계 입니다. 독점적인 변동성 모델링을 사용하여 가격이 이동하는 "공정 가치 로드"를 매핑하고, 단순 노이즈와 실제 구조적 돌파를 구분합니다. 추측은 그만두세요. 기관급 로드 로직으로 거래를 시작하세요. 핵심 엔진: "Road" 알고리즘 시스템의 중심에는 시장 상황에 실시간으로 적응하는 동적 변동성 채널인 Road Algo 가 있습니다. 세이프 라인(평형) 과 가격이 수학적으로 반전될 가능성이 높은 확장 레벨 을 투영합니다. Simple Road: 일반적인 시장을 위
Entry Points Pro for MT5
Yury Orlov
4.48 (138)
다시 색을 칠하지 않고 거래에 진입할 수 있는 정확한 신호를 제공하는 MT5용 지표입니다. 외환, 암호화폐, 금속, 주식, 지수 등 모든 금융 자산에 적용할 수 있습니다. 매우 정확한 추정값을 제공하고 매수와 매도의 가장 좋은 시점을 알려줍니다. 하나의 시그널로 수익을 내는 지표의 예와 함께 비디오 (6:22)시청하십시오! 대부분의 거래자는 Entry Points Pro 지표의 도움으로 첫 거래 주 동안 트레이딩 결과를 개선합니다. 저희의   Telegram Group 을 구독하세요! Entry Points Pro 지표의 좋은점. 재도색이 없는 진입 신호 신호가 나타나고 확인되면(시그널 캔들이 완성된 경우) 신호는 더 이상 사라지지 않습니다. 여타 보조지표의 경우 신호를 표시한 다음 제거되기 때문에 큰 재정적 손실로 이어집니다. 오류 없는 거래 게시 알고리즘을 통해 트레이드(진입 또는 청산)를 할 이상적인 순간을 찾을 수 있으며, 이를 통해 이를 사용하는 모든 거래자의 성공률이
Candle Smart Range
Gianny Alexander Lugo Sanchez
MetaTrader 5용 Candle Smart Range (CSR) Candle Smart Range는 여러 타임프레임에서 가격 범위를 자동으로 식별하도록 설계된 기술 지표입니다. 이 도구는 캔들 형성 및 이전 고점/저점과의 상호작용을 바탕으로 시장 구조를 분석합니다. 주요 기능: 범위 감지: 급격한 변동 전의 횡보 구간을 자동으로 식별합니다. 거짓 돌파 식별: 가격이 이전 수준을 넘어섰으나 캔들 종가 기준으로 범위 내에서 마감된 경우를 표시합니다. 멀티 타임프레임 분석: 사용자 정의 주기를 포함하여 최대 19개의 타임프레임 데이터를 한 차트에 표시합니다. 내부 시각화 (줌): 차트 변경 없이 상위 타임프레임 캔들 내부의 가격 움직임을 확인할 수 있습니다. 시간 필터: 주요 시장 세션 등 특정 시간대에만 작동하도록 설정 가능합니다. 과거 데이터 복기 모드: 과거 데이터를 단계별로 탐색하며 지표의 작동을 분석할 수 있습니다. 알림 시스템: 캔들 마감 및 새로운 범위 감지에 대한 사용
Mirage Trading System — False Breakout (Fakey) Pattern Detector for MetaTrader 5 Overview   Mirage Trading System detects the Fakey pattern (false breakout reversal) on completed bars and draws entry, stop loss, and take profit levels on the chart. Detection is non-repainting: signal values do not change after bar close. The indicator scores each candidate pattern across 17 factors and routes scored signals through a 4-layer Signal Engine before displaying a tier-classified result. How Detectio
ARIPoint
Temirlan Kdyrkhan
ARIPoint is a powerful trading companion designed to generate high-probability entry signals with dynamic TP/SL/DP levels based on volatility. Built-in performance tracking shows win/loss stats, PP1/PP2 hits, and success rates all updated live. Key Features: Buy/Sell signals with adaptive volatility bands Real-time TP/SL/DP levels based on ATR Built-in MA Filter with optional ATR/StdDev volatility Performance stats panel (Success, Profit/Loss, PP1/PP2) Alerts via popup, sound, push, or email Cu
Trend Forecaster
Alexey Minkov
5 (7)
The Trend Forecaster indicator utilizes a unique proprietary algorithm to determine entry points for a breakout trading strategy. The indicator identifies price clusters, analyzes price movement near levels, and provides a signal when the price breaks through a level. The Trend Forecaster indicator is suitable for all financial assets, including currencies (Forex), metals, stocks, indices, and cryptocurrencies. You can also adjust the indicator to work on any time frames, although it is recommen
" Dynamic Scalper System MT5 " 지표는 추세 파동 내에서 스캘핑 방식으로 거래하도록 설계되었습니다. 주요 통화쌍 및 금에서 테스트되었으며, 다른 거래 상품과의 호환성이 가능합니다. 추가적인 가격 변동 지원을 통해 추세에 따라 단기 포지션 진입 신호를 제공합니다. 지표의 원리 큰 화살표는 추세 방향을 결정합니다. 작은 화살표 형태의 스캘핑 신호를 생성하는 알고리즘은 추세 파동 내에서 작동합니다. 빨간색 화살표는 상승 방향을, 파란색 화살표는 하락 방향을 나타냅니다. 민감한 가격 변동선은 추세 방향으로 그려지며, 작은 화살표의 신호와 함께 작용합니다. 신호는 다음과 같이 작동합니다. 적절한 시점에 선이 나타나면 진입 신호가 형성되고, 선이 있는 동안 미결제 포지션을 유지하며, 완료되면 거래를 종료합니다. 권장되는 작업 시간대는 M1~H4입니다. 화살표는 현재 캔들에 형성되며, 다음 캔들이 이미 시작되었더라도 이전 캔들의 화살표는 다시 그려지지 않습니다. 입
소개       Quantum Breakout PRO   , 브레이크아웃 존 거래 방식을 변화시키는 획기적인 MQL5 지표! 13년 이상의 거래 경험을 가진 숙련된 트레이더 팀이 개발한       퀀텀 브레이크아웃 PRO       혁신적이고 역동적인 브레이크아웃 존 전략으로 거래 여정을 새로운 차원으로 끌어올리도록 설계되었습니다. Quantum Breakout Indicator는 5개의 이익 목표 영역이 있는 브레이크아웃 영역의 신호 화살표와 브레이크아웃 상자를 기반으로 한 손절 제안을 제공합니다. 초보자 거래자와 전문 거래자 모두에게 적합합니다. Quantum EA 채널:       여기를 클릭하세요 중요한! 구매 후 설치 매뉴얼을 받으려면 개인 메시지를 보내주십시오. 추천: 기간: M15 통화쌍: GBPJPY, EURJPY, USDJPY,NZDUSD, XAUUSD 계정 유형: 스프레드가 매우 낮은 ECN, Raw 또는 Razor 브로커 시간: GMT +3 중개인 :
TPSproTREND PrO MT5
Roman Podpora
4.74 (19)
TPSproTrend PRO는 시장이 실제로 방향을 바꾸는 순간을 포착하여 움직임의 시작점에서 진입점을 형성합니다. 가격이 움직이기 시작할 때 시장에 진입해야 하며, 이미 가격 변동이 일어난 후에 진입해서는 안 됩니다.   (지표)       신호를 다시 그리지 않고 진입점, 손절매, 이익실현을 자동으로 표시하여 거래를 명확하고 시각적이며 체계적으로 만들어줍니다. 설명서 (러시아어)   -   MT4 버전 주요 장점 신호 재표시 없이 신호가 표시됩니다.   모든 신호는 고정되어 있습니다. 화살표가 나타나면 -       그것은 더 이상 변하거나 사라지지 않을 것입니다. 잘못된 신호의 위험 없이 안정적인 데이터를 기반으로 거래 결정을 내릴 수 있습니다. 바로 사용 가능한 매수/매도 진입점 이 지표는 거래 진입에 가장 적합한 시점을 자동으로 판단하여 차트에 화살표로 표시합니다. 추측이나 주관적인 분석이 아닌, 명확한 신호만 있습니다. 자동 손절매 및 이익실현 영역 신호 직후에 다음
Crystal Heikin Ashi Signals
Muhammad Jawad Shabir
5 (1)
Crystal Heikin Ashi Signals - Professional Trend & Signal Detection Indicator Advanced Heikin Ashi Visualization with Intelligent Signal System for Manual & Automated Trading Final Price: $149 ---------> Price goes up $10 after every 10 sales . Limited slots available — act fast . Overview Crystal Heikin Ashi Signals is a professional-grade MetaTrader 5 indicator that combines pure Heikin Ashi candle visualization with an advanced momentum-shift detection system. Designed for both manual traders
TrendMaestro5
Stefano Frisetti
note: this indicator is for METATRADER4, if you want the version for METATRADER5 this is the link:  https://www.mql5.com/it/market/product/108106 TRENDMAESTRO ver 2.5 TRENDMAESTRO recognizes a new TREND from the start, he never makes mistakes. The certainty of identifying a new TREND is priceless. DESCRIPTION TRENDMAESTRO identifies a new TREND in the bud, this indicator examines the volatility, volumes and momentum to identify the moment in which there is an explosion of one or more of these da
Trend Hunter MT5
Andrey Tatarinov
5 (3)
Trend Hunter 는 Forex, 암호화폐 및 CFD 시장에서 작업하기 위한 추세 지표입니다. 이 지표의 특별한 특징은 가격이 추세선을 약간 돌파할 때 신호를 변경하지 않고 자신있게 추세를 따른다는 것입니다. 표시기는 다시 그려지지 않으며 막대가 닫힌 후에 시장 진입 신호가 나타납니다. 추세를 따라 이동할 때 표시기는 추세 방향에 대한 추가 진입점을 표시합니다. 이러한 신호를 바탕으로 작은 StopLoss로 거래할 수 있습니다. Trend Hunter 는 정직한 지표입니다. 표시 신호 위로 마우스를 가져가면 신호의 잠재적 이익과 가능한 중지가 표시됩니다. 새로운 신호가 나타나면 다음 알림을 받을 수 있습니다. 알리다 푸시 알림 이메일로 알림 텔레그램 알림 차트 스크린샷도 텔레그램으로 전송되므로 거래 결정을 내리기 위해 단말기를 열 필요가 없습니다. 표시 신호는 텔레그램 채널 https://www.mql5.com/ko/market/product/11085#!tab=com
Gold Sniper Scalper Pro
Ich Khiem Nguyen
3.63 (8)
Gold Sniper Scalper Pro — False Breakout Detector with Gold-Specific Filters for MetaTrader 5 Overview   Gold Sniper Scalper Pro detects the Fakey pattern (false breakout reversal) on completed bars and applies three additional validation layers designed for XAUUSD characteristics: a 7-timeframe trend consensus gate, a 4-regime volatility classifier, and gold-specific detection presets. All signals are non-repainting; values do not change after bar close. The indicator draws entry, stop loss, an
Advanced Supply Demand MT5
Bernhard Schweigert
4.53 (15)
현재 33% 할인! 초보자나 전문 트레이더를 위한 최고의 솔루션! 이 보조지표는 우리가 다수의 독창적 기능과 새로운 공식을 통합한 독특하고 고품질이며 저렴한 거래 도구입니다. 이 업데이트를 통해 이중 시간대를 표시할 수 있습니다. 더 높은 TF를 표시할 수 있을 뿐만 아니라 차트 TF와 더 높은 TF 모두를 표시할 수 있습니다: 중첩 영역 표시. 모든 Supply Demand 트레이더들이 좋아할 것입니다. :) 중요한 정보 공개 Advanced Supply Demand의 잠재력을 극대화하려면 다음을 방문하십시오. https://www.mql5.com/ko/blogs/post/720245   진입 또는 목표의 명확한 트리거 포인트를 정확히 찾아냄으로 해서 거래가 어떻게 개선될지 상상해 보십시오. 새로운 알고리즘을 기반으로 매수자와 매도자 간의 잠재적인 불균형을 훨씬 더 쉽게 분간할 수 있습니다. 왜냐하면 가장 강한 공급영역과 가장 강한 수요 영역과 과거에 어떻게 진행 되었는지를(이전
MetaBands M5
Vahidreza Heidar Gholami
4.5 (2)
MetaBands uses powerful and unique algorithms to draw channels and detect trends so that it can provide traders with potential points for entering and exiting trades. It’s a channel indicator plus a powerful trend indicator. It includes different types of channels which can be merged to create new channels simply by using the input parameters. MetaBands uses all types of alerts to notify users about market events. Features Supports most of the channel algorithms Powerful trend detection algorith
제작자의 제품 더 보기
AutoFib: Advanced Fibonacci Retracement for MetaTrader 5 Automate Fibonacci Analysis for Smarter Trading Decisions AutoFib simplifies Fibonacci retracement analysis by automatically identifying key levels of support and resistance directly on your MT5 charts. Whether you're new to Fibonacci analysis or an advanced trader, AutoFib enhances your ability to identify potential reversals, continuations, and critical price levels. Key Features: Automatic Fibonacci Levels – Identify retracement and ext
Japanese Candle Patterns (JCP) User Guide Overview and Features Japanese candlestick patterns, a foundational element of technical analysis, provide traders with visual insights into market psychology. Each pattern represents the battle between bulls and bears, encapsulating critical information about market sentiment, potential reversals, and continuation signals. Developed centuries ago and later popularized by Steve Nison in Japanese Candlestick Charting Techniques , these patterns are now wi
EAsiTrader: Advanced Strategy Creation & Automation for MetaTrader 5 EAsiTrader is designed for those who want to eliminate the hassle of programming and drastically accelerate the process of creating Expert Advisors, making strategy development faster and more efficient. EAsiTrader is a versatile trading tool designed specifically for MetaTrader 5, providing automation features and a comprehensive set of tools to help users build, test, and refine and run trading strategies. EAsiTrader adapts
ABH - Candle Component Analysis - User Guide Overview and Features The   ABH - Average Bar Height   indicator is designed to help traders analyze market volatility and identify potential buy and sell signals by measuring the average size of each candlestick component over a specific period. The indicator calculates and displays four lines representing different candlestick metrics. By analyzing these values, traders can interpret market strength, volatility, and potential trend changes. Beyond
NTL Market Times
Northen Trading Labs
NTL Market Times Indicator The NTL Market Times Indicator for MT5 provides a clear unobtrusive display of the opening and closing times of the world’s major Forex trading centers. It automatically adjusts for UK daylight saving time, ensuring reliable market session information all year round. Main Features Major Markets: Displays New York, London, Frankfurt, Sydney, and Tokyo trading hours. Color-Coded Sessions: Each market session is uniquely color-coded for quick identification on the chart.
NTL HLines
Northen Trading Labs
HLines User Guide Overview and Features The NTL HLines Indicator is designed to elevate your trading with precise support and resistance analysis. Utilizing a sophisticated algorithm, this MQL5 indicator scans for high-probability price levels across multiple timeframes, helping traders pinpoint strategic entry and exit zones. With fully customizable pivot scanning and multi-timeframe support, HLines provides a powerful, adaptable toolset for traders of all experience levels. Key features includ
필터:
리뷰 없음
리뷰 답변