NTL HLines
- 지표
- 버전: 1.0
- 활성화: 5

HLines User Guide
Overview and Features
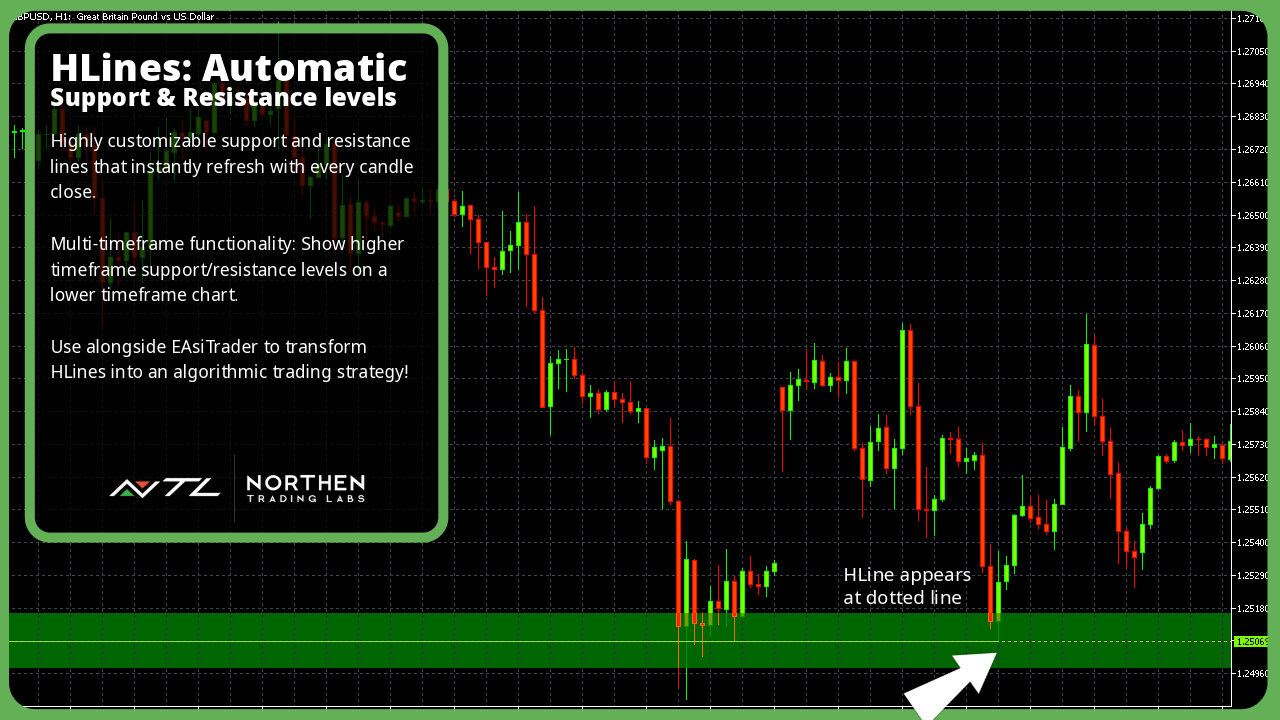
The NTL HLines Indicator is designed to elevate your trading with precise support and resistance analysis. Utilizing a sophisticated algorithm, this MQL5 indicator scans for high-probability price levels across multiple timeframes, helping traders pinpoint strategic entry and exit zones. With fully customizable pivot scanning and multi-timeframe support, HLines provides a powerful, adaptable toolset for traders of all experience levels.
Key features include customizable Pivot String and Pivot Order settings, allowing traders to define unique patterns of support and resistance pivots. HLines automatically adjusts these levels in real time, reducing subjectivity and maintaining clarity in fast-moving markets. This indicator is compatible with the EAsiTrader EA, offering seamless integration for automated trading strategies. Whether you’re focused on short-term trading or longer-term trend analysis, HLines helps you make data-driven decisions with greater confidence.
Key Features
-
Custom Pivot Scanning
This feature allows traders to search key pivot points within price action for specific sequences of support and resistance pivots, such as a strong support level followed by a key resistance level, or any custom-defined combination that aligns with their strategy enabling traders to spot optimal entry and exit points with greater confidence. -
Automatic Line Adjustments
Continuously updates support and resistance lines to reflect the latest market data, allowing traders to maintain a clear view of critical price zones in real time and stay focused on strategic decision-making. -
Customizable Settings for Line Sensitivity
Allows traders to adjust the sensitivity of line generation to suit their unique trading strategy, from short-term scalping to long-term positioning. -
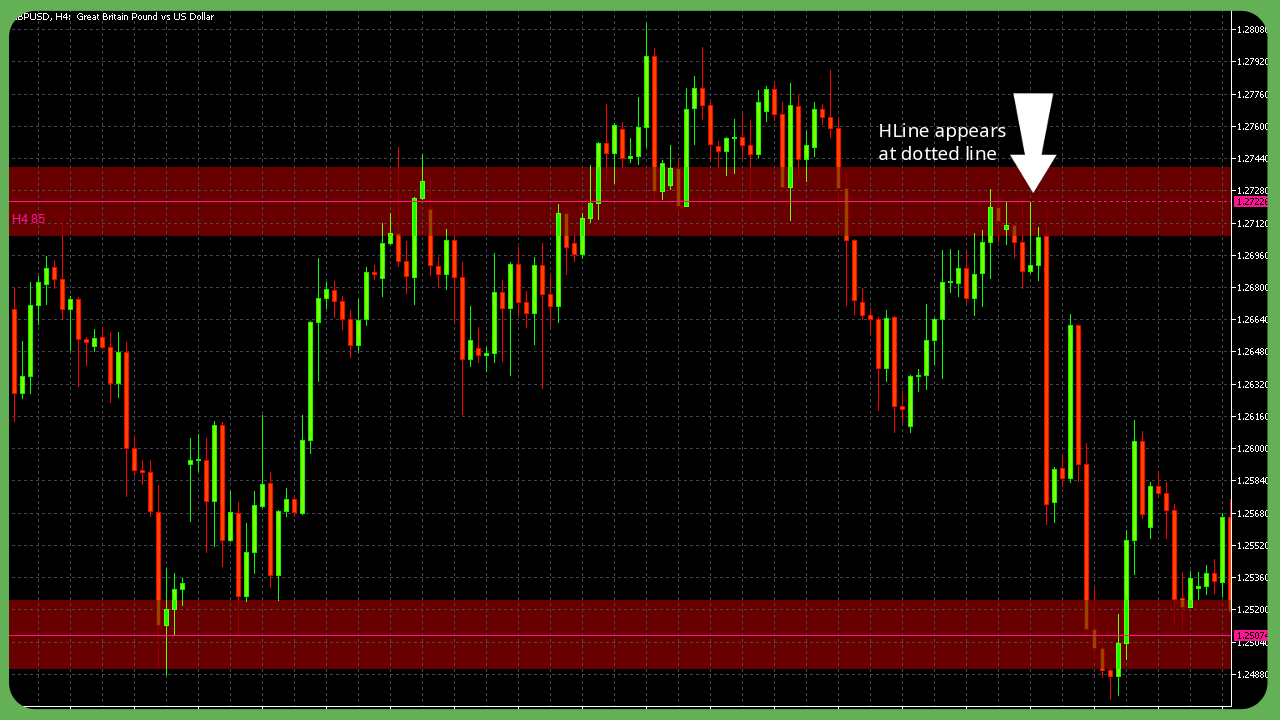
Multi-Timeframe Scanning: Whether trading on the 1-minute chart or the monthly chart, HLines adapts seamlessly, allowing users to examine support and resistance lines across multiple timeframes, from intra-day to long-term perspectives. Note: To use this feature effectively, fully load tick data for your desired timeframe.
-
Reduces Subjectivity: Manual identification of patterns can be subjective, while HLines applies consistent criteria.
-
Compatible with EAsiTrader EA: Provides signals to NTL EAsiTrader EA for automated trading.
Installation and Settings
This section provides the installation steps for setting up the HLines indicator on the MQL5 platform, as well as detailed explanations of customizable settings to configure it for optimal performance.
Installation
-
Install the Indicator:
- Download the HLines indicator file (HLines.ex5) and place it in the Indicators\NTL folder in your MQL5 platform directory. If this folder does not exist, create it manually.
- Typical path: Terminal -> MQL5 -> Indicators -> NTL . Restart the platform to make the indicator appear in the Navigator panel.
-
Apply to a Chart:
- Open your desired chart, select the symbol and timeframe.
- Drag the HLines indicator from the Navigator panel onto your chart.
- Configure the Input settings to customize HLines, display options, and other parameters.
-
Customize Settings:
- Access the Input settings by double-clicking the indicator on the chart or through the Navigator panel.
-
Save as Template:
- Save your preferred settings as a template by right-clicking on the chart and selecting Template -> Save Template . Give it a descriptive name like HLines_Custom for easy access.
Settings
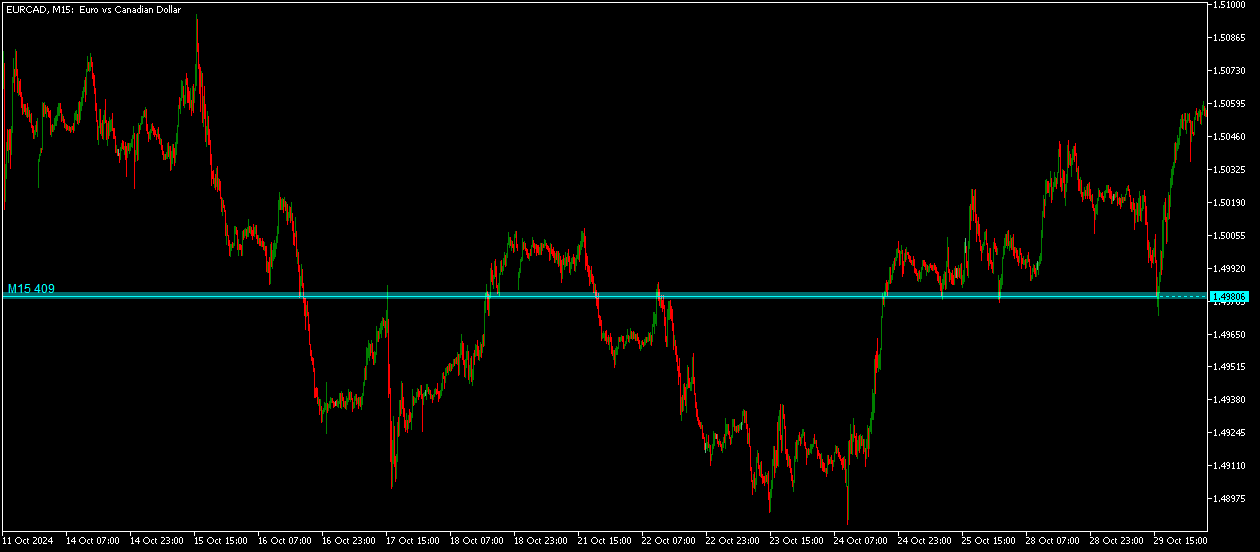
Timeframe
This setting allows you to select the specific timeframe from which HLines will analyze price data, regardless of the chart’s current timeframe. This feature is helpful if you want to analyze support and resistance lines on a higher or lower timeframe than the one currently displayed, giving you a multi-timeframe perspective.
Min Line Strength
Line strength is a measure of the support or resistance line’s importance relative to other lines. Use this setting to specify the minimum strength value of a line that can be shown on the chart. Use values between 20 and 1000.
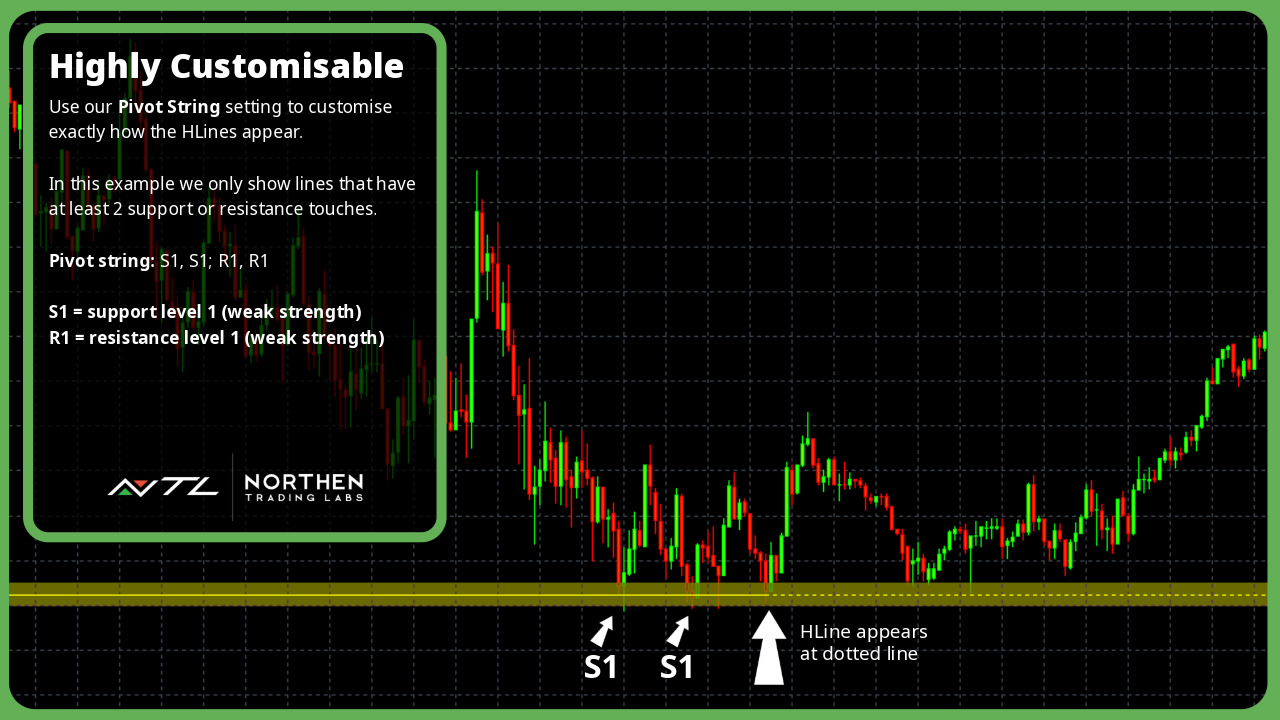
Pivot String
Use this setting to filter line patterns according to their pivot order values. The default value is “S2;R2” meaning HLines will find all support lines with a pivot order value of 2 or more and resistance lines with a pivot order value of 2 or more. Here are more examples:
"S3": matches support lines that have a 3 or greater pivot order value.
"R3": matches resistance lines that have a 3 or greater pivot order value.
"S2;S3": matches support lines that have a 2 or greater pivot order value, or resistance lines that have a 3 or greater pivot order value.
"S3,R3": matches support lines that have a 3 or greater pivot order value followed by a resistance line that has a 3 or greater pivot order. For example, a down trend that finds support, breaks and then find resistance.
"R3,S3": matches resistance lines that have a 3 or greater pivot order value followed by a support line that has a 3 or greater pivot order. For example, an up trend that finds resistance, breaks and then find support.
"S3,R3;R3,S3": matches support lines that have a 3 or greater pivot order value followed by a resistance line that has a 3 or greater pivot order. Or, matches resistance lines that have a 3 or greater pivot order value followed by a support line that has a 3 or greater pivot order.
Max Body Crosses
Defines the maximum number of candle bodies that the support or resistance line can cross before being excluded as a support or resistance line.
Pivot Weight
Defines the tolerance around a candle’s high and low and candle’s body high and body low when calculating line strength and body cross. The smaller this value the less tolerance, meaning support and resistance lines are more precise. More precision usually results in fewer lines.
Overlap Tolerance
Defines the tolerance, in average body height, between adjacent lines of support or resistance. It is used to decide if two adjacent lines should be considered the same line or separate lines. A smaller tolerance will produce more lines whilst a larger tolerance will produce less lines.
ABH Period
Defines the period for the ABH (Average Bar Height) Indicator. HLines uses the ABH Indicator in its calculations to set the value of an average bar height and average body height.
ABH Zone Multiplier
Defines the size of an HLine draw zone above and below the support or resistance lines as a ratio of the average bar height at the time the line is created. A multiplier value of 1.0 draws a zone of half ABH ** 1.0 above and below the line. A multiplier value of 1.5 draws a zone of half ABH * 1.5 above and below the line.
ABH Show Zones
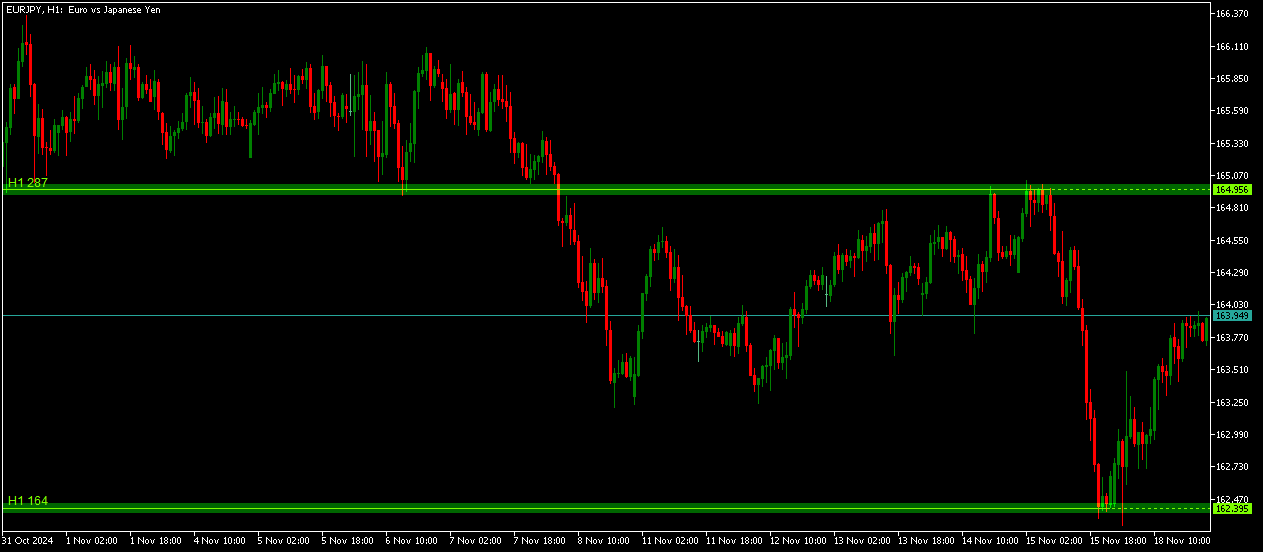
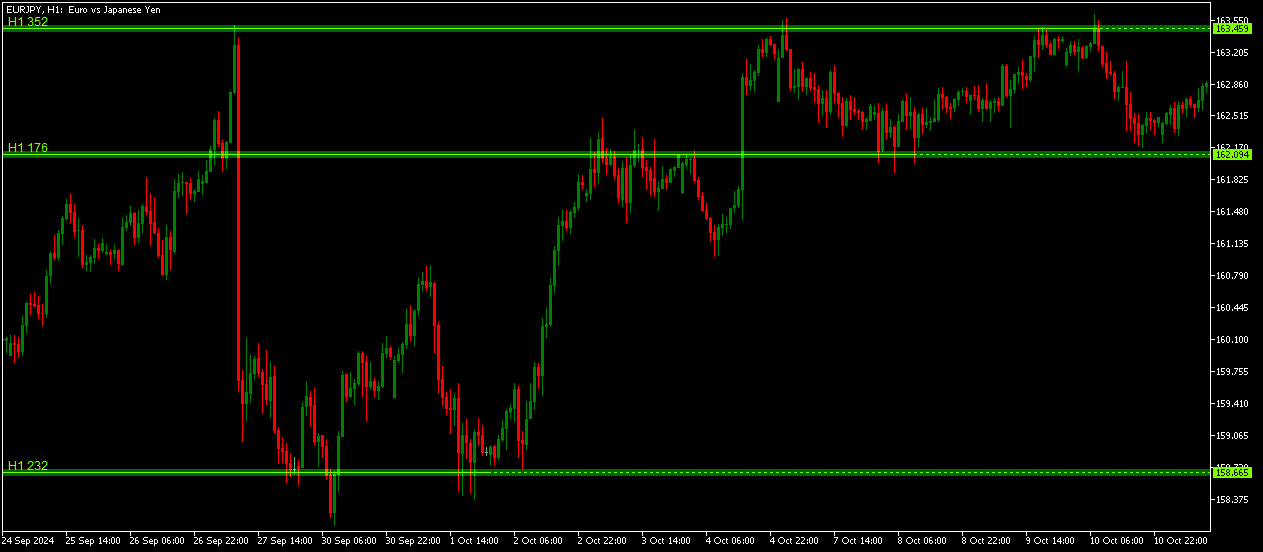
If true, the indicator will draw the zone above and below the lines. If false, no zones are drawn. The zone is an area drawn on the chart above and below each line, whose size is a ratio of the average bar height at the time the line is created. These edges of the zones can be used by traders to set entry, stop loss or take profit prices.
New HLine Alerts
If true, the trader will be alerted with a message in a separate window whenever a new support or resistance line is created. The message includes the symbol, timeframe, local time of the alert and the symbol’s price the line was created. Optionally, a push notification can also be sent to a mobile device. Tools -> Options -> Notifications
Font Size
Defines the size of font to be used to display the timeframe and strength values on the HLine.
Chart Label Style
Determines the style used to display the timeframe and strength values on the HLine. Use Label to show this information as a simple label, or use Boxed to show the information inside a rectangle box.
Chart Edge Alignment
Allows the trader to align the HLine text content to the left or right edge of the chart.
Advanced Usage and Strategy Integration
Static HLines
To fix an HLine so that it doesn’t get removed when new candles are added, simply click on the HLine - the word Static will appear above the line. Click again to return the HLine to normal.
Leverage HLines to refine complex trading strategies by integrating advanced pivot and support/resistance analysis:
-
Custom Pivot Sequence for Targeted Signal Generation
With the Pivot String and Pivot Order settings, traders can construct personalized sequences of support and resistance pivots, enabling focused searches for specific patterns that align with their strategy. For example, combining a high-order support pivot (e.g. S3) followed by a resistance pivot (e.g. R3) can highlight zones of strong trend reversals, providing actionable signals that fit into trend-based or mean-reversion strategies. -
Multi-Timeframe Analysis for Strategic Depth
By configuring HLines to scan higher timeframes, traders can identify significant support and resistance levels from daily or weekly charts while trading on shorter timeframes. This setup allows for more comprehensive analysis, helping to validate signals against broader market trends or longer-term levels. -
Dynamic Zone Creation for Entry and Exit Management
The ABH Zone Multiplier helps define adaptive zones around each line, offering flexible areas where traders can place entry, stop loss, or take profit levels. These zones, based on average bar height, provide a buffer that accommodates minor fluctuations, especially useful in volatile markets. -
Automated Alerts for Real-Time Strategy Execution
HLines can be configured to alert traders when new support or resistance levels are detected. This feature is especially beneficial for strategies that require quick reactions to emerging levels, enabling prompt entries or exits based on the latest market data. -
Seamless Integration with EAsiTrader for Automated Trading
Compatible with NTL’s EAsiTrader EA, the indicator provides automated trading capabilities by sending signals directly to the EA. This feature allows traders to combine manual analysis with automated trade execution, aligning with sophisticated strategies that depend on precision timing.
Insights
Gain deeper insights into market structure and dynamics with HLines’ analytical features:
-
Pivot Order Depth and Market Significance
High-order pivots reflect more stable, recurring price levels, suggesting strong support or resistance zones. By focusing on high-order pivots, traders can identify areas with increased probability of price reversal, helping them anticipate potential breakout or reversal points with greater accuracy. -
The Role of Sequence in Support and Resistance Strength
The customizable Pivot String enables traders to spot pivotal sequences, such as a resistance pivot followed by a support pivot, which may indicate a potential shift in market direction. Recognizing these sequences enhances a trader’s ability to interpret market sentiment, allowing for strategic alignment with prevailing trends. -
Min Line Strength and Volatility Sensitivity
The Min Line Strength setting aids in filtering noise by ensuring only significant lines appear on the chart, reducing clutter and focusing attention on levels that are more likely to hold. This sensitivity adjustment is particularly useful in high-volatility periods, where less reliable levels are automatically excluded. -
Adaptive Tolerance for Precision Analysis
The Overlap Tolerance and Pivot Weight settings allow traders to fine-tune the precision of the support and resistance lines, accommodating their specific needs for broader or narrower levels. This flexibility provides an edge in adapting the indicator’s analysis to both trending and ranging market conditions.
Terms
Pivot Order
Ordering pivots ranks price highs and lows based on their significance. The higher the order, the more significant the price compared to lower-ordered pivots.
- a 0 order high pivot is a bar without a lower high bar on its immediate left (older) and right (newer).
- a 0 order low pivot is a bar without a higher low bar on its immediate left (older) and right (newer).
- a 1 order high pivot is a bar with a lower high bar on its immediate left and right.
- a 1 order low pivot is a bar with a higher low bar on its immediate left and right.
- a 2 order high pivot is a bar with a 1 order high pivot on its left and right.
- a 2 order low pivot is a bar with a 1 order low pivot on its left and right.
- a 3 order pivot has a 2 order pivot on its left and right.
- a 4 order pivot has a 3 order pivot on its left and right, and so on.
Rev:10.11.2024