Trend Streaks MT5
- 지표
- 버전: 1.0

Description (English)
TrendStreaks Indicator — Analyze Consecutive Bullish and Bearish Runs
The TrendStreaks indicator provides a clear statistical overview of bullish and bearish streaks in market trends.
It automatically analyzes daily and weekly price data to identify how long uptrends or downtrends typically last, how strong they are, and what their average and maximum moves are (in pips and percent).
Detects and counts all bullish and bearish streaks (series of consecutive up or down candles).
-
Calculates average, maximum, and longest streak lengths.
-
Displays average move in pips and percentage for both bullish and bearish streaks.
-
Shows recent daily changes (Open–Close difference and % change) for better short-term insight.
-
Works on any symbol or instrument (Forex, indices, metals, crypto, etc.).
-
Includes both daily and weekly trend streak reports.
How to Use
-
Attach the indicator to any chart and timeframe.
-
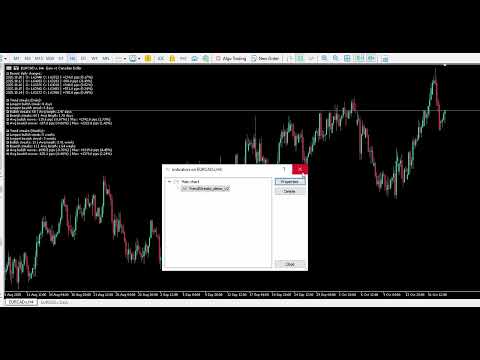
In the chart comment area, you’ll see a detailed trend summary:
-
Recent daily changes
-
Daily trend streaks
-
Weekly trend streaks
-
-
Use this information to identify trend persistence and trend exhaustion points — e.g., if the market usually turns after 5 bearish candles in a row, this can be used as a reversal signal.
Inputs
| Input | Description |
|---|---|
| DaysBack | Number of past days to analyze (e.g. 250 = ~1 year of data). |
| DaysToShow | Number of recent days to display individual daily changes. |
Example Usage
-
Spot if a symbol tends to move in short bullish bursts or long bearish runs.
-
Combine with other indicators (e.g., RSI, MA) to confirm trend continuation or reversal zones.
-
Use historical streak behavior to improve timing and confidence in trade entries.
Notes
-
Works best on daily and weekly data.
-
Does not repaint, calculations are fully based on historical candle data.
-
Lightweight and fast, optimized for performance even on long data series.