M W Scanner
- 지표
-
Reza Aghajanpour
 =============================================================================================
<<<<<< Our team after 19 years of experience in the markets and programming would like to share winner solutions with you. >>>>>> - 버전: 1.10
- 업데이트됨: 24 1월 2026
- 활성화: 20
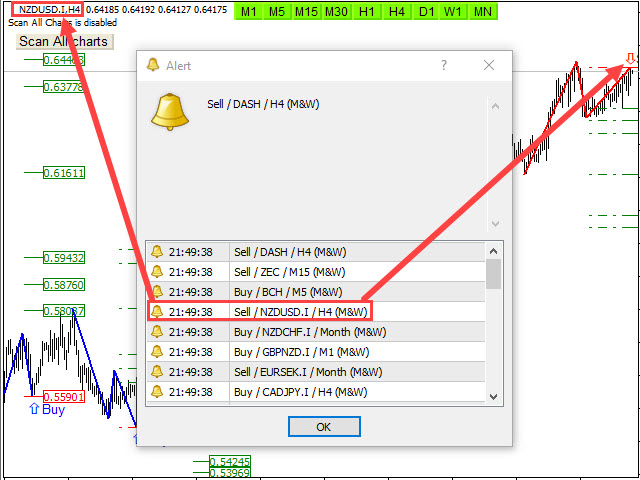
** All Symbols x All Timeframes scan just by pressing scanner button **
*** Contact me to send you instruction and add you in "M W Scanner group" for sharing or seeing experiences with other users.
Introduction:
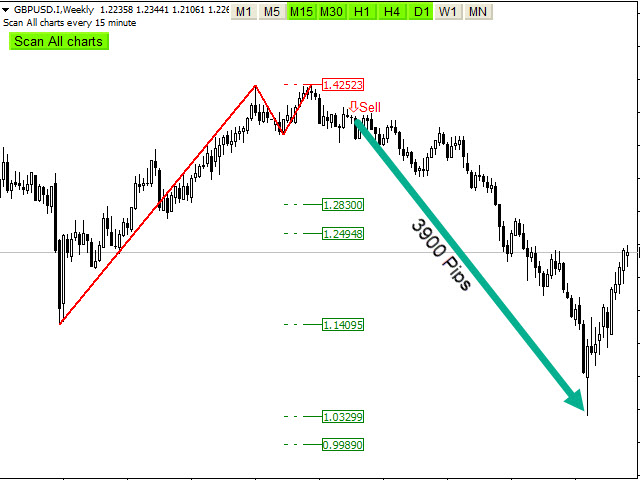
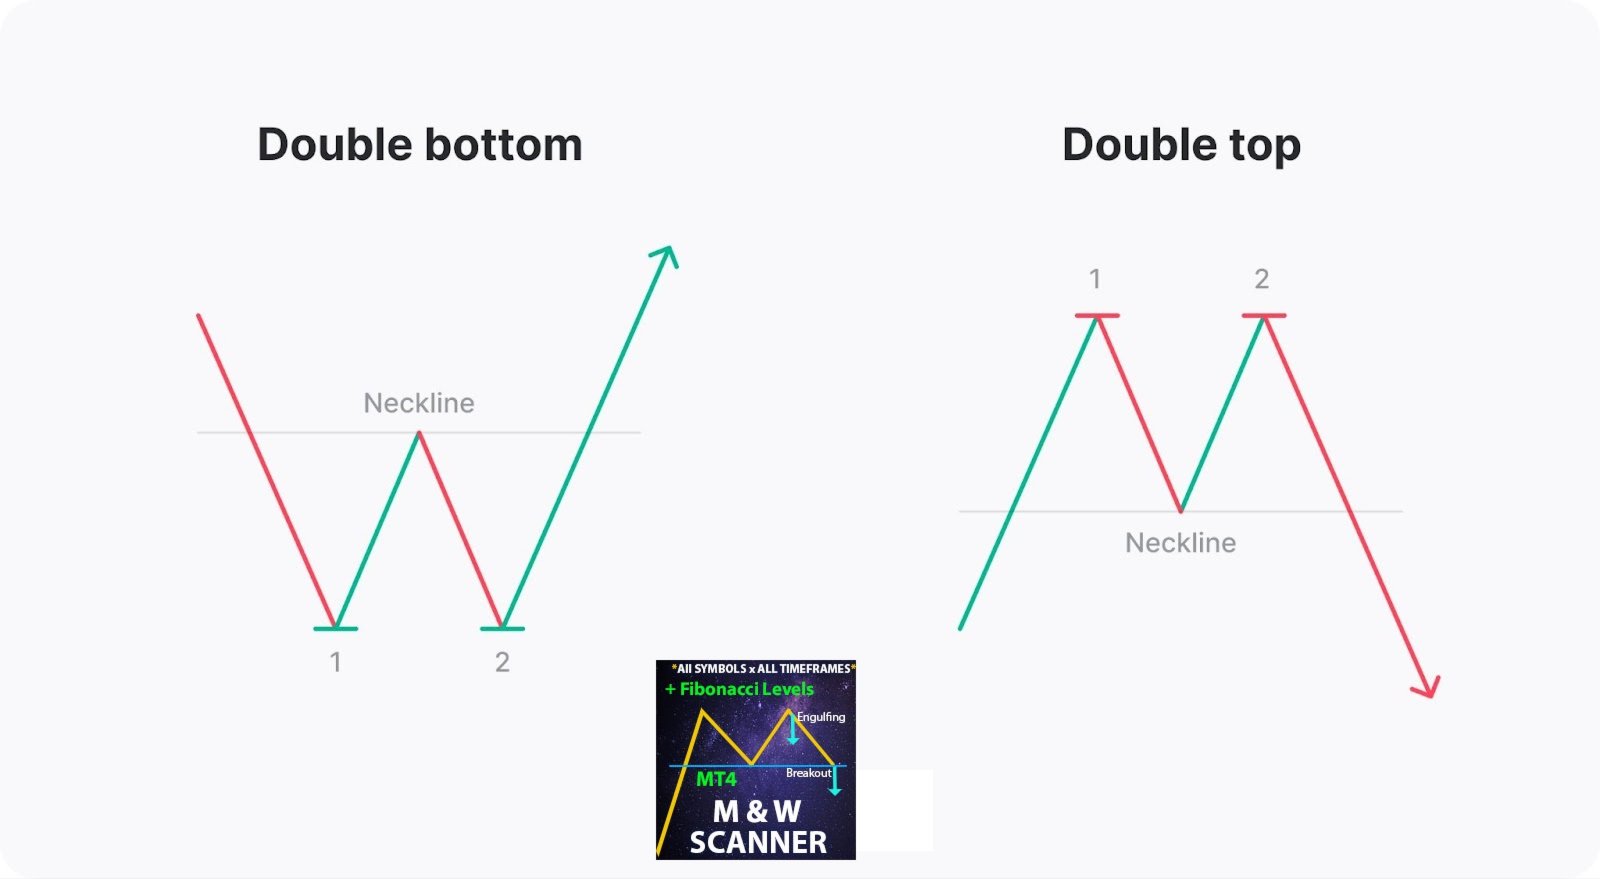
Double Top(M) and Double Bottom(W) is a very repetitive common type of price reversal patterns. Double Top resembles M pattern and indicates bearish reversal whereas Double Bottom resembles W pattern and indicates a bullish reversal that they have high win rate.
The M W Scanner indicator Scans All charts just by pressing one click. It has stop loss, Take profits and entry point levels with using Fibonacci levels and candlestick checking to find the best entry point and exit of trading. It finds signals immediately with alarm and notification for easy trading.
Main Features:
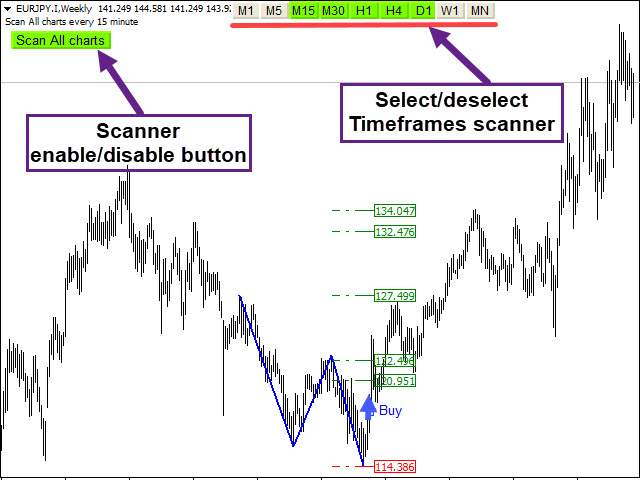
- Detect the best and most common successful reversal trend : Double Top(M) Pattern, Double Bottom(W) Pattern, Double top bottom
- Easy-to-use and user-friendly indicator
- NO repaint
- Scan All charts button ( Forex, Crypto, Indices and commodities )
- Select and deselect time frames button for scan (M1,M5,M15,M30,H1,H4,D1,W1,MN)
- It displays and pushes notification stop-loss, take profits and entry-point levels
- Candlestick check for the best entry point
- Use Fibonacci levels
- Sending the alert and push notification
- method Engulfing/breakout - Engulfing on the edge of pattern / Breakout neck of pattern
- Alert enable/disable base on your setting time
- Adjust the pattern setting
Input Parameters :
=========Scanner============
- Scan All Charts – Enable
- Scan the number of candles – Amount of history bars to evaluate
- Re-scan Timer – Re-scan all charts in all time frames after passing time
- mode = Engulfing/breakout - Engulfing on the edge of pattern / Breakout neck of pattern
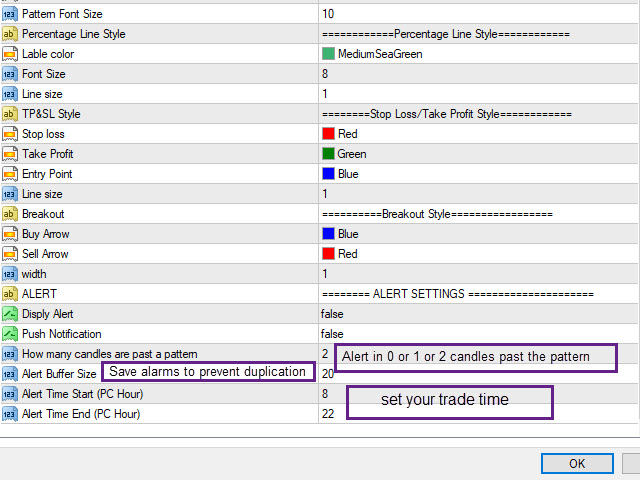
=======Display/style Options============
- Display Options – Display or do not SL & TP & Entry levels
- Stop Loss levels and Breakout Style - Set the Fonts and colors of patterns
========ALERT SETTINGS ==========
- Display Alert or Push Notification – Enable or disable Alert or Push Notification
- How many candles are past a pattern – Maximum Number of candles Passed from a pattern to allow alert
- Alert Buffer Size – Maximum save alert to prevent duplicate alerts
- Alert start/end time – Determine trading hours based on the computer clock to activate and deactivate the alarm


Been testing this indicator for a few days now. I'm liking what I see. The engulfing option seems to repaint, the breakout option is non repaint. However I like the engulfing option as it gives me the heads up that a breakout pattern might be coming. Nice indicator.