당사 팬 페이지에 가입하십시오

Choppiness_IndexH - MetaTrader 5용 지표
- 조회수:
- 7165
- 평가:
- 게시됨:
- 업데이트됨:
-
 이 코드를 기반으로 한 로봇이나 지표가 필요하신가요? 프리랜스로 주문하세요
프리랜스로 이동
이 코드를 기반으로 한 로봇이나 지표가 필요하신가요? 프리랜스로 주문하세요
프리랜스로 이동
Oscillator Choppiness Index is intended for assessing the market situation. It identifies three states:
- Trend
- Flat
- Instable consolidation
This indicator is made as an oscillating histogram with the zero central point.
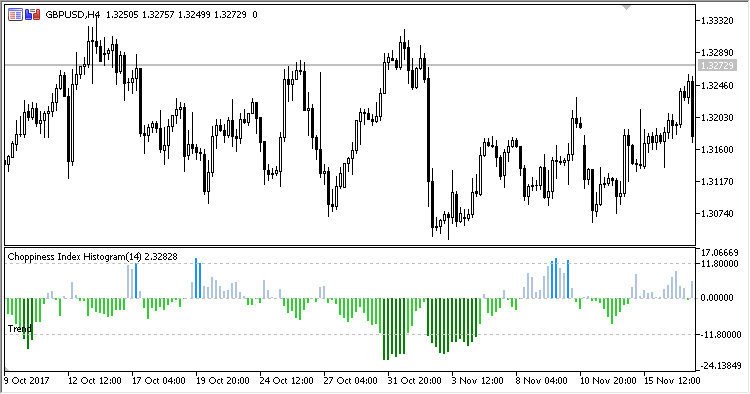
The indicator informs on the market state with the different colors of the histogram bars:
- Trend is displayed in green
- Starting/ending trend is displayed in pale green
- Transition from trend to flat or from flat to trend is displayed in pale blue
- Flat is displayed in blue
- Instable consolidation is displayed in red
Values below -11.8 indicates a trend in the market, while values above 11.8 indicate a flat. Values close to 50 indicate an instable consolidation.
The lower the oscillator value is within the negative area, the more expressed the trend component is on the market.
The indicator has four configured parameters:
- Period - calculation period
- Trend level - trend boundary level
- Choppiness level - flat boundary level
- Consolidation level - consolidation boundary level
Calculations:
CI = 100.0 * log10( SumATR / ( MaxHigh - MinLow)) / log10X - 50.0
where:
log10X = log10(Period)
ATR = ATR(1)
SumATR - sum of ATR over the Period
MaxHigh - maximum High value within the Period
MinLow- minimum Low value within the Period
MetaQuotes Ltd에서 러시아어로 번역함.
원본 코드: https://www.mql5.com/ru/code/21340
 Exp_GStopLoss_Tm
An Expert Advisor for closing all positions, in case of the total losses on those positions exceeded the Stop Loss level fixed in inputs, or where it is necessary to close all positions beyond the time interval fixed in the settings.
Exp_GTakeProfit_Tm
An Expert Advisor for closing all positions, in case of the total profits on those positions exceeded the Take Profit level fixed in inputs, or where it is necessary to close all positions beyond the time interval fixed in the settings.