당사 팬 페이지에 가입하십시오

Cumulative_Volume - MetaTrader 5용 지표
- 조회수:
- 7589
- 평가:
- 게시됨:
-
 이 코드를 기반으로 한 로봇이나 지표가 필요하신가요? 프리랜스로 주문하세요
프리랜스로 이동
이 코드를 기반으로 한 로봇이나 지표가 필요하신가요? 프리랜스로 주문하세요
프리랜스로 이동
This oscillator indicator provides an interesting method for presenting volume data. It displays the total volume over the selected period.
Volume data can be represented in several ways:
- Combined
- Absolute
- Relative
- Separated
- Absolute
- Relative
Volumes can be displayed in relative or absolute values, as well as in a combined or a separated way.
The indicator has three input parameters:
- Period - calculation period;
- Combined - show data either in a combined or in a separated way (Yes/No);
- Relative - choose between relative/absolute values (Yes/No).
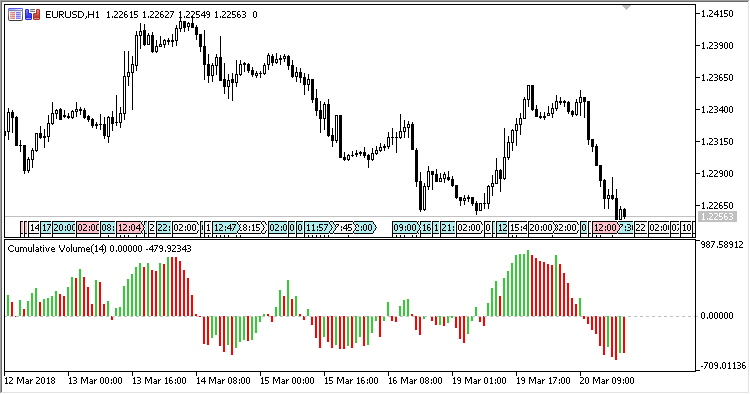
Fig.1. Combined, relative representation
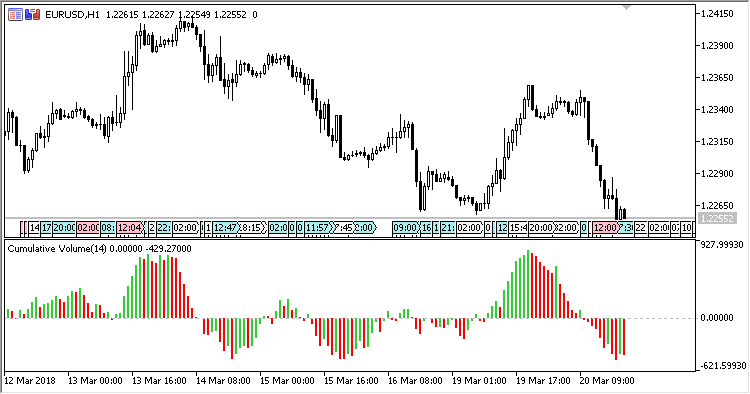
Fig.2. Combined, non-relative representation
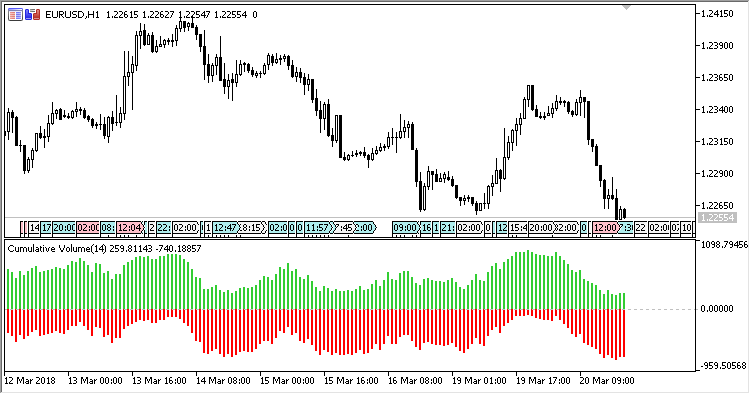
Fig.3. Non-combined, relative representation
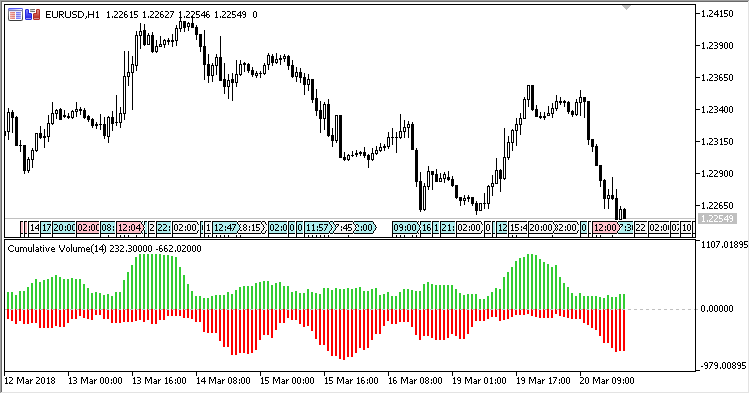
Fig.4. Non-combined, non-relative representation
MetaQuotes Ltd에서 러시아어로 번역함.
원본 코드: https://www.mql5.com/ru/code/20267
SHL_MA_Band
A trend indicator: Smoothed High/Low Linear regression band.
HL_MA_Band
A trend indicator: High/Low Linear regression band.
MA_Difference
An oscillator indicator showing a difference between MA and the price.
Period_Open_Line
The indicator shows the open price of a period.