당사 팬 페이지에 가입하십시오

Rj_HSlice 1.1 - MetaTrader 4용 지표
- 조회수:
- 18847
- 평가:
- 게시됨:
- 업데이트됨:
-
 이 코드를 기반으로 한 로봇이나 지표가 필요하신가요? 프리랜스로 주문하세요
프리랜스로 이동
이 코드를 기반으로 한 로봇이나 지표가 필요하신가요? 프리랜스로 주문하세요
프리랜스로 이동
Description:
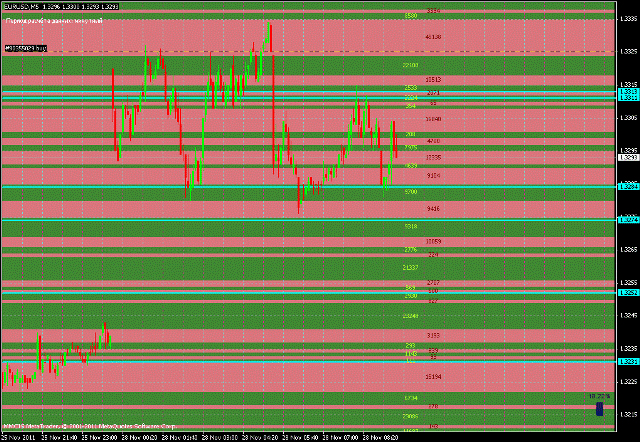
The indicator shows the buy/sell ranges.
The green zone means that at these price levels, more buys in a certain period of time, represents a numerical value on how many contracts the difference. The red zone represents the sells. So somewhere between Call/Put and Support/Resistance.
The indicator calculates Rj_Volume minute period and transmits the data to Rj_HSlice 1.1. This indicator should be used in conjunction with other indicators.
Installation: Throws two files in Terminal \ experts \ indicators, compiling editor and Rj_HSlice attach to the chart.
Rj_Volume do not attach to the chart.
Lack of him that on the 5-digit terminal value bump against each other.
In Rj_HSlice 1.1 added modified HF calculation data, ie not only minute blunder, but the other FFs.
CalcPeriod = 1, all in minutes. If the rendering must be done in the time say FF, then the place must 60. Protection against configuration errors, even if it put 50, it will still look for the closest senior timeframe.
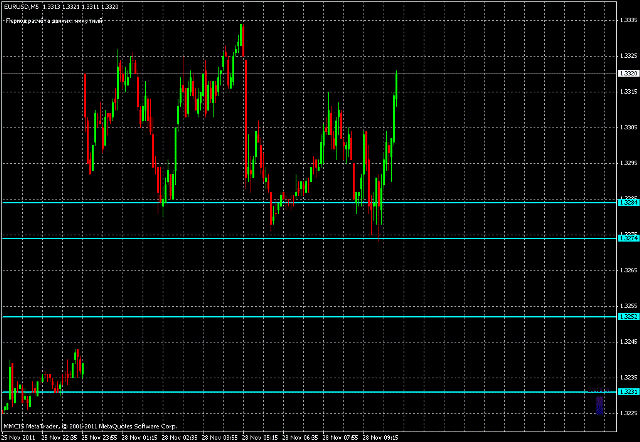
In a commentary in the upper left corner indicates which TF is calculated.
ShowLevelsOn = true; by default shows all price levels. false removes all levels.
ShowContractOn = true; same thing, only with the values of the contracts. removes all false values.
BackgroundLevelOn = true; When the ShowLevelsOn background rendering.
ShowTurningOn = true; Sets the support line of resistance. At certain levels, values of contracts are similar. To do this, there is an option
PercentDiscrep = 0.2; rate differences, by default, 20%, ie difference between the levels of no more than 20%. 0.1 is 10%, etc etc.
The lines are changed dynamically, but you can still keep track of where and how the price behaves, respectively, from this you can draw any conclusions.
ColorLine = Aqua; color lines.
ShowLevelsOn = false.
If you are interested, the essence of the idea is as follows:
If the candle Open [] <Close [], then
buy = (High []-Low [])+( Close []-Open [])
sell = High []-Low []
then dist = Volume [] / (buy + sell) = volume of distribution / point, and then the arrays are going to
Call = dist * buy / sell
Put = dist
Same with the bearish candle, just mirrored.
Who to test a blue screen or it shows nothing or history must upload or save it as a template.
So watch the Experiment, ask questions, answer all the possible profit to the connection.
MetaQuotes Ltd에서 러시아어로 번역함.
원본 코드: https://www.mql5.com/ru/code/10526
Show Number Consecutive Heiken Ashi Candles
Many consecutive Heiken Ashi candles of the same color often indicate a soon and harsh trend reversal. This indicator shows the number of consecutive same color candles. So you can see overbought and oversold situation at first glance.
ADX-StDev
Average Directional Movement Index with Standard Deviation
 qFollow EA
This EA implements a trailing stop buy and a trailing stop sell. It places an order above the price and below the price. The sell stop order will fall with the price, the stop sell order will rise.
Figurelli RSI
In my opinion, Welles Wilder RSI (Relative Strength Index) is a great momentum oscillator that works fine for small periods values (from 2 to 20). So I did some changes to it performe as good for greater periods, like 120, introducing a gain variable.