Cristian David Castillo Arrieta / プロファイル
- 情報
|
2 年
経験
|
4
製品
|
97
デモバージョン
|
|
0
ジョブ
|
1
シグナル
|
0
購読者
|
私の仕事の核心は、孤立した戦略ではなく、協調的なポートフォリオとして機能するエキスパートアドバイザーの設計、最適化、検証にあります。相関分析、時間カバレッジマッピング、資産クラスの分散化を活用し、単一の商品や単一のアプローチに依存しないシステムを構築しています。
現在、外国為替、株価指数、貴金属、エネルギー、米国株式にまたがるアルゴリズムポートフォリオを管理しており、複数のセッションと時間軸で同時に運用しています。
このコミュニティでは、技術記事やオープンソースツールを通じて自身の経験を共有しています。「個々のEAを構築する」ことから「ポートフォリオをエンジニアリングする」ことへの転換こそが、リテールと機関投資家の思考を分ける境界線であると確信しており、その信念が私がここで公開するすべてのものの指針となっています。
Why it's different
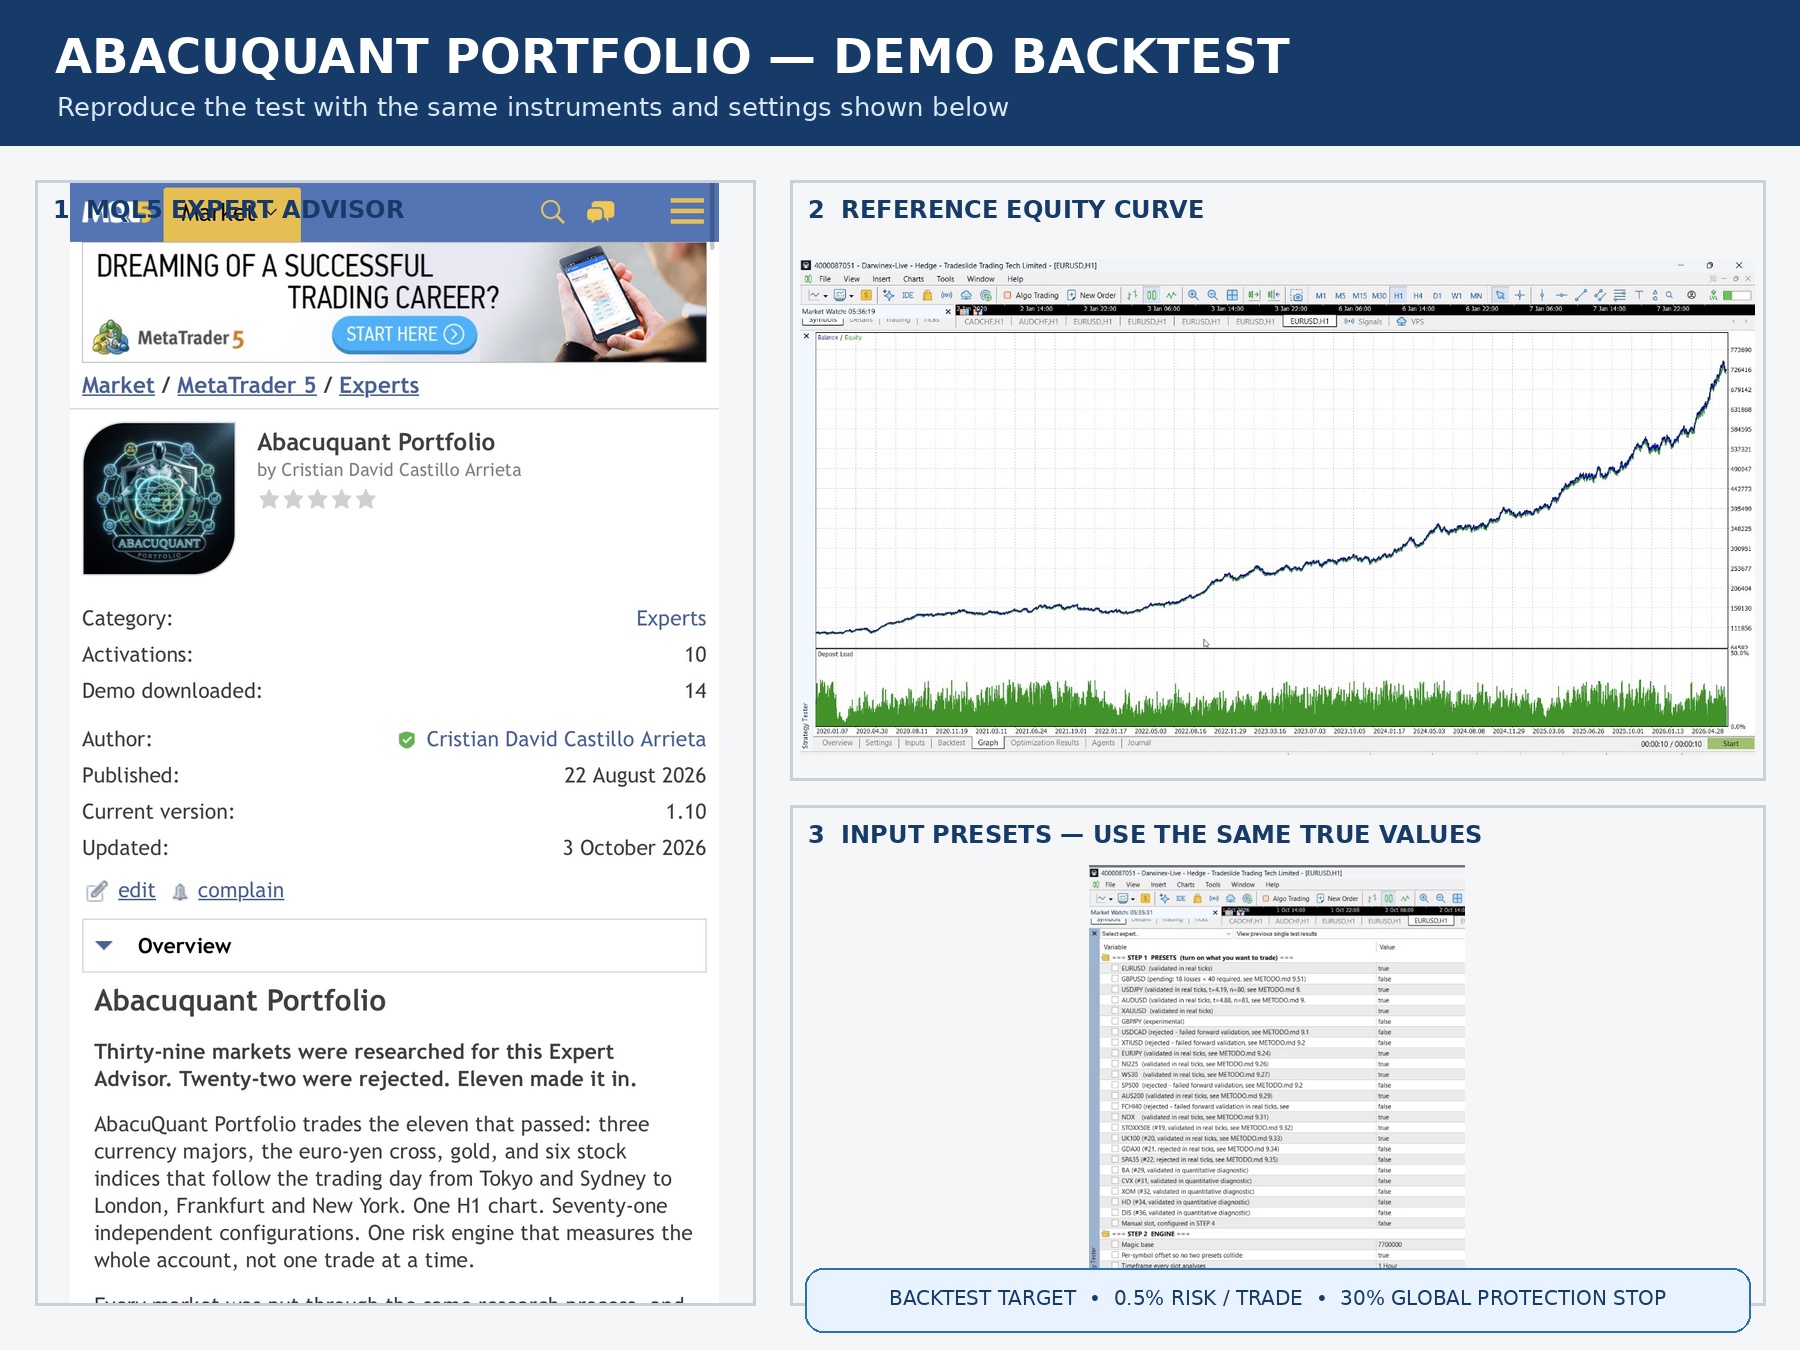
Most EAs run one strategy with one set of parameters on one instrument. This one runs up to 48 independent configurations at once, across EURUSD, GBPUSD, USDJPY and AUDUSD, from a single chart. Each configuration owns its own trading hours, its own combination of ten built-in strategies, and its own ATR-based stop and target. A configuration built for the London session simply doesn't trade outside it — and risk is measured across the whole account, not per configuration, so running four instruments together doesn't quietly multiply your exposure.
And it's built the honest way: no martingale, no grid, no averaging into a losing position, no hidden loss-recovery logic. Every stop is attached the moment the trade opens. If you've been burned by an EA with a beautiful equity curve that fell apart the first time the market disagreed with it, this was built specifically against that failure mode.
How it decides a trade
Each active configuration waits for its window, reads only completed H1 bars (never the forming candle), requires several of its enabled strategies to agree, and sizes the position from the stop distance rather than a fixed lot — so a wider stop always means a smaller position, and the money at risk stays constant. Every configuration passed the same acceptance procedure on real-tick data before it shipped: statistical significance over its own break-even line, a minimum number of losing trades to actually measure it, and stops that were genuinely reached rather than just theorized.
Try it before you take my word for it
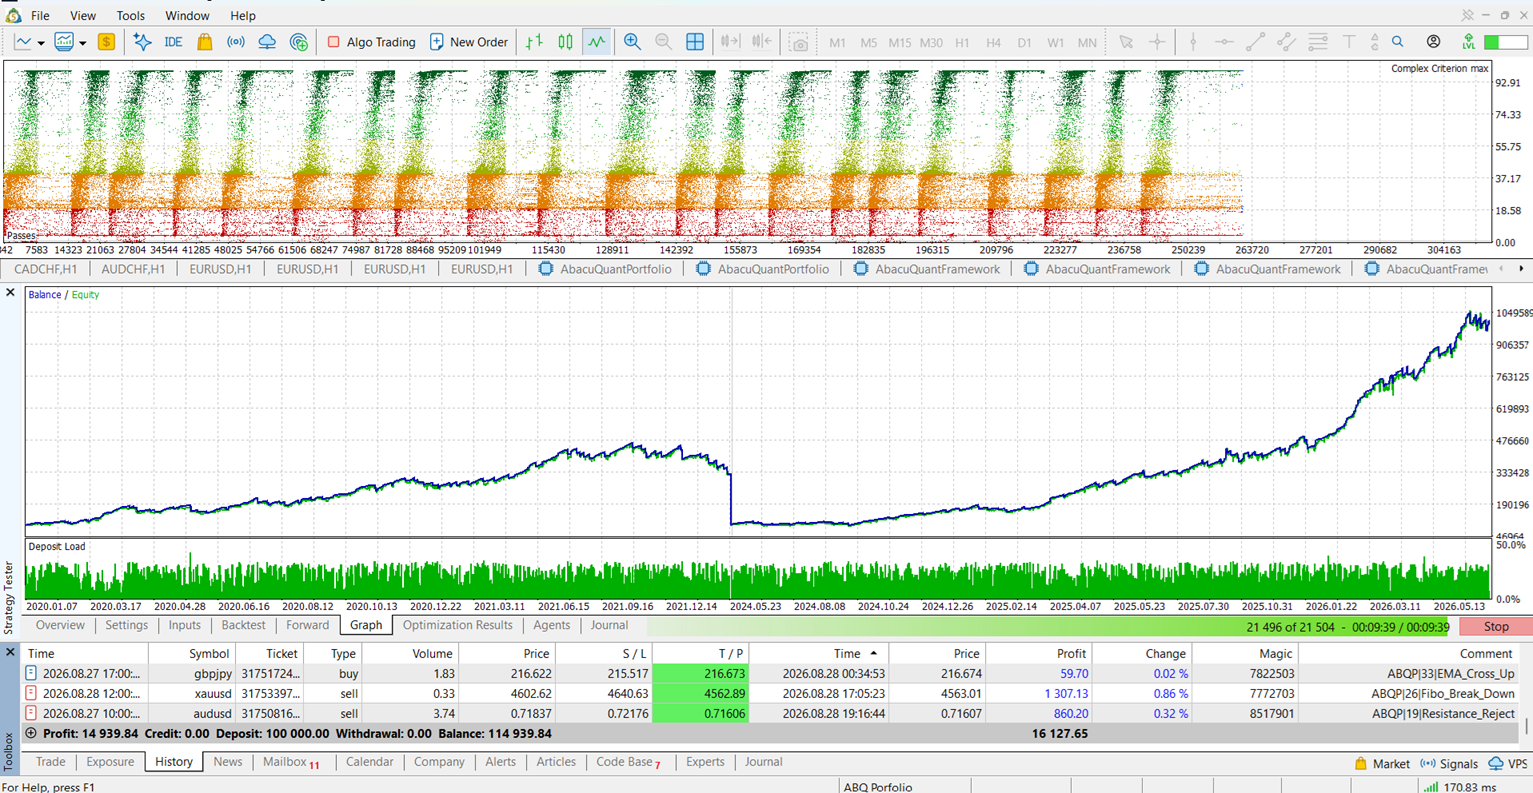
The demo runs in full inside the Strategy Tester — same presets, same logic, no time limit. Turn on the validated instruments, select "Every tick based on real ticks," and look at the trade list yourself: the stops, the position sizing, the risk ceilings holding across instruments. I'd rather you find out in the tester, for free, than after committing real money.
Link to the product page: https://www.mql5.com/en/market/product/191885
AbacuQuant Portfolio:マルチ構成型 Expert Advisor 最大48個の独立したトレード構成。複数の取引銘柄。1つのチャート。口座全体で共有されるリスク管理。 MetaTrader 5向けのマルチ通貨対応Expert Advisorです。1つのH1チャートからEURUSD、GBPUSD、USDJPY、AUDUSDを取引し、検証済みのプリセット、完全な手動モードを備え、システム内にマーチンゲールやグリッド戦略は一切使用していません。 多くのExpert Advisorは、1つの戦略、1つのパラメータセット、1つの銘柄を中心に構築されています。しかし、1日の中で市場環境が変化すると、その単一構成が一部の時間帯では機能しても、それ以外では適さなくなる可能性があります。 AbacuQuant Portfolioは、複数の独立した構成を同時に実行します。それぞれが特定の市場環境と取引時間帯の組み合わせを対象として設計されています。各構成には独自の取引時間帯、戦略の組み合わせ、インジケーター期間、ATRベースのStop LossとTake
Aggregate metrics alone do not reveal how a trade sequence manages risk. This MQL5 tool analyzes closed positions to flag four structural patterns: post-loss volume escalation, overlapping same-direction entries, asymmetric payoffs, and a classical risk-of-ruin figure. The results are merged into a configurable A-F grade with concise recommendations to guide further review.
Backtests often understate spread, commission, and slippage. This MQL5 analyzer loads closing deals and simulates rising execution costs to measure robustness. It computes the breakeven cost per deal, the cushion over an assumed cost, the net profit and profit factor at that cost, and how many winners turn into losers, then summarizes the result with an A+ to F grade and targeted guidance.
Net profit and win rate tell you how much a strategy made, not how the result is distributed. This article builds a native MQL5 script that reads your closed trades and measures profit concentration: the top-N trade share, the Gini coefficient of the winners, an outlier-dependence stress test that removes the best few winners, and the largest day against a prop-firm consistency limit. It combines these into one A+ to F score with recommendations, running inside MetaTrader 5.
I was in a forum thread today about trailing stops on XAUUSD, and it made me put into words something I've been building my whole approach around for a while: almost every trailing method traders compare — EMA cross, Chandelier, ATR multiples, swing-structure trails — gets judged on a single backtest run over one continuous chunk of history. The "best" multiplier or ladder step that wins that test isn't actually the best method. It's the method that happened to fit whatever mix of trend and chop was sitting in that sample.
The fix I use is simple to describe and annoying to implement properly: split the history into volatility regimes first (I use ATR percentile over a rolling window, expansion vs. compression), then optimize and validate each piece of logic separately per regime instead of once over the whole dataset. A structural trail wins clearly in expansion. In compression it just gets chopped up by noise, and something tighter does better there. Neither method is "the winner" — the regime decides which one applies.
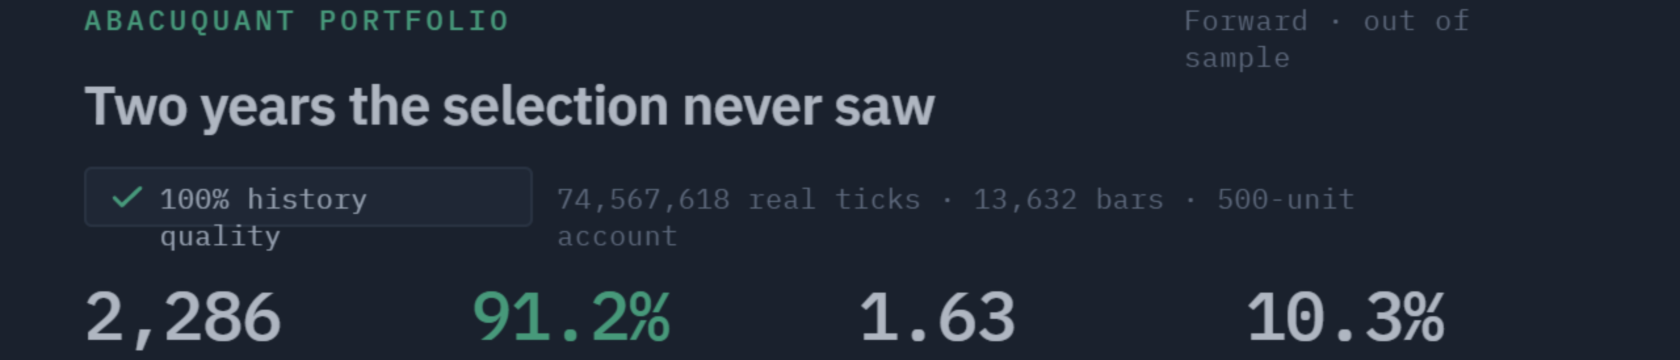
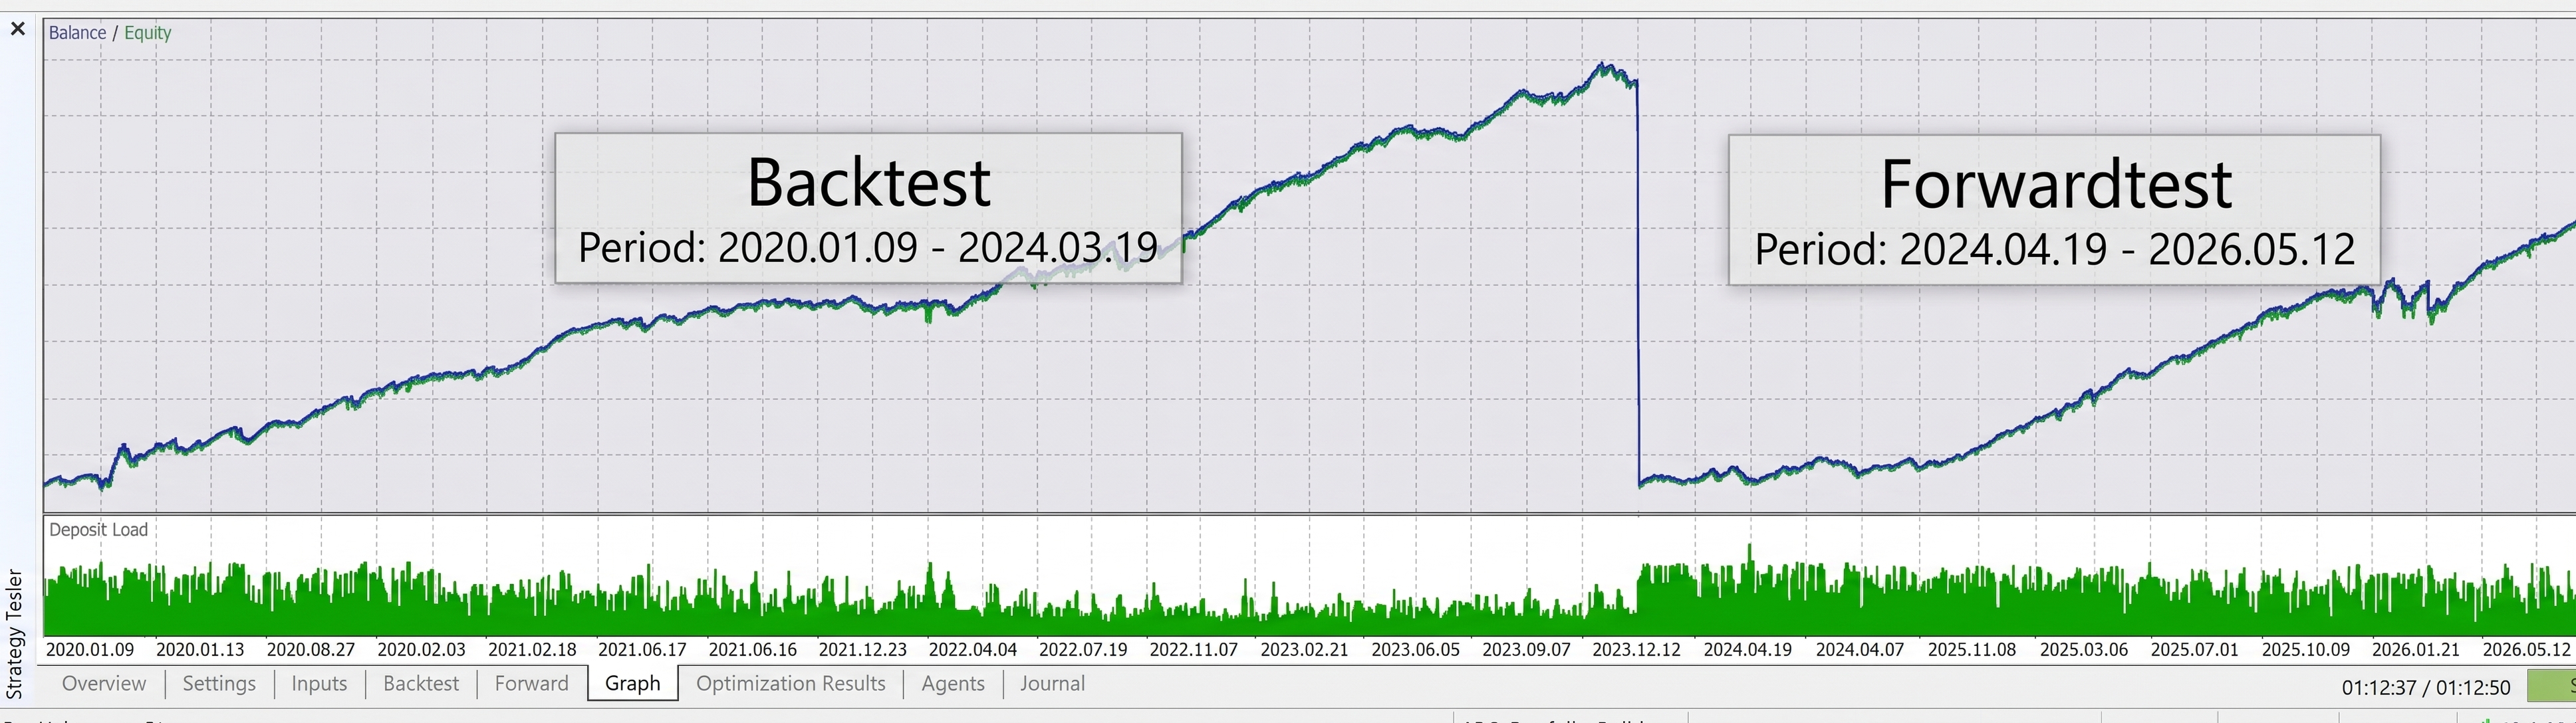
That's the same principle I ended up building AbacuQuant around, just scaled up from one exit rule to an entire portfolio. Instead of one strategy tuned to look good on one backtest, the logic behind each strategy is walk-forward tested and optimized (genetic optimization, not a single curve-fit) across different market regimes and asset classes, forex, metals, indices, energy, ETFs, individual stocks — and then combined into a portfolio specifically to keep cross-asset correlation low (the current version sits under 0.4 correlation across most pairs in the book). The idea isn't "find the one strategy that beats the market." It's "find enough structurally different, regime-validated pieces that the portfolio doesn't fall apart when one regime ends," which is exactly the failure mode people are describing in that XAUUSD thread, just at the position level instead of the portfolio level.
It also runs entirely inside your own MetaTrader account nothing custodial, your funds never move to a third party and the newer version adds the drawdown/consistency rules prop firms check for, since that's become how a lot of people are actually trading it live.
If any of this is useful for how you're thinking about your own trailing logic or portfolio construction, happy to go deeper in the comments. And if you want to see what the regime-validated approach looks like applied across a full portfolio rather than one exit rule, it's at abacuquant.com.
Cristian David Castillo Arrieta
Maximum drawdown is one number that hides what really matters: how often an equity curve declines, how long it stays below a previous peak, and how quickly it recovers. This article builds a native MQL5 tool that reconstructs the underwater curve, breaks it into individual drawdown episodes (depth, duration, recovery time), computes the Ulcer Index, Pain Index, and Recovery Factor, and combines them into a single resilience grade with practical recommendations. No external libraries, no Python, no AI.
Funded Trade Manager MT5 Most funded accounts are not lost to a bad strategy. They are lost to a single day that went too far: one oversized position, one revenge trade, one violated daily loss limit. Prop Firm Guard is a chart panel that applies the same limits your funding company applies, before the company does. What it does Tracks your daily loss limit and maximum drawdown in real time, using the same day-reset logic prop firms use (configurable server reset hour). Blocks any new trade
Most algo traders optimize Expert Advisors individually but never measure how they behave together on a single account. Correlated strategies amplify drawdowns instead of reducing them, and coverage gaps leave portfolios blind during entire trading sessions. This article builds a complete portfolio scorer in MQL5 that reads daily P&L from backtest CSV files, computes a full Pearson correlation matrix, maps trading activity by hour and weekday, evaluates asset class diversity, and outputs a composite grade from A+ to F. All source code is included; no external libraries are required.