 概要
概要 株
株 技術
技術 金融
金融 不動産
不動産 エネルギー
エネルギー 基本資料
基本資料 通信サービス
 消費者向けサイクル
 消費者防御
消費者防御 ヘルスケア
ヘルスケア 産業
産業 ユーティリティ
 その他の銘柄
 通貨
通貨 メジャー
メジャー マイナー
マイナー 北南米
北南米 欧州
欧州 アジア
アジア 暗号通貨
暗号通貨 金属
金属 指数
指数 コモディティ
 チャート
チャート ウィジェット
XAUGBP: 金 / スターリング・ポンド
XAUGBPの取引アプリ

An analysis dashboard for manual Gold traders that combines multi-timeframe trend state, ATR regime, daily and weekly reference levels, configurable session ranges, and a rules-based market context score on one chart panel. XAUUSD Market Intelligence Suite is a MetaTrader 5 chart indicator for XAUUSD and broker-specific Gold symbols. It organizes common intraday and short-term swing references into a compact dashboard and optional chart overlays. The panel shows M15, H1, H4, and D1 trend states,

REVOLUTIONIZE YOUR GOLD TRADING Gold Anunnaki is a high‑frequency institutional‑grade AI engineered Meta Trader hybrid for all Gold Spot Pairs (GOLD, GLD, XAUUSD, XAUGBP, XAUEUR, XAUAUD, BTCXAU etc). By integrating a proprietary machine learning data API that rivals the world’s most advanced financial terminals (including Bloomberg and Reuters), this EA captures unprecedented predictive accuracy to front‑run major gold trends before they materialize.
THE BLOOMBERG‑RIVAL PREDICTIVE ENGINE

XAUUSD の M15 チャート 1 枚から 6 つのゴールドペアを取引します: XAUUSD, XAUEUR, XAUGBP, XAUAUD, XAUJPY, XAUCHF。保有時間の中央値は約 2 時間、オーバーナイト持ち越しなし。全ポジションに注文と同時送信されるブローカー側ストップロス。
これは聖杯ではなく、そのように売るつもりもありません。実際のヒストリカルデータ上で規律をもって執行される、測定済みのエッジが 1 つあるだけです。
バックテスト、3000 USD 口座、2022年1月から2026年8月、初期設定: 合計 +1598.2%、年率 86.2%、プロフィットファクター 1.57、有効証拠金ドローダウン 23.82%、1553 トレード。
同じテストの、多くの出品が伏せる部分: 最悪の月 -15.4%、55 か月中 16 か月が負け、最長連敗は 3 か月、資産ピーク間の最長待機 258 日。
このページの数値はすべて Strategy Tester の結果です。 ライブシグナル - TechnoTrader EA Showcase この EA を出

Gold Shovel EA Gold Shovel EA は、 Gold Great British Pound(XAUGBP) の 2分足 チャート専用に設計されたExpert Advisorです。 ヘッジ取引 と、 マーチンゲール方式のリカバリー戦略 を使用した、損失トレードのコントロールされた回復を基本としています。 EAは、単純に損失が発生するたびにロットサイズを増加させる仕組みではありません。トレードが損失で決済されると、まず ATR、ADX、ボリンジャーバンド幅 を使用して現在の市場状況を分析します。その市場状況に基づいて、リカバリートレードを 同じ方向で行うか、反対方向で行うか を判断し、選択されたリカバリーロットを適用します。 目的は、市場状況に基づいたコントロールされたリカバリープロセスを維持しながら、リカバリートレードによって前回の損失を回復できる可能性を高めることです。 主な機能 ヘッジ(Hedging) — EAの取引およびリカバリーロジックの一部として、BuyとSellのトレードを同時に運用できます。 マーチンゲール・リカバリー — 損失トレードの後に、前回

概要 Seventh Heaven Multi Market Grid Trader は、スロットカスケード構造とアンカーグリッド戦略を用いる、MetaTrader 5 の両建て口座向けエキスパートアドバイザー(EA)です。ゴールドで開発・強化を重ね、検証済みの FX セットへと拡張された本製品は、一つの製品として最適化済みの 11 市場(XAUUSD、XAUEUR、XAUGBP、EURUSD、GBPUSD、USDJPY、USDCAD、AUDUSD、EURCAD、AUDCAD、EURCHF)をカバーします。これらのいずれかのチャートに適用すると、その市場のプリセットパックを用いてチャートの銘柄を取引します。 取引の仕組み スロットが空のとき、現在価格がそのアンカーとなり、グリッドステップ一つ分離れた位置でポジションが開かれます。ステップは口座通貨で設定され価格距離に換算されるほか、重複ガードが備わっています。スロットは Break モード(トレンドフォロー)または Range モード(両方向)で動作し、各パックにはその市場で検証されたモードが設定されています。グリッドは手数料とスワップ

Rojeryo Gold SMT Machine is an XAUUSD-focused Smart Money Technique expert advisor built to detect SMT divergence through pivot sweep behavior.
The EA uses XAUUSD as the main trading symbol and compares it with selected gold cross symbols such as XAUCHF, XAUSGD, XAUAUD, XAUCAD, XAUGBP, and XAUEUR. It can also use an optional inverse USDX/DXY-style comparison when your broker provides a USDX symbol.
Main Idea
Gold often moves with or against related gold crosses and the US dollar index. Rojer
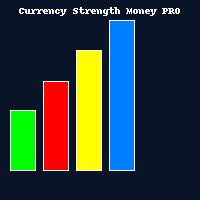
Description in English Currency Strength Money PRO — The Ultimate Currency Strength Indicator The Currency Strength Money PRO was designed for traders who need clarity and accuracy when analyzing Forex and Metals markets. ️ Modern LiveCharts-style display — colored bars instantly show which currencies are strong and which are weak.
️ Fully customizable — select currencies, timeframes, weights, and colors to fit your strategy.
️ Smart alerts — get notifications when a true imbalance between

バックテストではなく、実際の取引システムを購入してください。 Live Signal この価格はプロモーション期間中の一時的なもので、間もなく値上げされます 現在の価格では残りわずかです。次の価格は -->> 1480 $
Welcome to the GoldPulse AI
Hey, I'm GoldPulse AI! これは、XAUUSD、XAUEUR、XAUGBP、XAUAUD、XAUJPY、XAUCHF、XAUSGD、XAUCNH などの完全なペアで金または XAU を取引する最初の最もスマートなロボットです。 私は毎日ニュースをチェックし、技術的、基本的、感情的な裏付けが得られる機会はすべて利用します。せっかちなトレーダーのポケットから患者のポケットにお金が落ちます!
この市場では、賢い人々と競争することになります。彼らはあなたのお金を手に入れようとしており、あなたも彼らのお金を手に入れようとしています。最も正確で積極的な市場分析を使って、頑張ります!あなたの幸運を祈ります!
Highlights: シンプルで使いやすい:各シンボルチャート(XAUUSD、