Transformed Trend
- インディケータ
- バージョン: 1.0
- アクティベーション: 5
 Ltd")
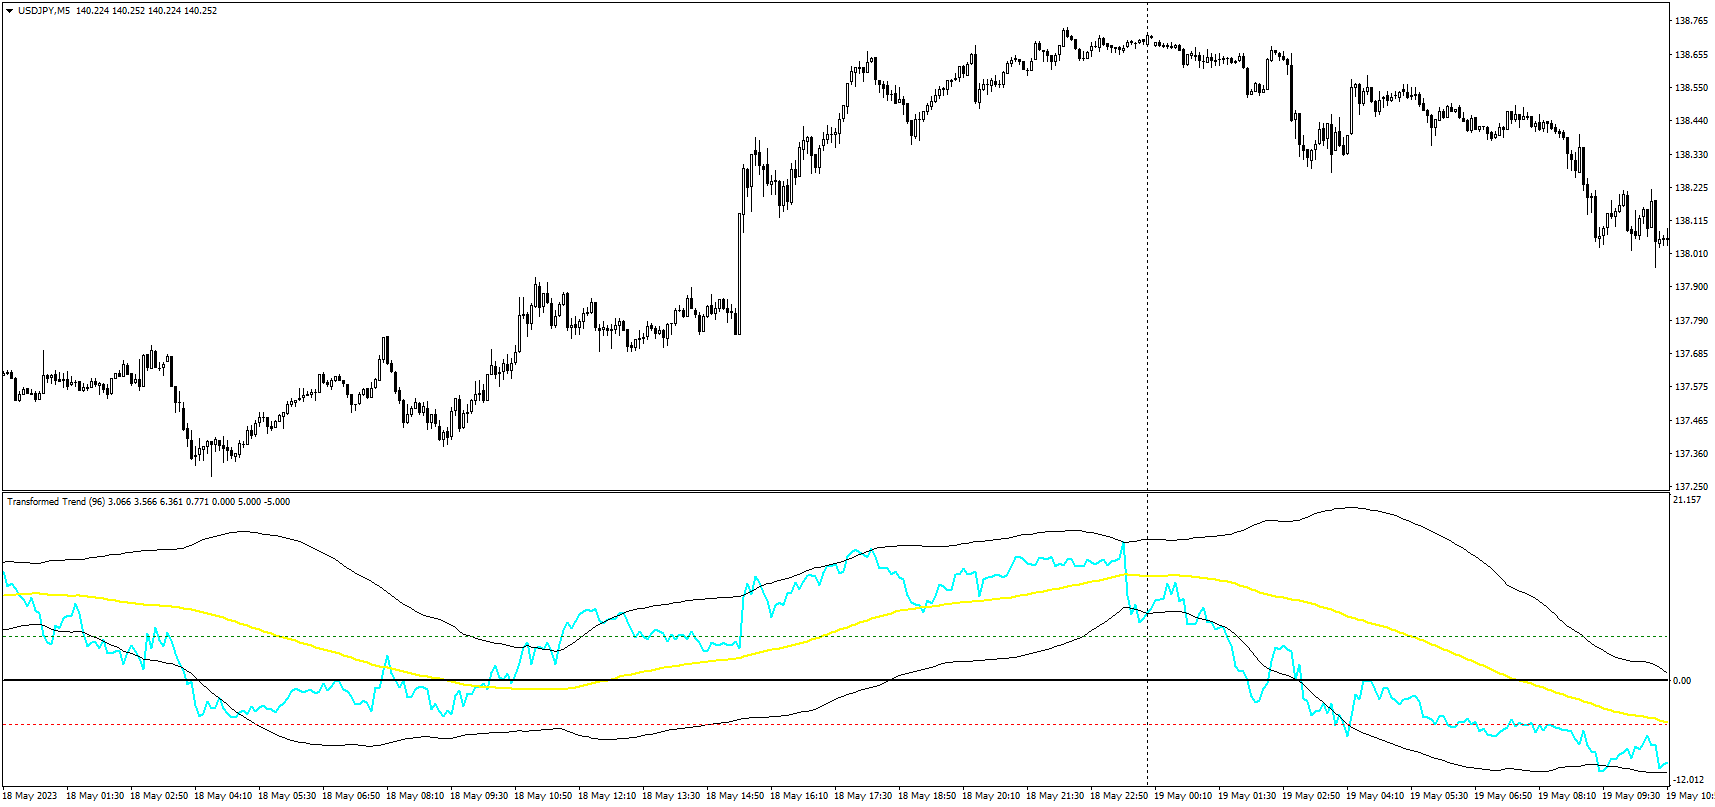
The indicator has been designed to function on any time-frame and any pair, although it is best suited for 5-minute charts.
This price transformation will help the trader better evaluate whether the current market is trending, and in which direction. A dynamic filter has been added to help the trader avoid possibly entering against the trend. Two filter threshold lines may enable the trader to avoid choppy or flat market conditions.
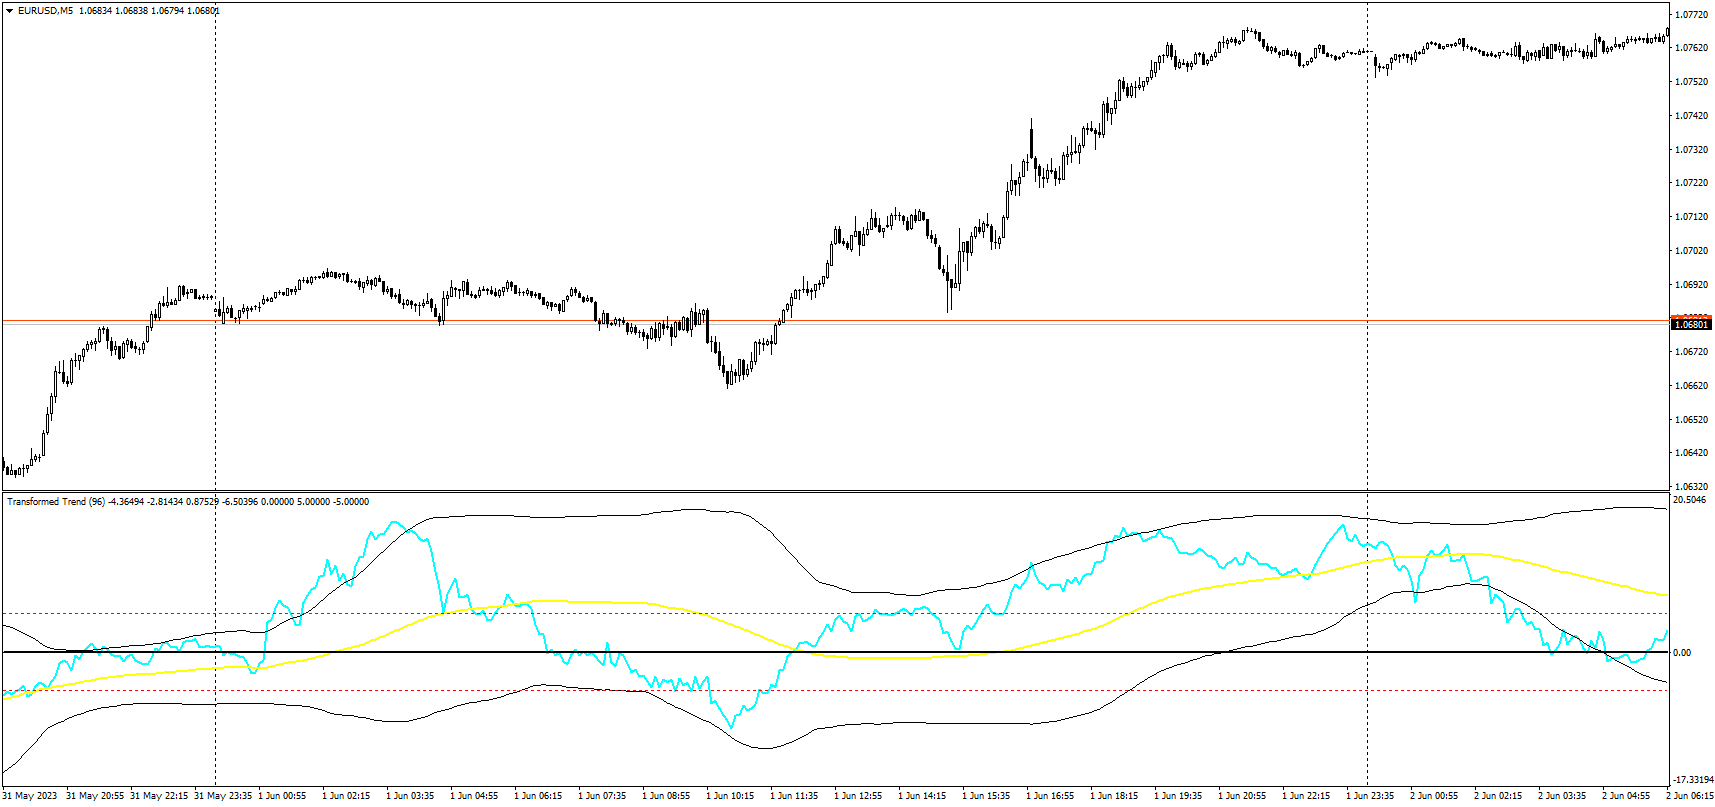
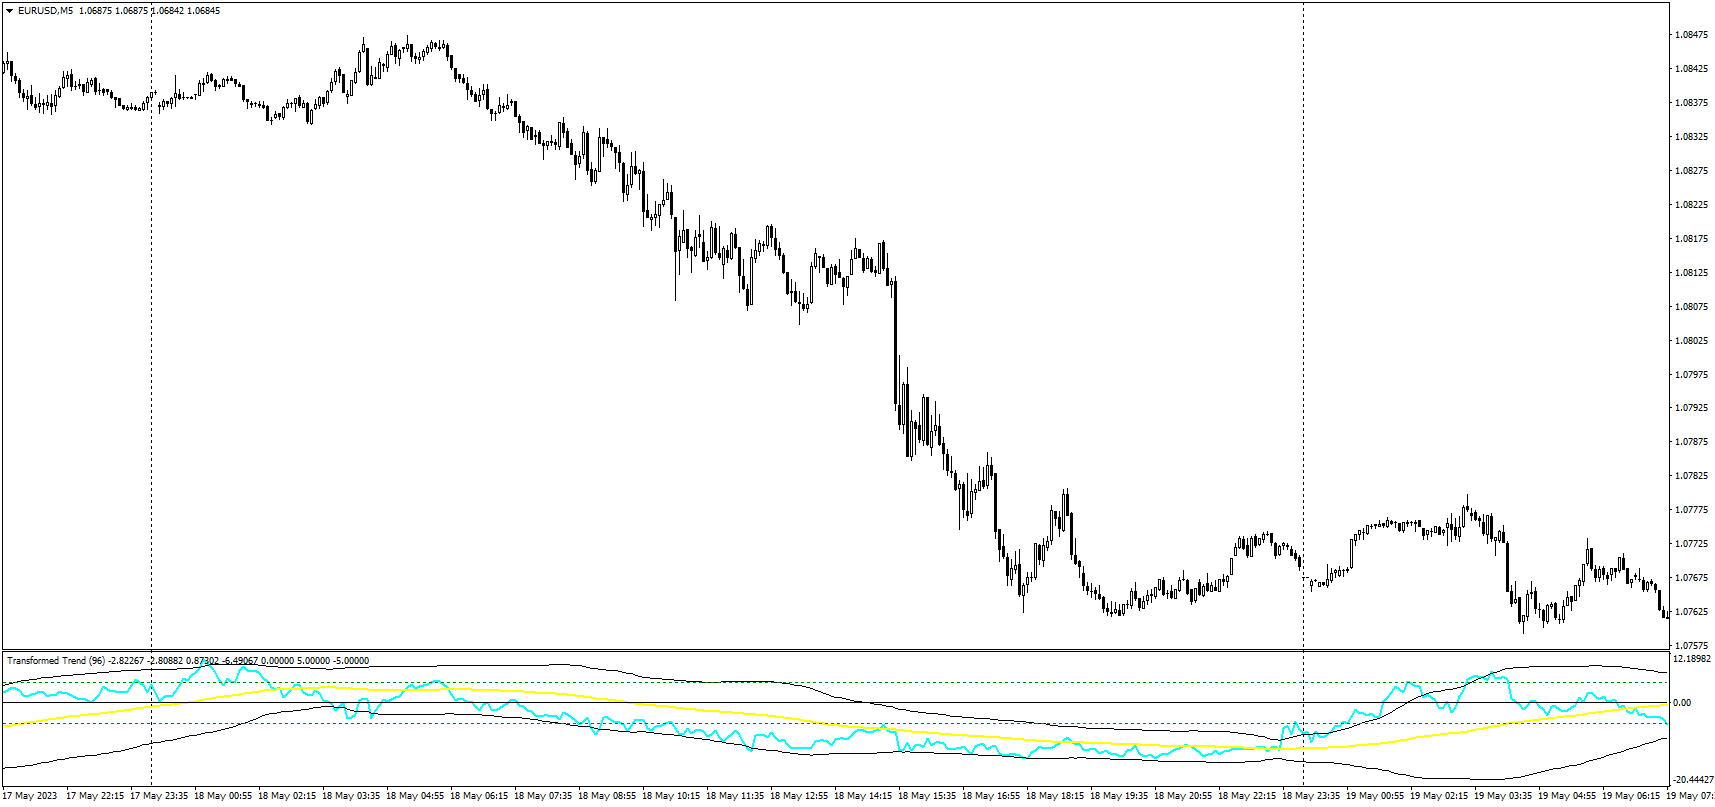
The Yellow indicator line is the filter and the Blue indicator line is the transformation of the price. When both the Blue indicator line is below the Yellow filter, the market is in a Downtrend. Added confidence is achieved if both of these indicator lines are also below the zero line.
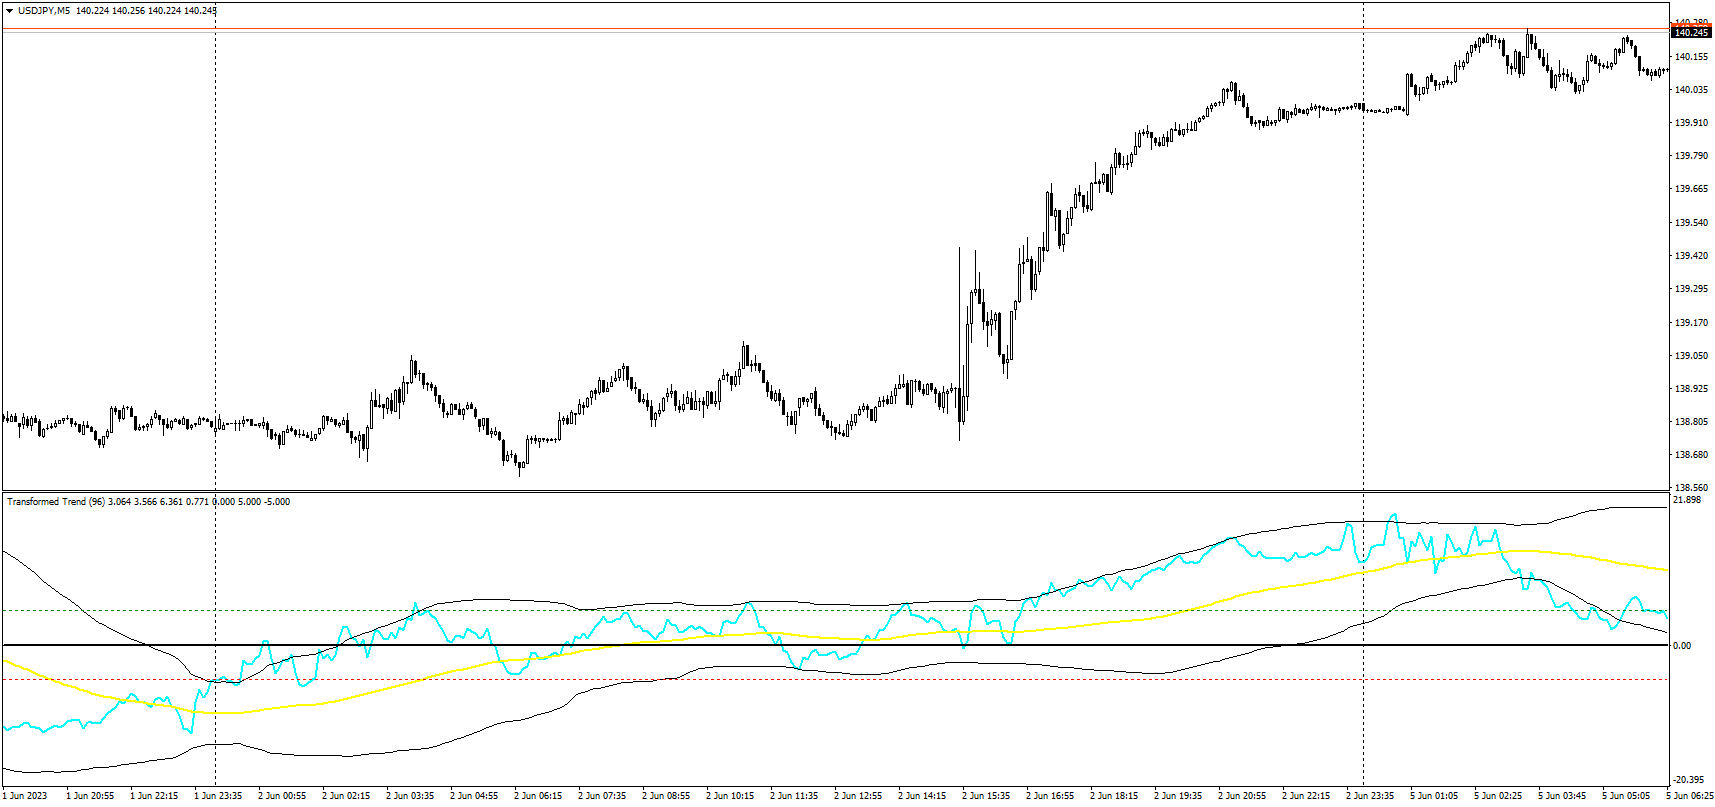
When the Blue indicator line is above the Yellow filter, the market is in a Uptrend. Added confidence is achieved if both of these indicator lines are also above the zero line.
Pre-set Standard Deviation bands have been added, to help filter out volatile conditions, as well as an overstretched market trend. These bands will enable the trader to enter the market in stable conditions.
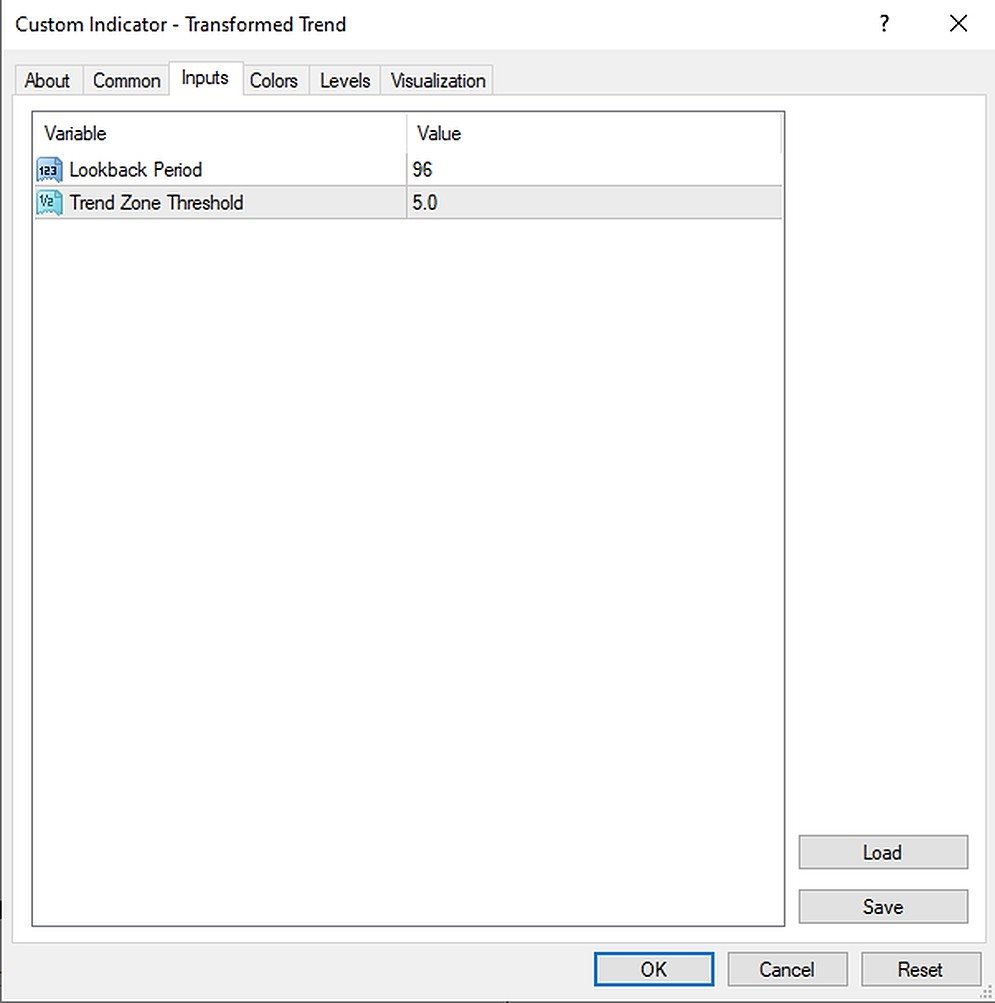
Two variable Trend Zone Thresholds may to reduce possible trade signal when the market is in a choppy or flat state.
This indicator can be used on its own, or add confluence to other signals generated within the trader’s existing strategy.