MAtrioMT5
- インディケータ
-
Yurij Batura
 親愛なるユーザーとお客様! サービスの質と理解を向上させるには、顧問を借りたり買う前に、構成の推奨事項を読み、必要に応じてメッセージングサービスを通じて私に連絡してください。
アドバイザーの設定BuySellProf - https://www.mql5.com/ru/blogs/post/690527 - バージョン: 1.0
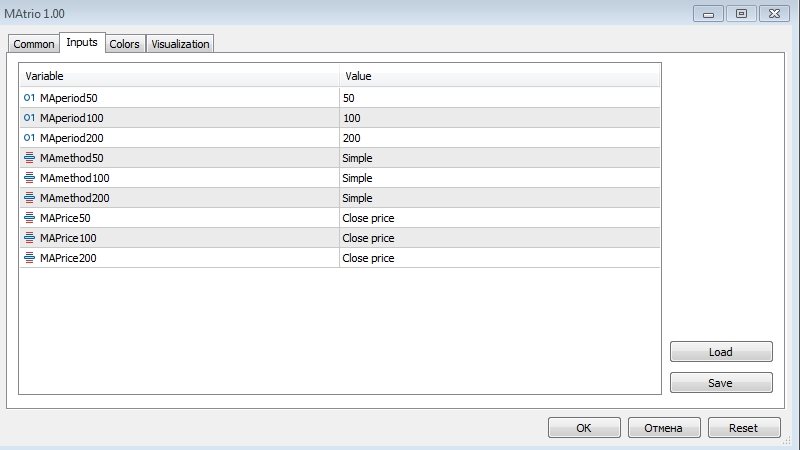
The MAtrio indicator displays three moving averages on any timeframe at once with a period of 50-day, 100-day, 200-day. After attaching to the chart, it immediately displays three moving averages with the parameters of simple (SMA) moving average MAmethod50 , simple (SMA) moving average MAmethod100 , simple (SMA) moving average MAmethod200 . Accordingly, with the price type MAPrice50 , MAPrice100 , MAPrice200 , by default, the price is Close price everywhere. All parameters (MA calculation method), including color and line type can be changed in the settings, see screenshot.
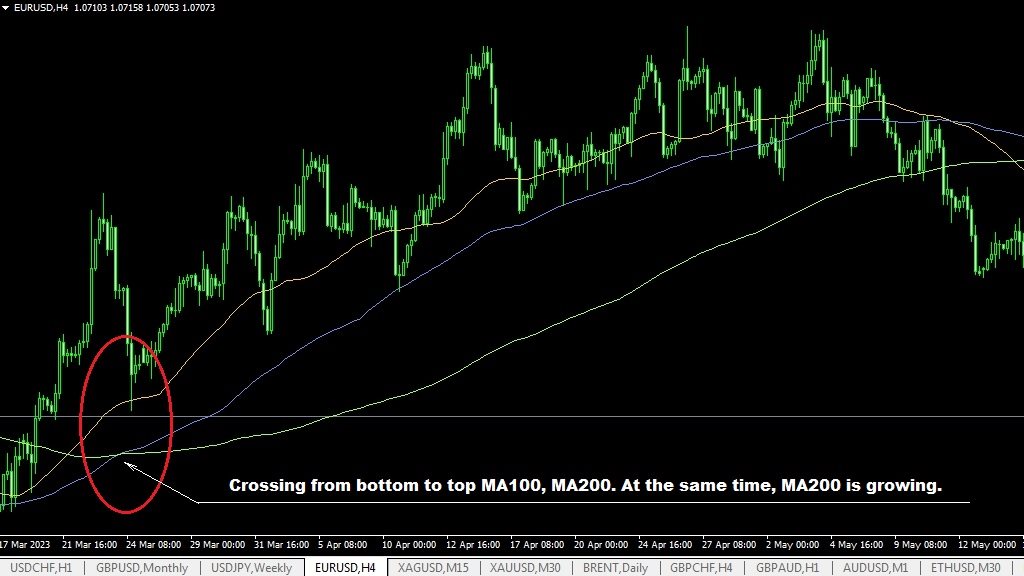
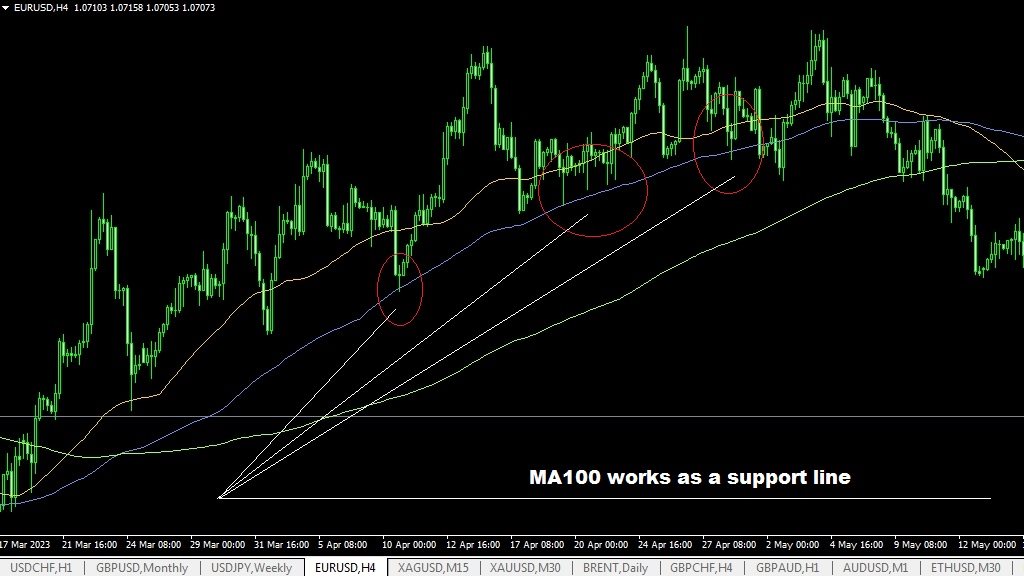
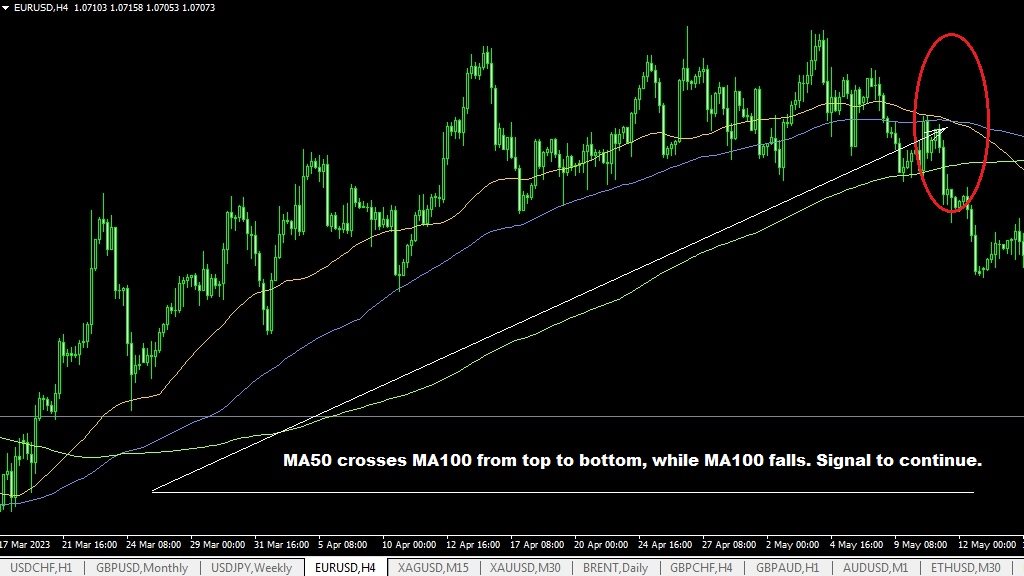
Simultaneous drawing of three generally accepted moving averages at once helps to quickly identify resistance and support lines, as well as the beginning and end of both an uptrend and a downtrend, in addition, the intersection of MA with a shorter period, MA with a longer period, gives an additional signal to buy or sell. For example, MA50 or MA100 crossed MA200 from below, this is a signal for a bullish trend, see screenshot. All three moving averages, separately, at intersections (punctures) with candles, give signals for both buying and selling.
For the MT4 terminal, the indicator is here.
Input parameters
- MAperiod50- number of single periods of the Moving Average indicator (50);
- MAmethod50 - smoothing type;
- MAPrice50 - at what price the indicator is calculated;
- MAperiod100- number of single periods of the Moving Average indicator (100);
- MAmethod100 - smoothing type;
- MAPrice100 - at what price the indicator is calculated;
- MAperiod200- number of single periods of the Moving Average indicator (200);
- MAmethod200 - smoothing type;
- MAPrice200 - at what price the indicator is calculated;